. 2021 Mar 31:10:e65012.
doi: 10.7554/eLife.65012.

Neural network of social interaction observation in marmosets

Affiliations

Neural network of social interaction observation in marmosets

Justine C Cléry et al. Elife. .

Abstract

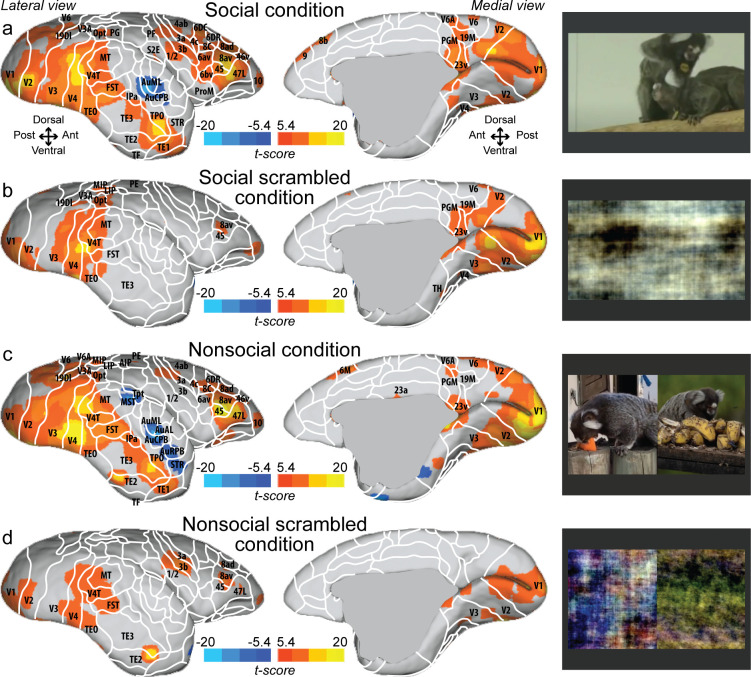
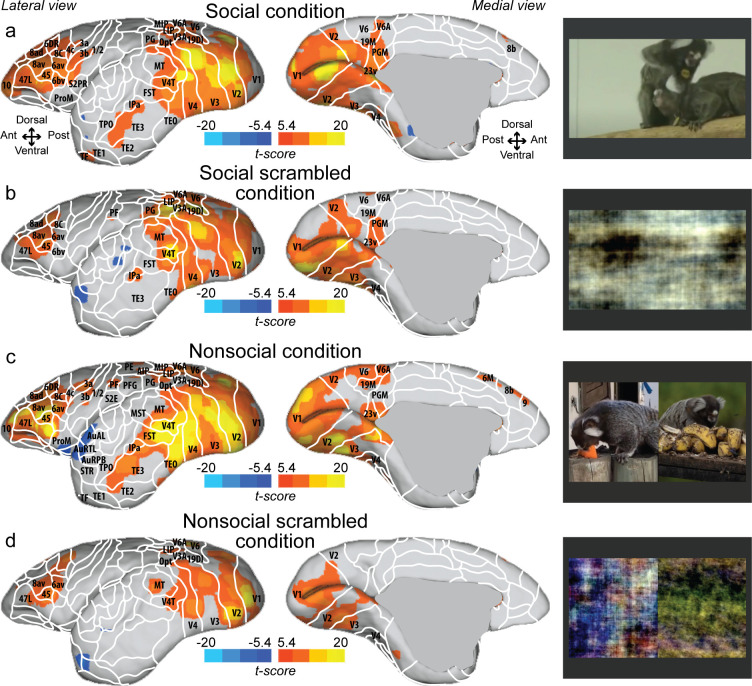
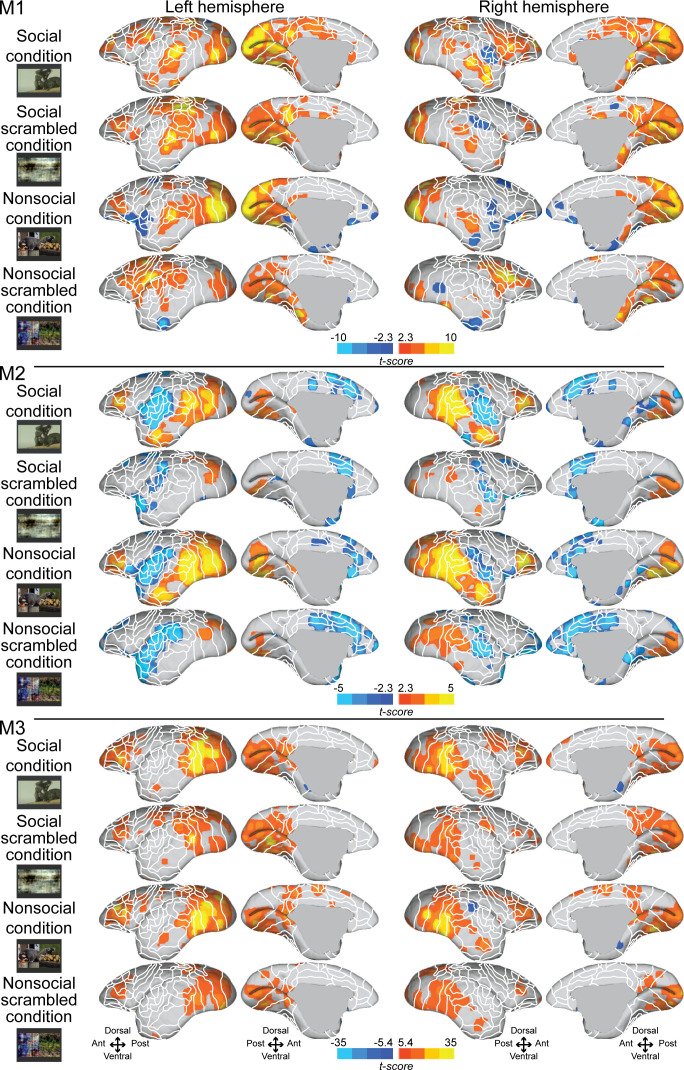
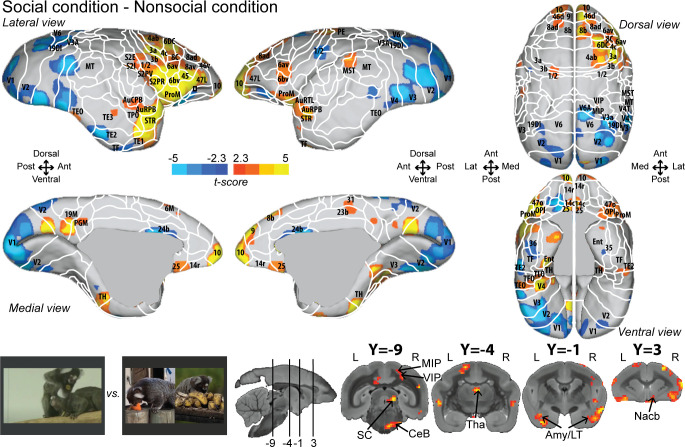
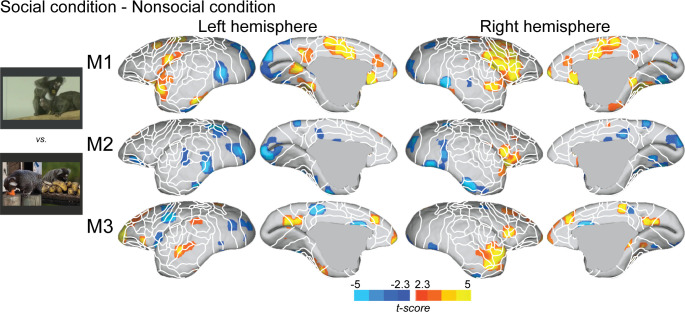
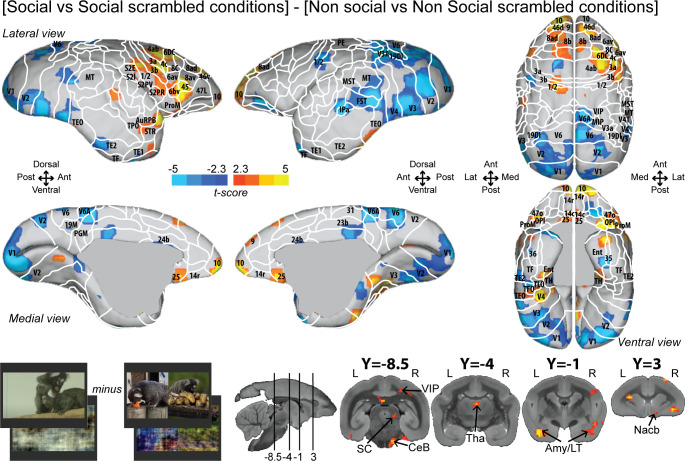
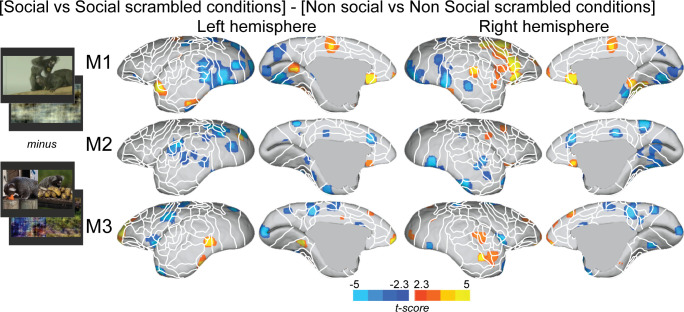
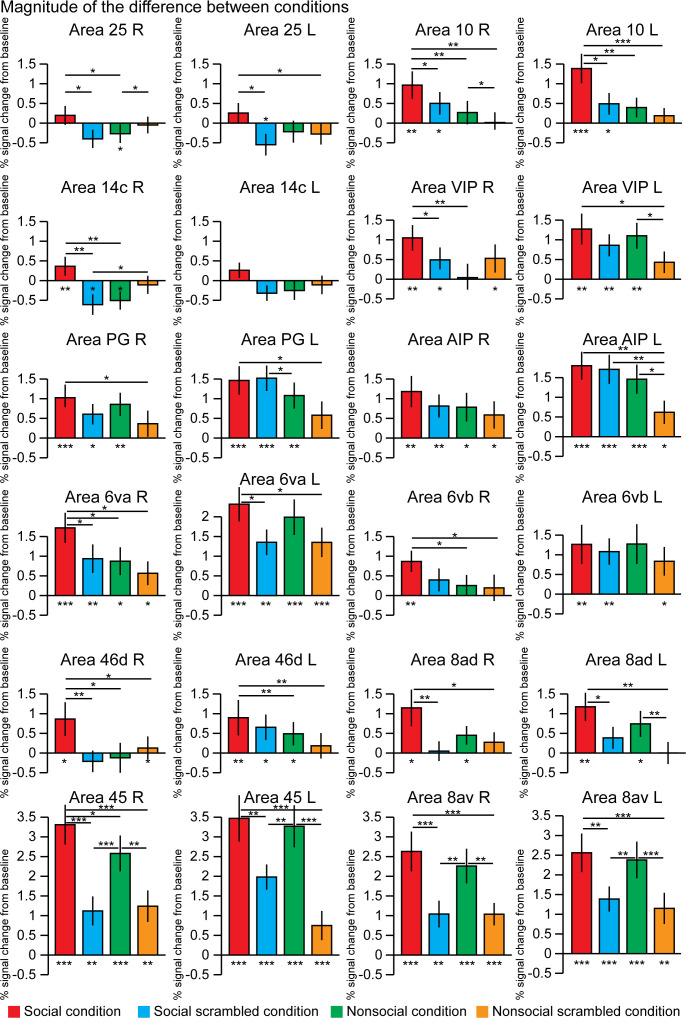
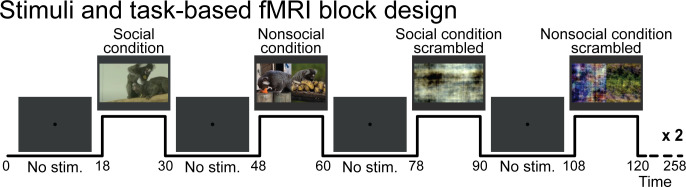
A crucial component of social cognition is to observe and understand the social interactions of other individuals. A promising nonhuman primate model for investigating the neural basis of social interaction observation is the common marmoset (Callithrix jacchus), a small New World primate that shares a rich social repertoire with humans. Here, we used functional magnetic resonance imaging acquired at 9.4 T to map the brain areas activated by social interaction observation in awake marmosets. We discovered a network of subcortical and cortical areas, predominately in the anterior lateral frontal and medial frontal cortex, that was specifically activated by social interaction observation. This network resembled that recently identified in Old World macaque monkeys. Our findings suggest that this network is largely conserved between New and Old World primates and support the use of marmosets for studying the neural basis of social cognition.

Keywords: fMRI; interaction; marmosets; network; neuroscience; observation; social.


Conflict of interest statement

JC, YH, DS, RM, SE No competing interests declared

Figures

Figure 1.
Figure 1.. Group functional topology maps for social (a), social scrambled (b), nonsocial (c), and nonsocial scrambled conditions (d).
Maps are displayed on the right fiducial brain surface (lateral and medial views). The white line delineates the regions based on the atlas from Paxinos et al., 2011. The regions associated with yellow/orange scale correspond to t-scores ≥ 5.4 (p<0.001, AFNI’s 3dttest++, cluster-size correction from Monte Carlo simulation, α = 0.05). The regions associated with blue scale correspond to t-scores ≤ –5.4 (p<0.001, AFNI’s 3dttest++, cluster-size correction from Monte Carlo simulation, α = 0.05). Group maps for the left hemisphere and individual maps for both hemispheres are shown in Figure 1—figure supplement 1 and Figure 1—figure supplement 2, respectively.
Figure 1—figure supplement 1.
Figure 1—figure supplement 1.. Group functional topology maps for social (a), social scrambled (b), nonsocial (c), and nonsocial scrambled conditions (d).
Maps are displayed on the left fiducial brain surface (lateral and medial views). The white line delineates the regions based on the atlas from Paxinos et al., 2011. The regions associated with yellow/orange scale correspond to t-scores ≥ 5.4 (p<0.001, AFNI’s 3dttest++, cluster-size correction from Monte Carlo simulation, α = 0.05). The regions associated with blue scale correspond to t-scores ≤ –5.4 (p<0.001, AFNI’s 3dttest++, cluster-size correction from Monte Carlo simulation, α = 0.05).
Figure 1—figure supplement 2.
Figure 1—figure supplement 2.. Individual functional topology maps for social (a), social scrambled (b), nonsocial (c), and nonsocial scrambled conditions (d) in monkeys 1–3.
Maps are displayed on both fiducial brain surface (lateral and medial views). The white line delineates the regions based on the atlas from Paxinos et al., 2011. The regions associated with yellow/orange scale correspond to t-scores ≥ 2.3 (p<0.05, AFNI’s 3dttest++, cluster-size correction from Monte Carlo simulation, α = 0.05) for monkeys 1 and 2; and t-scores ≥ 5.4 (p<0.001, AFNI’s 3dttest++, cluster-size correction from Monte Carlo simulation, α = 0.05) for monkey 3. The regions associated with blue scale correspond to t-scores ≤ –2.3 (p<0.05, AFNI’s 3dttest++, cluster-size correction from Monte Carlo simulation, α = 0.05) for monkeys 1 and 2; and t-scores ≥ −5.4 (p<0.001, AFNI’s 3dttest++, cluster-size correction from Monte Carlo simulation, α = 0.05) for monkey 3.
Figure 2.
Figure 2.. Group functional topology comparisons between social and nonsocial conditions.
Groups maps are displayed on the right and left fiducial marmoset brain surface (lateral, medial, ventral, and dorsal views) and coronal slices. The white line delineates the regions based on the atlas from Paxinos et al., 2011. Y-coordinates are calculated with respect to the anterior commissure (in millimeters). The regions associated with yellow/orange scale correspond to t-scores ≥ 2.3 (p<0.05, AFNI’s 3dttest++, cluster-size correction from Monte Carlo simulation, α = 0.05). The regions associated with blue scale correspond to t-scores ≤ –2.3 (p<0.05, AFNI’s 3dttest++, cluster-size correction from Monte Carlo simulation, α = 0.05). Nomenclature for coronal slices is as follows: Amy/LT: amygdala/lateral temporal; CeB: cerebellum; MIP: medial intraparietal area; Nacb: nucleus accumbens; SC: superior colliculus; Tha: thalamus; VIP: ventral intraparietal area. Individual maps for both hemispheres are shown in Figure 2—figure supplement 1.
Figure 2—figure supplement 1.
Figure 2—figure supplement 1.. Individual functional topology comparisons between social and nonsocial conditions.
Individual maps are displayed on the right and left fiducial marmoset brain surface (lateral, medial, ventral, and dorsal views) for monkeys 1–3. The white line delineates the regions based on the atlas from Paxinos et al., 2011. Y-coordinates are calculated with respect to the anterior commissure (in millimeters). The regions associated with yellow/orange scale correspond to t-scores ≥ 2.3 (p<0.05, AFNI’s 3dttest++, cluster-size correction from Monte Carlo simulation, α = 0.05). The regions associated with blue scale correspond to t-scores ≤ –2.3 (p<0.05, AFNI’s 3dttest++, cluster-size correction from Monte Carlo simulation, α = 0.05).
Figure 2—figure supplement 2.
Figure 2—figure supplement 2.. Temporal signal-to-noise ratio (tSNR) map for the group data.
The group map is represented on the axial slices of the marmoset brain surface. The left hemisphere shows slightly lower tSNR than the right hemisphere. A, P, L, and R indicate anterior, posterior, left, and right orientation, respectively.
Figure 3.
Figure 3.. Group functional topology of the interaction effect [social vs. social scrambled] minus [nonsocial vs. nonsocial scrambled].
Groups maps are displayed on the right and left fiducial marmoset brain surface (lateral, medial, ventral, and dorsal views) and coronal slices. The white line delineates the regions based on the atlas from Paxinos et al., 2011. Y-coordinates are calculated with respect to the anterior commissure (in millimeters). The regions associated with yellow/orange scale correspond to t-scores ≥ 2.3 (p<0.05, AFNI’s 3dttest++, cluster-size correction from Monte Carlo simulation, α = 0.05). The regions associated with blue scale correspond to t-scores ≤ –2.3 (p<0.05, AFNI’s 3dttest++, cluster-size correction from Monte Carlo simulation, α = 0.05). Nomenclature for coronal slices is as follows: Amy/LT: amygdala/lateral temporal; CeB: cerebellum; Nacb: nucleus accumbens; SC: superior colliculus; Tha: thalamus; VIP: ventral intraparietal area. Individual maps for both hemispheres are shown in Figure 3—figure supplement 1.
Figure 3—figure supplement 1.
Figure 3—figure supplement 1.. Individual functional topology of the interaction effect [social vs. social scrambled] minus [nonsocial vs. nonsocial scrambled].
Individual maps are displayed on the right and left fiducial marmoset brain surface (lateral, medial, ventral, and dorsal views) for monkeys 1–3. The white line delineates the regions based on the atlas from Paxinos et al., 2011. Y-coordinates are calculated with respect to the anterior commissure (in millimeters). The regions associated with yellow/orange scale correspond to t-scores ≥ 2.3 (p<0.05, AFNI’s 3dttest++, cluster-size correction from Monte Carlo simulation, α = 0.05). The regions associated with blue scale correspond to t-scores ≤ –2.3 (p<0.05, AFNI’s 3dttest++, cluster-size correction from Monte Carlo simulation, α = 0.05).
Figure 4.
Figure 4.. The magnitude of the difference between conditions within 12 regions of interests.
These differences were calculated after extraction of the time series from these regions defined in the left and right hemisphere using the Paxinos et al., 2011 atlas and based on the group activation maps. The differences from the baseline (below each bar graph) and conditions (horizontal bars) were assessed using paired t-test, *p<0.05, **p<0.01, ***p<0.001. The error bars correspond to the standard error.
Figure 5.
Figure 5.. Stimuli and task-based functional magnetic resonance imaging block design.
Social condition videos, nonsocial condition videos, and their scrambled versions were displayed in a screen during task conditions blocks (12 s each) and separated by baseline blocks where a central dot was displayed in the center of the screen (18 s each). A gray background was displayed behind the dot and videos through the sequence.

References

    1. Alexander L, Clarke H, Roberts A. A focus on the functions of area 25. Brain Sciences. 2019;9:129. doi: 10.3390/brainsci9060129. - DOI - PMC - PubMed
    1. Alexander L, Wood CM, Gaskin PLR, Sawiak SJ, Fryer TD, Hong YT, McIver L, Clarke HF, Roberts AC. Over-activation of primate subgenual cingulate cortex enhances the cardiovascular, behavioral and neural responses to threat. Nature Communications. 2020;11:5386. doi: 10.1038/s41467-020-19167-0. - DOI - PMC - PubMed
    1. Ambady N, Bernieri FJ, Richeson JA. Toward a histology of social behavior: judgmental accuracy from thin slices of the behavioral stream. Advances in Experimental Social Psychology. 2000;32:201–271. doi: 10.1016/S0065-2601(00)80006-4. - DOI
    1. Avants BB, Tustison NJ, Song G, Cook PA, Klein A, Gee JC. A reproducible evaluation of ANTs similarity metric performance in brain image registration. NeuroImage. 2011;54:2033–2044. doi: 10.1016/j.neuroimage.2010.09.025. - DOI - PMC - PubMed
    1. Balasubramaniam KN, Beisner BA, Berman CM, De Marco A, Duboscq J, Koirala S, Majolo B, MacIntosh AJ, McFarland R, Molesti S, Ogawa H, Petit O, Schino G, Sosa S, Sueur C, Thierry B, de Waal FBM, McCowan B. The influence of phylogeny, social style, and sociodemographic factors on macaque social network structure. American Journal of Primatology. 2018;80:e22727. doi: 10.1002/ajp.22727. - DOI - PubMed

Publication types

Grants and funding