. 2021 Apr 13;5(7):1816-1829.
doi: 10.1182/bloodadvances.2020003080.

Functional characterization of PD1+TIM3+ tumor-infiltrating T cells in DLBCL and effects of PD1 or TIM3 blockade

Affiliations

Functional characterization of PD1+TIM3+ tumor-infiltrating T cells in DLBCL and effects of PD1 or TIM3 blockade

Mikaël Roussel et al. Blood Adv. .

Abstract

In diffuse large B-cell lymphoma (DLBCL), tumor-infiltrating T lymphocytes (TILs) are involved in therapeutic responses. However, tumor-specific TILs can be dysfunctional, with impaired effector functions. Various mechanisms are involved in this exhaustion, and the increased expression of programmed cell death receptor 1 (PD1) and TIM3 on dysfunctional cells suggests their involvement. However, conflicting data have been published regarding their expression or coexpression in DLBCL. We evaluated the presence and phenotype of CD4+ and CD8+ TILs in freshly collected tumor tissues in DLBCL and compared the results with those in follicular lymphoma, classical Hodgkin lymphoma, and nonmalignant reactive lymphadenopathy. We found that TILs expressing both PD1 and TIM3 were expanded in DLBCL, particularly in the activated B cell-like subgroup. Isolated PD1+TIM3+ TILs exhibited a transcriptomic signature related to T-cell exhaustion associated with a reduction in cytokine production, both compromising the antitumor immune response. However, these cells expressed high levels of cytotoxic molecules. In line with this, stimulated PD1+TIM3+ TILs from DLBCL patients exhibited reduced proliferation and impaired secretion of interferon-γ, but these functions were restored by the blockade of PD1 or TIM3. In summary, the PD1+TIM3+ TIL population is expanded and exhausted in DLBCL but can be reinvigorated with appropriate therapies.


Conflict of interest statement

Conflict-of-interest disclosure: D.O. is cofounder of ImCheck Therapeutics, Alderaan Biotechnology, and Emergence Therapeutics and is a shareholder in these companies. The remaining authors declare no competing financial interests.

Figures

None
Graphical abstract
Figure 1.
Figure 1.
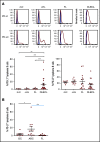
Lymphoma B cells from ABC DLBCL strongly express PD-L1. (A) Representative histograms of PD-L1 and PD-L2 expression on isotype-restricted clonal B cells, except for cHL (top), and percentage of B cells expressing PD-L1 or PD-L2 in DLBCL (n = 23), FL (n = 15), cHL (n = 10), and rLN (n = 7) samples (bottom). (B) Percentage of PD-L1+ lymphoma cells in GC DLBCL (n = 9), ABC DLBCL (n = 12), and FL (n = 15) samples. *P < .05, **P < .01, ***P < .001 by Mann-Whitney nonparametric U test.
Figure 2.
Figure 2.
PD1+TIM3+CD4+T cells and PD1+TIM3+CD8+T cells are enriched in ABC DLBCL tissues. (A) Representative histograms of PD1, PD-L1, PD-L2, TIM3, and CD80 expression on CD8+ T cells from 1 rLN and 1 DLBCL sample (left). PD1, PD-L1, PD-L2, BTLA, HVEM, CD80, TIM3, HLA-DR, and Ki67 expression on CD4+ and CD8+ T cells in DLBCL (n = 25), FL (n = 15), cHL (n = 10), and rLN (n = 7) samples (right). The percentage of Ki67+ cells and median fluorescence intensity (MFI) for other markers were normalized and hierarchically clustered using Tmev software. (B) Percentage of CD4+ and CD8+ T cells expressing PD1 and TIM3 in DLBCL (n = 25), FL (n = 15), cHL (n = 10), and rLN (n = 7) samples. (C) Percentage of PD1+TIM3+ CD8+ T cells and PD1+TIM3+ CD4+ T cells in GC DLBCL (n = 9), ABC DLBCL (n = 14), and FL (n = 15) samples. Correlation between percentages of PD1+TIM3+ CD8+ T cells and percentages of PD1+TIM3+ CD4+ T cells on DLBCL samples (GC, blue; ABC, red; unknown, green). (D) Representative mIHC staining in a DLBCL sample (magnification ×100). Yellow arrows show a CD8+ (blue), PD1+ (red), TIM3+ (green) cell that expresses Ki67 (white). *P < .05, **P < .01, ****P < .0001 by Mann-Whitney nonparametric U test.
Figure 3.
Figure 3.
CD8+T-cell expression of PD1 and TIM3 in DLBCL vs rLN and their colocalization with B cells. In this DLBCL sample, the yellow box shows 4 cells expressing CD8 (blue), PD1 (red), and TIM3 (green) in contact with CD20+ lymphoma cells, identified by the white box. These CD8+ T cells frequently localize in the CD20+ infiltrate (turquoise). In this rLN sample, the CD8+ T cells (blue) sometimes express PD1 (red) but not TIM3 (green). They are found at the periphery of the CD20+ cluster. Original magnification ×60.
Figure 4.
Figure 4.
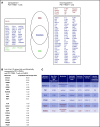
PD1+TIM3+T cells display an exhausted transcriptomic signature. (A) Genes differentially expressed by PD1+TIM3+ and PD1TIM3 T-cell subsets. Genes are classified as specific to CD4+ T cells (red) or CD8+ T cells (green) or common to both subsets (blue). (B) List of top-10 genes differentially expressed by PD1+TIM3+ and PD1TIM3 T-cell subsets. (C) Upstream regulators for genes differentially expressed by PD1+TIM3+ and PD1TIM3 T-cell subsets.
Figure 5.
Figure 5.
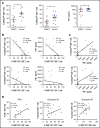
In DLBCL tumors, PD1+TIM3+T cells are exhausted. CellTrace violet–labeled mononuclear cells from DLBCL (n = 13) and control group (n = 12 [rLN, n = 3; cHL, n = 6; FL, n = 3]) tissues were activated by plate-coated CD3 and soluble CD28 antibodies. (A) Proliferative capacity of CD4+ and CD8+ T cells, determined by the percentage of CellTracedim cells and the concentration of IFN-γ detected in the culture supernatant. (B) Correlation between the percentage of PD1+TIM3+ CD4+ or CD8+ T cells and their proliferation and IFN-γ secretion (n = 18 or 20 DLBCL). (C) Correlation between the percentage of proliferated T cells and the concentration of IFN-γ detected in the supernatant (n = 18 or 20 DLBCL;GC, blue; ABC, red; unknown, green). (D) Correlation between percentage of CD4+ or CD8+ T cells coexpressing PD1 and TIM3 and their intracellular IFN-γ or granzyme B secretion (n = 12; GC, blue; ABC, red; cell of origin not defined, green).
Figure 6.
Figure 6.
The PD1+TIM3+T cell–exhausted phenotype. (A) Expression of CD45RA, CCR7, CD27, CD28, and CD127 by PD1+TIM3+, PD1+TIM3, and PD1TIM3 CD8+ T-cell subsets (n = 10 DLBCL). (B) Expression of inhibitory, proliferation, and effector markers among CD8+ T-cell subsets. For each marker, the percentage was normalized and hierarchically clustered using Tmev software. *P ≤ .05, **P < .01, ***P < .001 by Wilcoxon parametric test.
Figure 7.
Figure 7.
In DLBCL, PD1 and TIM3 are involved in T-cell exhaustion. (A) Representative histograms of the proliferation (evaluated by the percentage of CellTracedim cells) of each CD8+ and CD4+ T-cell subset (n = 3 DLBCL). (B) IFN-γ secretion in the supernatant of each T-cell subset was measured by enzyme-linked immunosorbent assay (n = 3 DLBCL). (C) CellTrace violet–labeled mononuclear cells from DLBCL samples (n = 8-12) were activated by plate-coated CD3 and soluble CD28 antibodies. Blocking monoclonal antibodies or control isotype antibodies were added at 10 μg/mL. Representative histograms of the proliferation of CD8+ T cells and CD4+ T cells (left) and percentage of T cells undergoing proliferation (right) in DLBCL in the presence of anti-PD1 or anti-TIM3 antibodies or a combination of both antibodies vs control immunoglobulin G1 (IgG1) antibodies. (D) Event-free survival for the 928 DLBCL patients (GSE117556 cohort). Patients stratified according to PDCD1 and HAVCR2 expression in 4 subgroups after thresholds were defined using the MaxStat package 0.7-25 (https://cran.r-project.org/web/packages/maxstat/index.html). Survival probability was calculated with a log-rank test. *P < .05, **P < .01, ***P < .001 by Wilcoxon parametric test.
Figure 7.
Figure 7.
In DLBCL, PD1 and TIM3 are involved in T-cell exhaustion. (A) Representative histograms of the proliferation (evaluated by the percentage of CellTracedim cells) of each CD8+ and CD4+ T-cell subset (n = 3 DLBCL). (B) IFN-γ secretion in the supernatant of each T-cell subset was measured by enzyme-linked immunosorbent assay (n = 3 DLBCL). (C) CellTrace violet–labeled mononuclear cells from DLBCL samples (n = 8-12) were activated by plate-coated CD3 and soluble CD28 antibodies. Blocking monoclonal antibodies or control isotype antibodies were added at 10 μg/mL. Representative histograms of the proliferation of CD8+ T cells and CD4+ T cells (left) and percentage of T cells undergoing proliferation (right) in DLBCL in the presence of anti-PD1 or anti-TIM3 antibodies or a combination of both antibodies vs control immunoglobulin G1 (IgG1) antibodies. (D) Event-free survival for the 928 DLBCL patients (GSE117556 cohort). Patients stratified according to PDCD1 and HAVCR2 expression in 4 subgroups after thresholds were defined using the MaxStat package 0.7-25 (https://cran.r-project.org/web/packages/maxstat/index.html). Survival probability was calculated with a log-rank test. *P < .05, **P < .01, ***P < .001 by Wilcoxon parametric test.

References

    1. Campo E, Swerdlow SH, Harris NL, Pileri S, Stein H, Jaffe ES. The 2008 WHO classification of lymphoid neoplasms and beyond: evolving concepts and practical applications. Blood. 2011;117(19):5019-5032. - PMC - PubMed
    1. Staiger AM, Ziepert M, Horn H, et al. ; German High-Grade Lymphoma Study Group . Clinical impact of the cell-of-origin classification and the MYC/ BCL2 dual expresser status in diffuse large B-cell lymphoma treated within prospective clinical trials of the German High-Grade Non-Hodgkin’s Lymphoma Study Group. J Clin Oncol. 2017;35(22):2515-2526. - PubMed
    1. Lesokhin AM, Ansell SM, Armand P, et al. . Nivolumab in patients with relapsed or refractory hematologic malignancy: preliminary results of a phase Ib study. J Clin Oncol. 2016;34(23):2698-2704. - PMC - PubMed
    1. Schietinger A, Philip M, Krisnawan VE, et al. . Tumor-specific T cell dysfunction is a dynamic antigen-driven differentiation program initiated early during tumorigenesis. Immunity. 2016;45(2):389-401. - PMC - PubMed
    1. Chen J, López-Moyado IF, Seo H, et al. . NR4A transcription factors limit CAR T cell function in solid tumours. Nature. 2019;567(7749):530-534. - PMC - PubMed

Publication types

MeSH terms

Substances