Nitidine chloride suppresses epithelial-mesenchymal transition and stem cell-like properties in glioblastoma by regulating JAK2/STAT3 signaling
- PMID: 33788424
- PMCID: PMC8085923
- DOI: 10.1002/cam4.3869
Nitidine chloride suppresses epithelial-mesenchymal transition and stem cell-like properties in glioblastoma by regulating JAK2/STAT3 signaling
Abstract
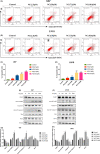
Glioblastoma is the most aggressive and common intracranial malignant tumor, and the prognosis is still poor after various treatments. Based on the poor prognosis of glioma, new drugs that suppress the rapid progression and aggressive growth of glioma are urgently needed. It has been reported that nitidine chloride (NC) can inhibit tumor growth and epithelial-mesenchymal transition (EMT), and EMT is associated with cancer stem cell properties. The present study aimed to investigate the inhibitory effect of NC on the EMT process and stem cell-like properties in glioma cells. The results showed that the migration and invasion abilities in U87 and LN18 glioma cells were significantly increased after the induction of EMT and these effects were inhibited by NC in a concentration-dependent manner. NC treatment decreased the expression of EMT markers in glioma cells and self-renewal capacity of glioma stem-like cells. We demonstrated that these effects of NC were achieved via JAK2/STAT3 signaling. Taken together, these results indicate that NC inhibits the EMT process and glioma stem-like properties via JAK2/STAT3 signaling pathway, suggesting that NC may be a potential anti-glioma drug.
Keywords: JAK2/STAT3; apoptosis; epithelial-mesenchymal transition; glioblastoma; gliosphere; nitidine chloride.
© 2021 The Authors. Cancer Medicine published by John Wiley & Sons Ltd.
Conflict of interest statement
The authors report no conflicts of interest.
Figures


Similar articles
-
Nitidine Chloride Is a Potential Alternative Therapy for Glioma Through Inducing Endoplasmic Reticulum Stress and Alleviating Epithelial-Mesenchymal Transition.Integr Cancer Ther. 2020 Jan-Dec;19:1534735419900927. doi: 10.1177/1534735419900927. Integr Cancer Ther. 2020. PMID: 32129091 Free PMC article.
-
ZnAs@SiO2 nanoparticles as a potential anti-tumor drug for targeting stemness and epithelial-mesenchymal transition in hepatocellular carcinoma via SHP-1/JAK2/STAT3 signaling.Theranostics. 2019 Jun 9;9(15):4391-4408. doi: 10.7150/thno.32462. eCollection 2019. Theranostics. 2019. PMID: 31285768 Free PMC article.
-
pDok2, caspase 3 dependent glioma cell growth arrest by nitidine chloride.Pharmacol Rep. 2018 Feb;70(1):48-54. doi: 10.1016/j.pharep.2017.07.013. Epub 2017 Jul 29. Pharmacol Rep. 2018. PMID: 29329030
-
A New Investigational Perspective for Purines Against Glioblastoma Invasiveness.Curr Drug Targets. 2018;19(16):1871-1881. doi: 10.2174/1389450119666180226123819. Curr Drug Targets. 2018. PMID: 29484991 Review.
-
STAT3 as a Therapeutic Target for Glioblastoma.Anticancer Agents Med Chem. 2010 Sep;10(7):512-9. doi: 10.2174/187152010793498636. Anticancer Agents Med Chem. 2010. PMID: 20879983 Review.
Cited by
-
Overcoming therapeutic resistance to platinum-based drugs by targeting Epithelial-Mesenchymal transition.Front Oncol. 2022 Oct 14;12:1008027. doi: 10.3389/fonc.2022.1008027. eCollection 2022. Front Oncol. 2022. PMID: 36313710 Free PMC article. Review.
-
6-Methoxydihydroavicine is a benzophenanthridine alkaloid with anti-leukemia activity.Front Pharmacol. 2025 Jun 24;16:1621050. doi: 10.3389/fphar.2025.1621050. eCollection 2025. Front Pharmacol. 2025. PMID: 40630130 Free PMC article.
-
High Expression of CISD2 in Relation to Adverse Outcome and Abnormal Immune Cell Infiltration in Glioma.Dis Markers. 2022 Apr 21;2022:8133505. doi: 10.1155/2022/8133505. eCollection 2022. Dis Markers. 2022. PMID: 35493303 Free PMC article.
-
LIF Inhibits Proliferation of Esophageal Squamous Carcinoma Cells by Radiation Mediated Through JAK-STAT Signaling Pathway.J Cancer. 2023 Feb 22;14(4):532-543. doi: 10.7150/jca.81222. eCollection 2023. J Cancer. 2023. PMID: 37057285 Free PMC article.
-
Anticancer Potential of Myricetin against Huh7- and Hep3B-Derived Liver Cancer Stem Cells through the Regulation of Apoptosis, Autophagy, and Stemness.Biomol Ther (Seoul). 2025 Jul 1;33(4):636-651. doi: 10.4062/biomolther.2025.044. Epub 2025 Jun 23. Biomol Ther (Seoul). 2025. PMID: 40545984 Free PMC article.
References
-
- Nieto MA, Huang RY, Jackson RA, Thiery JP. EMT: 2016. Cell. 2016;166(1):21‐45. - PubMed
-
- Brabletz T. To differentiate or not–routes towards metastasis. Nat Rev Cancer. 2012;12(6):425‐436. - PubMed
-
- De Craene B, Berx G. Regulatory networks defining EMT during cancer initiation and progression. Nat Rev Cancer. 2013;13(2):97‐110. - PubMed
-
- Wang X, Dai X, Zhang X, et al. 3D bioprinted glioma cell laden scaffolds enriching glioma stem cells via epithelial–mesenchymal transition. J Biomed Mater Res A. 2019;107(2):383‐391. - PubMed
Publication types
MeSH terms
Substances
LinkOut - more resources
Full Text Sources
Other Literature Sources
Medical
Miscellaneous

