Review
. 2021;53(1):55-68.
doi: 10.5114/ait.2021.104892.

Comprehensive assessment of the aortic valve in critically ill patients for the non-cardiologist. Part II: Chronic aortic regurgitation of the native valve

Affiliations
Review

Comprehensive assessment of the aortic valve in critically ill patients for the non-cardiologist. Part II: Chronic aortic regurgitation of the native valve

Jeroen Walpot et al. Anaesthesiol Intensive Ther. 2021.

Abstract

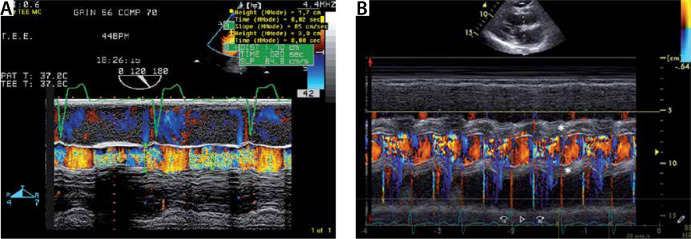
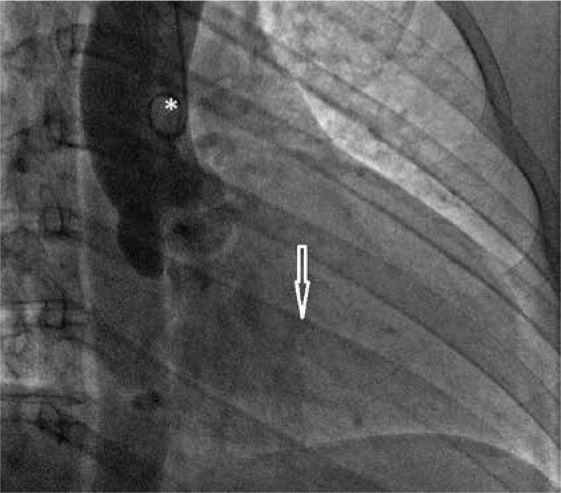
Inadequate diastolic closure of the aortic valve causes aortic regurgitation (AR). Diastolic regurgitation towards the left ventricle (LV) causes LV volume overload, resulting in eccentric LV remodelling. Transthoracic echocardiography (TTE) is the first line examination in the work-up of AR. TTE allows quantification of left ventricular end-diastolic diameter and volume and left ventricular ejection fraction, which are key elements in the clinical decision making regarding the timing of valve surgery. The qualitative echocardiographic features contributing to the AR severity grading are discussed: fluttering of the anterior mitral valve leaflet, density and shape of the continuous wave Doppler signal of the AR jet, colour flow imaging of the AR jet width, and holodiastolic flow reversal in the descending thoracic aorta and abdominal aorta. Volumetric assessment of the AR is performed by measuring the velocity time integral of the left ventricular outflow tract (LVOT) and transmitral valve (MV) plane, and diameters of LVOT and MV. We explain how the regurgitant fraction and effective regurgitant orifice area (EROA) can be calculated. Alternatively, the proximal isovelocity surface area can be used to determine the EROA. We overview the utility of pressure half time and vena contracta width to assess AR severity. Further, we discuss the role of transoesophageal echocardiography, echocardiography speckle tracking strain imaging, cardiac magnetic resonance imaging and computed tomography of the thoracic aorta in the work-up of AR. Finally, we overview the criteria for valve surgery in AR.

Keywords: cardiac magnetic resonance (CMR).; effective regurgitant orifice area (EROA); holodiastolic flow reversal; multidetector computed tomography (MDCT); pressure half time (PHT); regurgitant fraction (RF); transoesophageal echocardiography; transthoracic echocardiography; vena contracta width (VC-W); aortic regurgitation.


Conflict of interest statement

MLNGM is a member of the Executive Committee of the Abdominal Compartment Society, formerly known as the World Society of Abdominal Compartment Syndrome (https://www.wsacs.org/). He is the inaugural President, a co-founder of the WSACS and the current Treasurer. He is a co-founder and the President of the International Fluid Academy (IFA). The IFA is integrated within the not-for-profit charitable organization iMERiT, International Medical Education and Research Initiative, under Belgian law. The content of the IFA website (http://www.fluidacademy.org) is based on the philosophy of FOAM (Free Open Access Medical education – #FOAMed). He is a member of the medical advisory Board of Pulsion Medical Systems (now fully integrated in Getinge, Solna, Sweden) and Serenno Medical (Tel Aviv, Israel), and consults for Baxter, Maltron, ConvaTec, Acelity, Spiegelberg and Holtech Medical.

The other authors have no potential conflicts of interest with regard to the contents of this review paper.

Figures

FIGURE 1
FIGURE 1
Pathophysiology of aortic regurgitation (AR). Description of the pathophysiology of AR. Increased left ventricle (LV) volume, increased stroke volume and reduced diastolic aortic pressure are the main pathophysiological features of AR (green), resulting in LV adaption to AR (orange). As the LV adaption cannot balance the AR overload any more, symptoms occur (red). CPP – coronary perfusion pressure, DP – diastolic blood pressure, LVEDP – left ventricular end-diastolic pressure
FIGURE 2
FIGURE 2
M-mode imaging of the left ventricle (LV) from the parasternal long axis view. M-mode long axis view section of the LV in a patient with severe aortic regurgitation. Note the dilated LV with left ventricular end-diastolic diameter of 72 mm. Note the diastolic fluttering of the anterior mitral valve leaflet, due to impingement by the aortic regurgitant jet (white arrow)
FIGURE 3
FIGURE 3
M-mode imaging of the aortic root. Measurement of the aortic root by M-mode Doppler in the parasternal long axis view. In this patient, the aortic root was dilated (4.5 cm)
FIGURE 4
FIGURE 4
a) Colour M-mode through the left ventricular outflow tract (LVOT) in severe aortic regurgitation (AR). Colour M-mode of the LVOT. Note the diastolic regurgitation (mosaic colour due to turbulent flow). The AR jet width exceeds 50% of the LVOT diameter. B) Colour M-mode through the LVOT in a patient with severe AR due to infective endocarditis. Colour M-mode of the LVOT with the diastolic regurgitation (mosaic colour due to turbulent flow, like A. Note the thickening of the paravalvular area due to infestation of infection endocarditis (*)
FIGURE 5
FIGURE 5
Continuous wave (CW) signal of the aortic regurgitation. CW Doppler aortic regurgitant signal of a mild (a), moderate (B) and severe aortic regurgitation (AR) (C). a – Note the faint regurgitant signal in mild AR, due the lower flow of regurgitant red blood cells to be detected by the crystals in the echo probe. B – The density of the CW AR signal allows clear delineation of the entire regurgitant envelope. However, the forward flow has higher signal density. C – The CW AR signal has the same intensity as the forward blood flow. Also note the increasing deceleration shape of the CW AR jet, with increasing AR severity (see text, see also Figure 6)
FIGURE 6
FIGURE 6
Continuous wave (CW) signal of the aortic regurgitation in patients with severe aortic regurgitation (AR). CW aortic regurgitant flow of a severe AR. a – Shows severe chronic AR. The pressure half time (PHT) is 112 ms. Panel B shows a typical example of an AR CW regurgitant signal of severe acute AR. PHT = 97 ms. Note that the slope drops to 0 m/s. This means that the left ventricular diastolic blood pressure equals the aortic diastolic blood pressure
FIGURE 7
FIGURE 7
The principle of preservation of flow in the setting of aortic regurgitation. The principle of preservation of flow says that all blood that enters the left ventricle (LV) at diastole, must leave the LV at systole. Green = left ventricular outflow tract (LVOT) flow. Thus, Aortic Reg V = LVOT flow – MV flow
FIGURE 8
FIGURE 8
Volumetric assessment of aortic regurgitation (AR) by pulsed wave (PW) echo Doppler. Example of volumetric AR quantification. a – Shows measurement of the left ventricular outflow tract (LVOT) diameter. B – Measurement of mitral valve annular diameter. C – By contouring the LVOT PW signal (PW: pulsed wave echo Doppler), the LVOT velocity time integral (VTI) can be measured. d – By contouring the transmitral PW signal, the transmitral (MV) VTI can be measured. e – The massive AR jet on colour Doppler echo
FIGURE 9
FIGURE 9
Principle of proximal isovelocity surface area (PISA) to calculate effective regurgitant volume (ERO). a – Typical example of PISA measurement in mitral regurgitation. The white arrow shows that the Nyquist limit was decreased to 30 cm s-1. At a velocity of 30 cm s-1, the colour coding changes from blue to yellow. The PISA has a surface velocity of 30 cm s-1. The radius (r) was measured (0.8 cm). B – Measurement of the peak mitral regurgitation velocity. C – The principle of the measurement. The flow proximal to the ERO (red) equals the flow after the ERO (green). If the PISA radius, the Nyquist velocity and the peak regurgitant velocity are measured, the ERO can be calculated. The same principle can be applied on aortic regurgitation. In this case, PISA radius = 0.81 cm, alias velocity (Nyquist) = 29.7 cm s-1 and the mitral peak velocity (CW) = 509 cm s-1. ERO = (6.28 × 0.812 × 29.7)/509 = 0.24 cm2
FIGURE 10
FIGURE 10
Colour flow mapping in aortic regurgitation (AR). Example of diastolic colour flow mapping in a patient with severe AR. Remark the regurgitation jet reaching the apex. LV – left ventricle, RV – right ventricle, LA – left atrium, RA – right atrium, MV – mitral valve, AV – aortic valve, AV – aortic valve, V – vegetation
FIGURE 11
FIGURE 11
Vena contracta width (VC-W) transoesophageal echocardiography image. The width of the vena contracta (VC-W) is the smallest area in the regurgitant flow, between the proximal laminar flow acceleration zone and the distal turbulent regurgitant jet spray
FIGURE 12
FIGURE 12
Holodiastolic flow reversal in the descending thoracic aorta and abdominal aorta. a – Suprasternal view of the aortic arch. Note the regurgitant flow in the descending aorta (right side of the image). By echo Doppler convention, colour flow mapping (CFM) codes blood travelling towards the echo probe in red colour. B – Holodiastolic flow reversal (R) in the descending aorta is a sign of severe aortic regurgitation. C – Holodiastolic flow reversal in the abdominal aorta. This is an even stronger sign of severe aortic regurgitation than holodiastolic flow reversal (R) in the descending aorta. A – antegrade flow
FIGURE 13
FIGURE 13
A – Transoesophageal echocardiography (TEE) 135° view demonstrating aortic regurgitation due infective endocarditis. TEE 135° view. Note the 2 vegetations. One vegetation is oscillating in the LVOT (dark V) and the other vegetation (white V) is attached to the wall that is shared by the aortic valve (AV) and mitral valve (MV). There is paravalvular thickening around the AV (phlegmon) (#) with an abscess in the centre (white arrow). B – Colour imaging with aortic regurgitation. Note the small paravalvular flow (black arrow) from the abscess to the left ventricle, which implies the formation of a fistula. LV – left ventricle, RV – right ventricle, LA – left atrium, MV – mitral valve, AV – aortic valve, MV – mitral valve, V – vegetation
FIGURE 14
FIGURE 14
A – Transoesophageal echocardiography (TEE) 38° view (short axis view), demonstrating severe aortic regurgitation due to infective endocarditis. TEE 38° view (short axis view). Note the vegetation (V) and paravalvular thickening around the AV (phlegmon) with an abscess in the centre (arrow). B – Colour imaging with aortic regurgitation. LV – left ventricle, RV – right ventricle, LA – left atrium, AV – aortic valve, RA – right atrium, V – vegetation, TV – tricuspid valve
FIGURE 15
FIGURE 15
Transoesophageal echocardiography (TEE) image showing involvement of mitral valve (MV) in the infective endocarditis process of a patient with severe aortic regurgitation due to infective endocarditis. a and B – Same patient as in Figures 13 and 14. The mitral valve is also involved in the infective endocarditis process. Note the large vegetations (V). This image illustrates the relevance of completeness of TEE examination. LV – left ventricle, RV – right ventricle, LA – left atrium, RA – right atrium, V – vegetation, MV – mitral valve
FIGURE 16
FIGURE 16
Assessment of aortic regurgitation by invasive aortography. After dye injection via the pigtail catheter (*), positioned in the ascending aorta, the aorta root and ascending aorta opacify. Dye in the left ventricular cavity (arrow) confirms the presence of aortic regurgitation (see text for explanation)

Similar articles

Cited by

References

    1. Singh JP, Evans JC, Levy D, et al. . Prevalence and clinical determinants of mitral, tricuspid, and aortic regurgitation (the Framingham Heart Study). Am J Cardiol 1999; 83: 897-902. doi:10.1016/S0002-9149(98)01064-9. - DOI - PubMed
    1. Akinseye OA, Pathak A, Ibebuogu UN. Aortic valve regurgitation: a comprehensive review. Curr Probl Cardiol 2018; 43: 315-334. doi:10.1016/j.cpcardiol.2017.10.004. - DOI - PubMed
    1. Otto CM. Textbook of Clinical Echocardiography. W.B. Saunders Company; 2000: 229-269.
    1. Walpot J, Vermeiren GLJ, Al Mafragi A, Malbrain MLNG. Comprehensive assessment of the aortic valve in critically ill patients for the non-cardiologist. Part I: Aortic stenosis of the native valve. Anaesthesiol Intensive Ther 2021; 53: 37-54. doi: 10.5114/ait.2021.104550. - DOI - PMC - PubMed
    1. Yilmaz AT, Ozal E, Arslan M, Tatar H, Oztürk OY. Aneurysm of the membranous septum in adult patients with perimembranous ventricular septal defect. Eur J Cardiothorac Surg 1997; 11: 307-311. doi: 10.1016/s1010-7940(96)01058-5. - DOI - PubMed