

Cega: a single particle segmentation algorithm to identify moving particles in a noisy system
- PMID: 33788586
- PMCID: PMC8108521
- DOI: 10.1091/mbc.E20-11-0744
Cega: a single particle segmentation algorithm to identify moving particles in a noisy system
Abstract
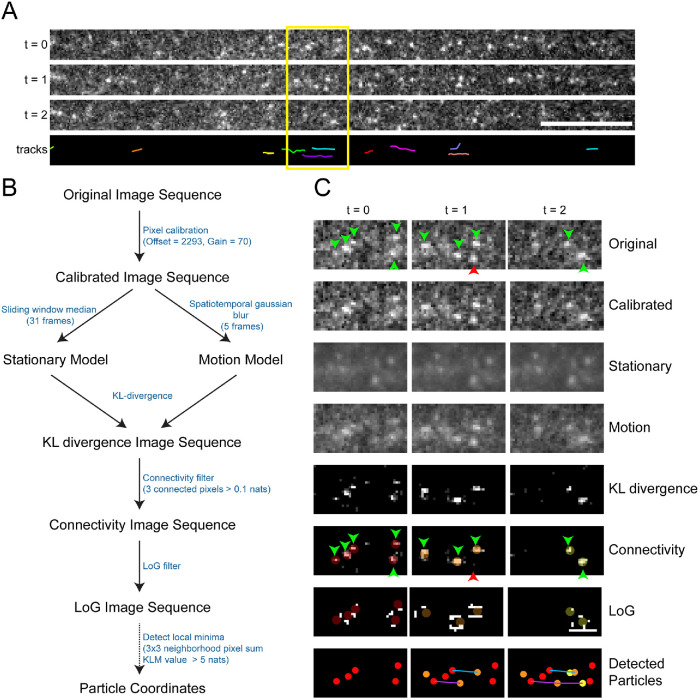
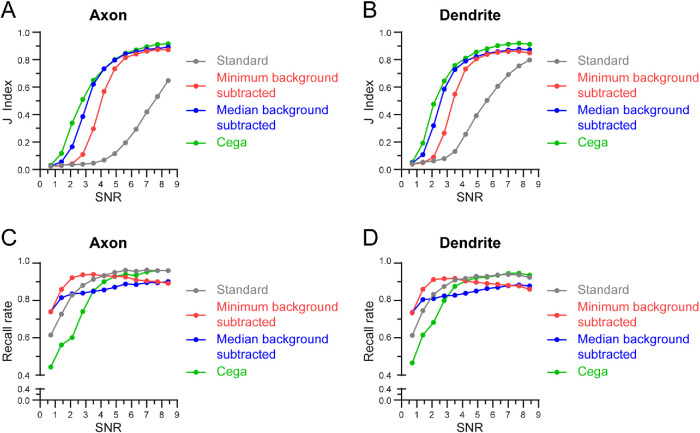
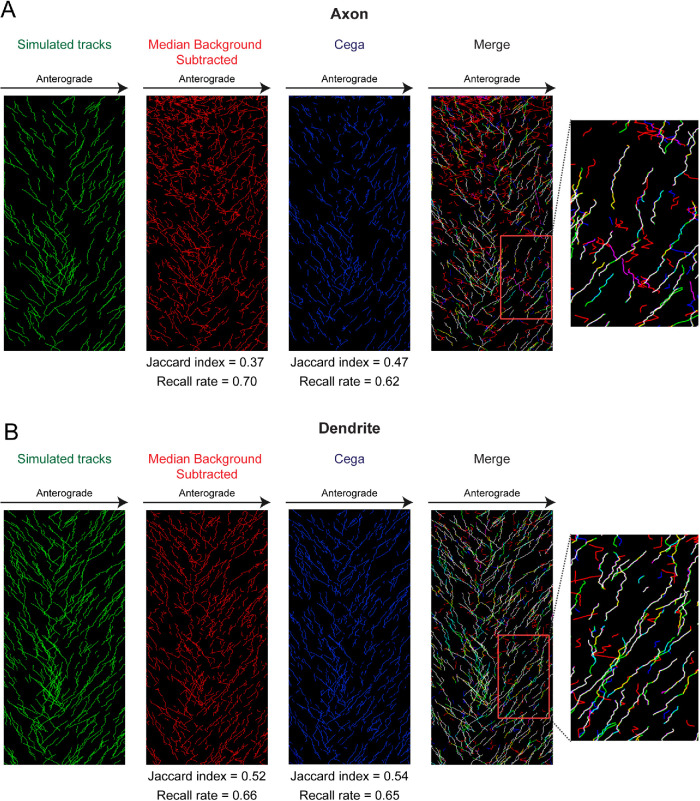
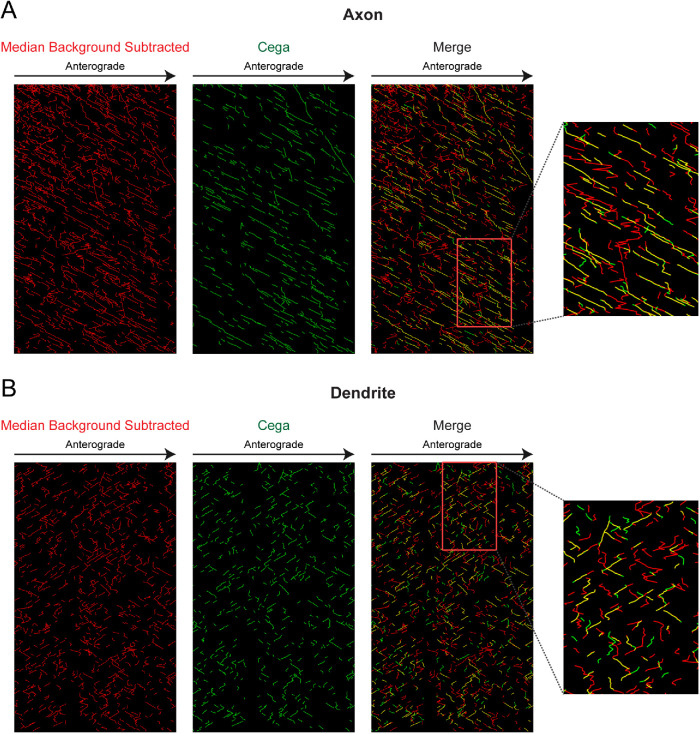
Improvements to particle tracking algorithms are required to effectively analyze the motility of biological molecules in complex or noisy systems. A typical single particle tracking (SPT) algorithm detects particle coordinates for trajectory assembly. However, particle detection filters fail for data sets with low signal-to-noise levels. When tracking molecular motors in complex systems, standard techniques often fail to separate the fluorescent signatures of moving particles from background signal. We developed an approach to analyze the motility of kinesin motor proteins moving along the microtubule cytoskeleton of extracted neurons using the Kullback-Leibler divergence to identify regions where there are significant differences between models of moving particles and background signal. We tested our software on both simulated and experimental data and found a noticeable improvement in SPT capability and a higher identification rate of motors as compared with current methods. This algorithm, called Cega, for "find the object," produces data amenable to conventional blob detection techniques that can then be used to obtain coordinates for downstream SPT processing. We anticipate that this algorithm will be useful for those interested in tracking moving particles in complex in vitro or in vivo environments.
Figures
Similar articles
-
Development of fan-shaped tracker for single particle tracking.Microsc Res Tech. 2020 Sep;83(9):1056-1065. doi: 10.1002/jemt.23496. Epub 2020 Apr 23. Microsc Res Tech. 2020. PMID: 32324946
-
A comparison of single particle tracking and temporal image correlation spectroscopy for quantitative analysis of endosome motility.J Microsc. 2013 Nov;252(2):169-88. doi: 10.1111/jmi.12080. Epub 2013 Sep 19. J Microsc. 2013. PMID: 24102535
-
Simultaneous recovery of both bright and dim structures from noisy fluorescence microscopy images using a modified TV constraint.J Microsc. 2019 Jul;275(1):24-35. doi: 10.1111/jmi.12799. Epub 2019 May 7. J Microsc. 2019. PMID: 31026068
-
Diatrack particle tracking software: Review of applications and performance evaluation.Traffic. 2017 Dec;18(12):840-852. doi: 10.1111/tra.12530. Epub 2017 Oct 23. Traffic. 2017. PMID: 28945316 Free PMC article. Review.
-
Tracking Single Molecules in Biomembranes: Is Seeing Always Believing?ACS Nano. 2019 Oct 22;13(10):10860-10868. doi: 10.1021/acsnano.9b07445. Epub 2019 Oct 7. ACS Nano. 2019. PMID: 31589406 Free PMC article. Review.
Cited by
-
Quantitative Single-Molecule Localization Microscopy.Annu Rev Biophys. 2023 May 9;52:139-160. doi: 10.1146/annurev-biophys-111622-091212. Annu Rev Biophys. 2023. PMID: 37159293 Free PMC article. Review.
-
Organization and dynamics of the cortical complexes controlling insulin secretion in β-cells.J Cell Sci. 2022 Feb 1;135(3):jcs259430. doi: 10.1242/jcs.259430. Epub 2022 Feb 3. J Cell Sci. 2022. PMID: 35006275 Free PMC article.
-
Microtubule dynamics influence the retrograde biased motility of kinesin-4 motor teams in neuronal dendrites.Mol Biol Cell. 2022 May 15;33(6):ar52. doi: 10.1091/mbc.E21-10-0480. Epub 2021 Oct 27. Mol Biol Cell. 2022. PMID: 34705476 Free PMC article.
References
-
- Brownrigg D (1984). The weighted median filter. CACM. https//.org/10.1145/358198.358222
-
- Chenouard N, Dufour A, Olivo-Marin J-C (2009). Tracking algorithms chase down pathogens. Biotechnol J 4, 838–845. - PubMed
-
- Heintzmann R, Relich PK, Nieuwenhuizen RPJ, Lidke KA, Rieger B (2018). Calibrating photon counts from a single image. ArXiv Preprint http://arxiv.org/abs/1611.05654.
Publication types
MeSH terms
Substances
Grants and funding
LinkOut - more resources
Full Text Sources
Other Literature Sources
