. 2021 Mar 31;19(3):e3001176.
doi: 10.1371/journal.pbio.3001176. eCollection 2021 Mar.

Loss of the abasic site sensor HMCES is synthetic lethal with the activity of the APOBEC3A cytosine deaminase in cancer cells

Affiliations

Loss of the abasic site sensor HMCES is synthetic lethal with the activity of the APOBEC3A cytosine deaminase in cancer cells

Josep Biayna et al. PLoS Biol. .

Abstract

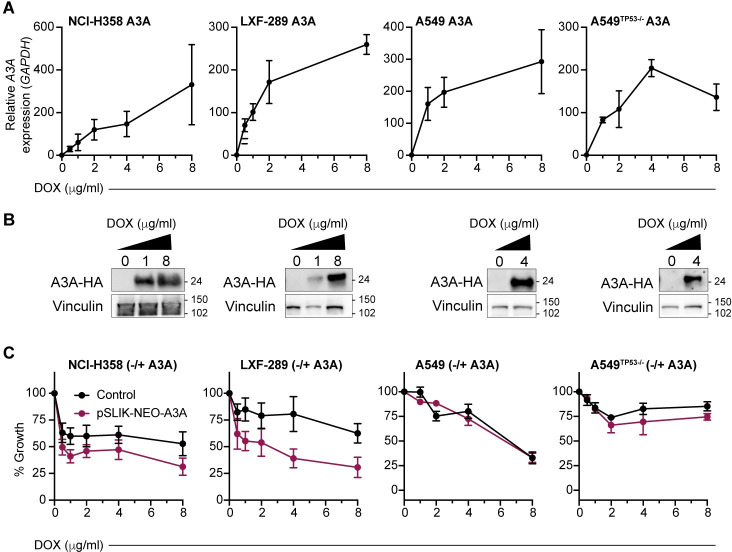
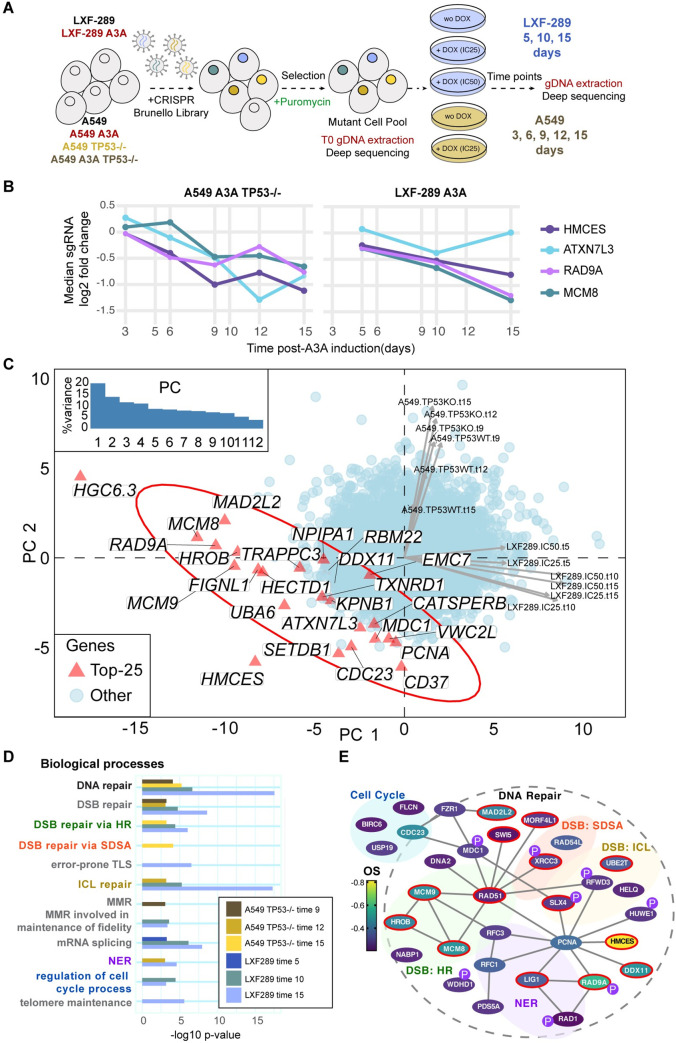
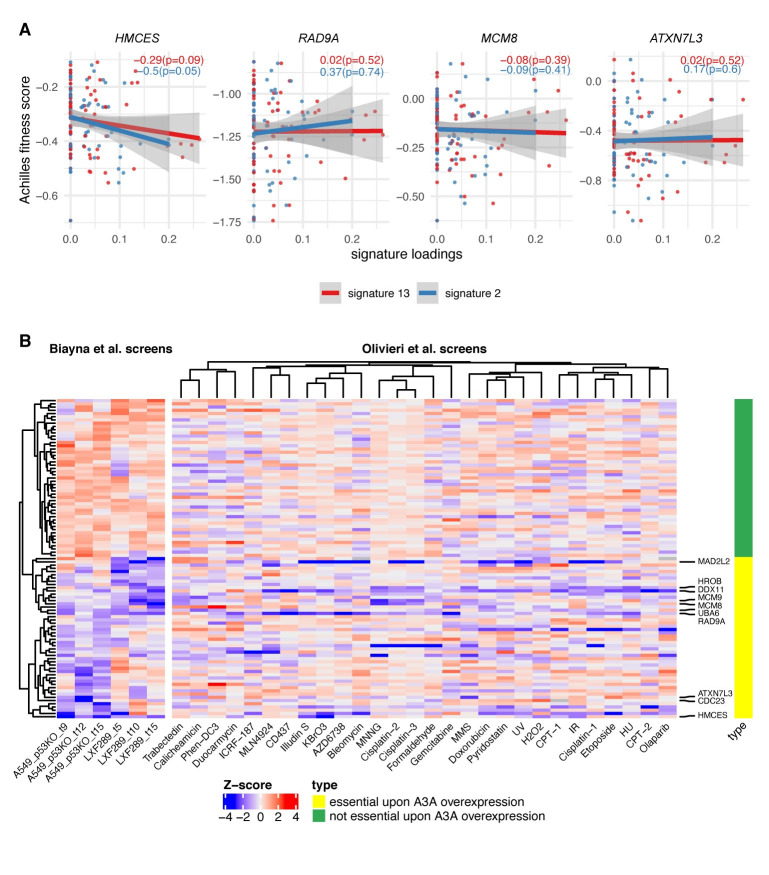
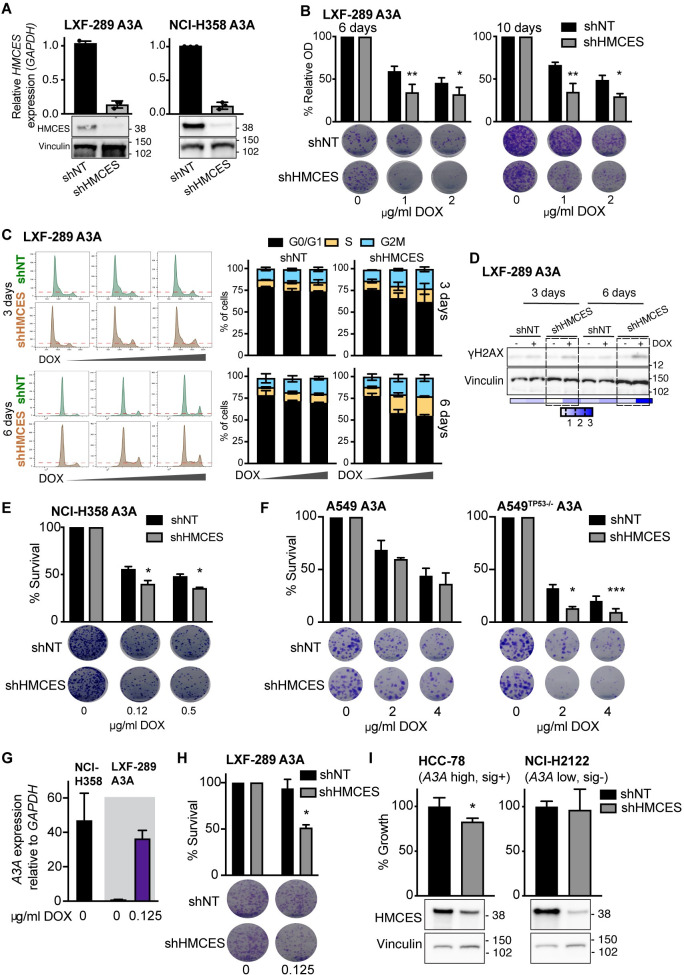
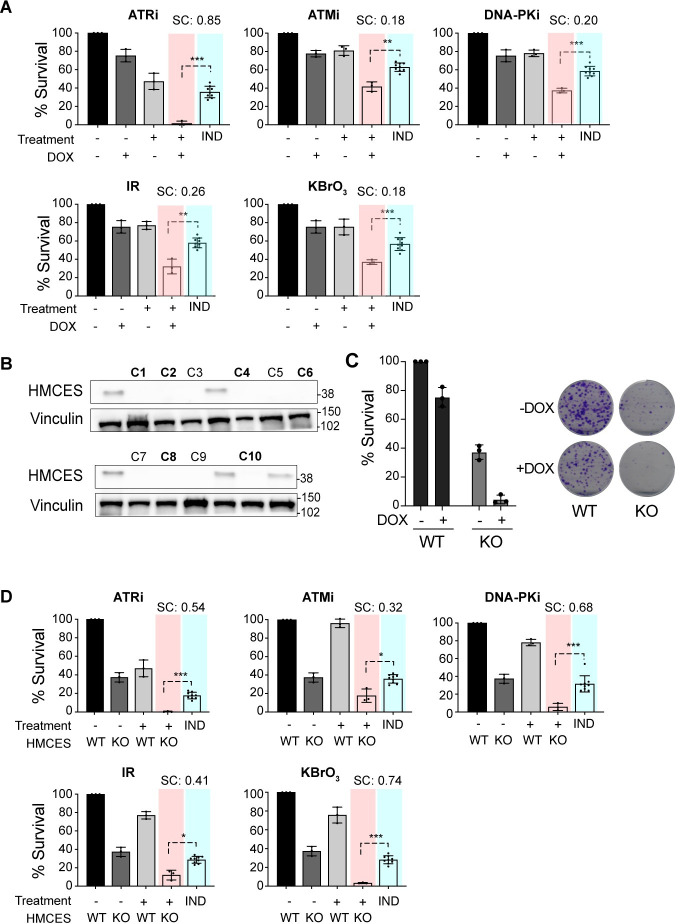
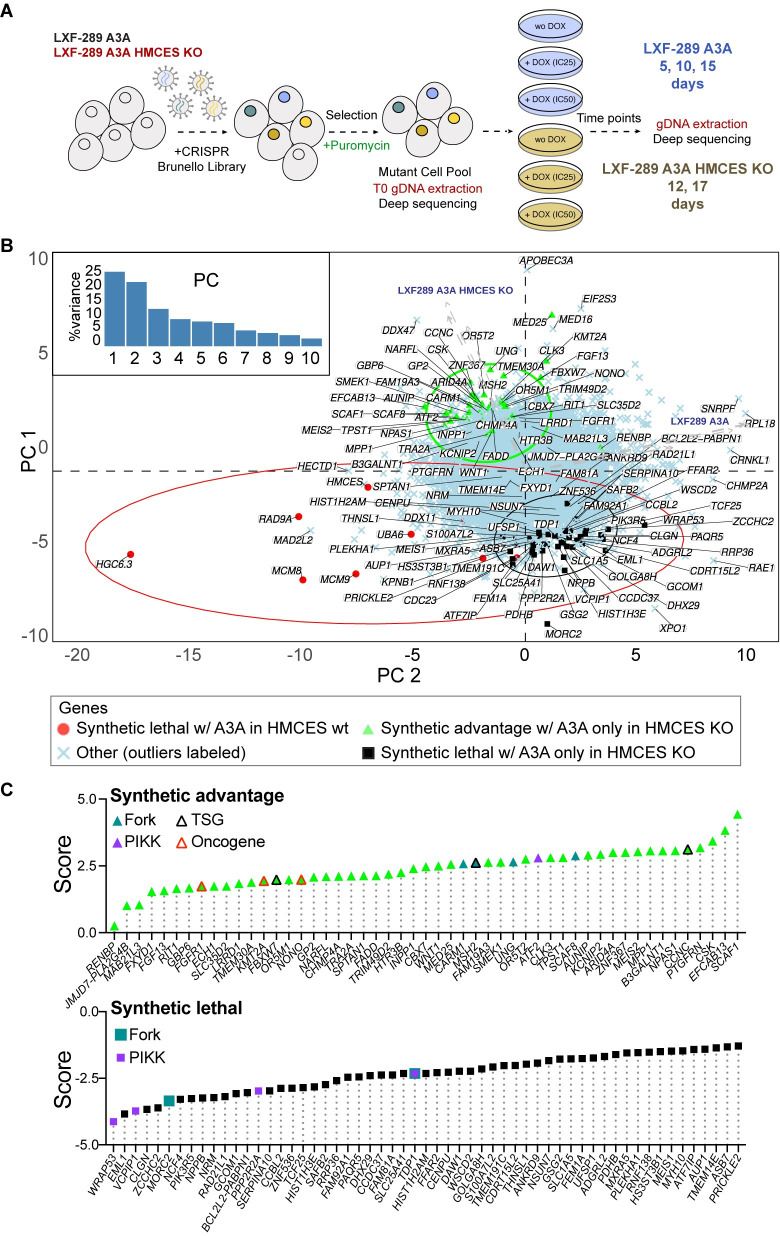
Analysis of cancer mutagenic signatures provides information about the origin of mutations and can inform the use of clinical therapies, including immunotherapy. In particular, APOBEC3A (A3A) has emerged as a major driver of mutagenesis in cancer cells, and its expression results in DNA damage and susceptibility to treatment with inhibitors of the ATR and CHK1 checkpoint kinases. Here, we report the implementation of CRISPR/Cas-9 genetic screening to identify susceptibilities of multiple A3A-expressing lung adenocarcinoma (LUAD) cell lines. We identify HMCES, a protein recently linked to the protection of abasic sites, as a central protein for the tolerance of A3A expression. HMCES depletion results in synthetic lethality with A3A expression preferentially in a TP53-mutant background. Analysis of previous screening data reveals a strong association between A3A mutational signatures and sensitivity to HMCES loss and indicates that HMCES is specialized in protecting against a narrow spectrum of DNA damaging agents in addition to A3A. We experimentally show that both HMCES disruption and A3A expression increase susceptibility of cancer cells to ionizing radiation (IR), oxidative stress, and ATR inhibition, strategies that are often applied in tumor therapies. Overall, our results suggest that HMCES is an attractive target for selective treatment of A3A-expressing tumors.


Conflict of interest statement

The authors have declared that no competing interests exist.

Figures

Fig 1
Fig 1. Inducible A3A expression reduces the fitness of LUAD cell lines.
(A) A3A mRNA levels in NCI-H358, LXF-289, A549, and A549TP53−/− cell lines transduced with a DOX-inducible A3A cassette at various concentrations of DOX. qRT-PCR and western blot analysis were repeated 2 times. (B) Western blot detection of HA-A3A upon DOX induction. LXF-289, NCI-H358, A549, and A549TP53−/− cells were collected and lysed 72 h posttreatment. Vinculin serves as a loading control, and molecular mass is indicated in kilodaltons. (C) Growth (percentage of growth rate relative to the cells without DOX) for the indicated cell lines after 72 h of DOX treatment measured with AlamarBlue. In red, cells transduced with the inducible A3A cassette, and in black, the parental cell line (no A3A) exposed to the same concentration of DOX. Growth assays were repeated 2 (A549TP53−/−) or 3 times (all other lines). For all graphs, mean and SEM are shown. Uncropped western blots are provided in S1 Raw Images, and numerical data underlying plots are provided in S1 Data. A3A, APOBEC3A; DOX, doxycycline; HA, haemagglutinin; LUAD, lung adenocarcinoma; qRT-PCR, quantitative real-time PCR.
Fig 2
Fig 2. CRISPR/Cas-9 genetic screen indicates HMCES and other DNA repair genes as vulnerabilities of A3A-expressing cells.
(A) Experimental design using the Brunello genome-wide library [50]. (B) Depletion of the sgRNAs targeting top 4 genes upon A3A overexpression, as prioritized by the overall A3A conditional essentiality score: LFC across 3 time points of the LXF-289 cell line and the 3 latest time points of the A549TP53−/− cell line. The y-axis shows the median of the 4 sgRNAs per gene. (C) PC analysis of A3A conditional LFC scores for all genes across all 12 experimental conditions (see labels next to arrows, which show loadings of the conditions on PC1 and PC2; “KO” implies TP53−/− and “WT” TP53 wild-type A549 cell line; numbers in labels are the time points; “IC25” and “IC50” are 2 concentrations of DOX in the LXF-289 cell line). The top 25 genes, prioritized by the same A3A conditional score as in panel B, are highlighted on the figure. Inlay shows a scree plot, with the amount of variance explained by the 12 PCs. The LXF-289-specific HGC6.3 hit is likely an artefact (S1 Table; see Results text). LFC for all genes/sgRNAs are included in S2 Table and S2 Data. LFC for sgRNAs (from the top 100 genes plus nontargeting), shown in S2A–S2C Fig, are included in S3 Data. (D) Gene Ontology enrichment analysis of the top hits in the 6 experiments considered for the overall A3A conditional score (as in panel B). Plot shows −log10 p-value (unadjusted) from the GORILLA server. Underlying data and full Gene Ontology analysis and category names are provided in S3 Table. (E) Network schematic of cell cycle and DNA repair–related genes from the top 300 hits in the screen (OS). Genes identified in the Gene Ontology analysis and appearing in the top 300 genes by OS are shown. Color denotes the OS, lines indicate physical interactions (thebiogrid.org) [52], and a red border indicates they were identified in the Gene Ontology analysis in both cell lines. Those gene products identified as PIKK (ATM, ATR, and DNA-PKcs) targets are indicated with a purple “P,” data from PhosphoSitePlus [53]. Numerical data for all graphs in the figure are provided in S3 Table and S2 Data. A3A, APOBEC3A; DSB, double-strand break; HR, homologous recombination; ICL, interstrand crosslink; LFC, log2 fold change; MMR, mismatch repair; NER, nucleotide excision repair; OS, overall score; PC, principal component; PIKK, PI-3 kinase-like kinase; SDSA, synthesis-dependent strand annealing; sgRNA, single gRNA; TLS, translesion synthesis.
Fig 3
Fig 3. Dependency on HMCES is associated with mutational signatures of APOBEC across 76 lung and head and neck cancer cell lines.
(A) Gene essentiality fitness score from Project Achilles vs. APOBEC mutational signatures exposures, for cell lines from head and neck squamous cell carcinoma, LUAD, and lung squamous cell carcinoma, in four of the genes with the greatest overall score in our screens; see S5 Table and S7 Fig for associations with additional prominent genes. The slope and p-value (1-tailed, lower) for the regression model for both A3 signatures are shown within each panel. The more negative the slope, the more sensitive the cell lines are to the depletion of the gene at a higher level of the APOBEC signature. (B) Heatmap shows a gene-level normalized LFC (gene essentiality score) upon A3A overexpression for 2 cell lines and for 3 time points (Biayna et al. screens); right panel shows Z-scores of gene essentiality after genotoxin exposure (Olivieri et al. screens[60]). Data for 50 genes that are essential upon A3A overexpression in our screens (i.e., genes with the most negative mean LFC across 6 data points) and 50 nonessential genes upon A3A overexpression in our screens. Labels on the right-hand side highlight the 10 genes showing the highest overall A3A essentiality. An extended heatmap showing all genes from certain DNA repair pathways is included in S7 Fig, and numerical data for graphs in this figure are provided in S3 Data. A3A, APOBEC3A; LFC, log2 fold change; LUAD, lung adenocarcinoma.
Fig 4
Fig 4. Validation of the effects of HMCES depletion in multiple genetic backgrounds.
(A) HMCES levels in LXF-289 A3A and NCI-H358 A3A cell lines by qRT-PCR and western blot following transduction with shHMCES or a shNT. The qRT-PCR validation was repeated at least 3 times. Molecular mass is indicated in kilodaltons. (B) Reduction of HMCES sensitizes LXF-289 A3A cells to A3A expression in a growth assay for 6 and 10 days (repeated 3 times). (C) Representative histograms of cell cycle progression (left panels) and quantitative analysis of LXF-289 A3A shHMCES and shNT (right panels). Cells were treated with DOX (0, 1, or 2 ug/ml) and harvested after 3 and 6 days (repeated 2 times). (D) Western blot of H2AX-S139 phosphorylation (γH2AX) in LXF-289 shHMCES and shNT cells after 3–6 days of A3A expression. Relative phosphorylation (0–3) was calculated normalizing the band densities of γH2AX to total Vinculin signal. Molecular mass is indicated in kilodaltons. (E) Reduction of HMCES sensitizes NCI-H358 A3A cells to A3A expression in a clonogenic survival assay after 15 days (repeated 2 times). (F) The effect of HMCES depletion is TP53 dependent. Clonogenic survival assays of A549 A3A or A549TP53−/− A3A cells are shown 10 days after treatment with the indicated dose of DOX (repeated 3 times). (G) A3A mRNA expression levels in LXF-289 A3A (0 and 0.125 ug/ml of DOX) and the parental NCI-H358 cell line relative to GAPDH measured by qRT-PCR (repeated 3 times). (H) Depletion of HMCES sensitizes LXF-289 A3A cells to A3A expression following low levels of DOX treatment in a clonogenic survival assay (repeated 3 times). (I) Growth inhibition (percentage of growth rate) measured with AlamarBlue for HCC-78 (A3A expressing, A3 mutational signature positive) and NCI-H2122 (A3A low, A3 mutational signature negative) cell lines transduced with shNT or shHMCES (repeated 3 times). HMCES levels are shown, and Vinculin is used as a loading control (bottom panels). Statistical analysis of shHMCES vs. shNT in all panels was performed using a 1-tailed unpaired t test; mean and SD are shown for all graphs. *, p ≤ 0.05, **, p ≤ 0.01, ***, p ≤ 0.001. Uncropped western blots are provided in S1 Raw Images, and numerical data for all graphs are provided in S4 Data. A3A, APOBEC3A; DOX, doxycycline; qRT-PCR, quantitative real-time PCR; SD, standard deviation; shNT, nontargeting shRNA.
Fig 5
Fig 5. A3A expression sensitizes to DNA damage and HMCES loss.
(A) Clonogenic survival measured by the colony formation assay in LXF-289 A3A cells after exposure to the indicated small molecule inhibitor, IR (5 Gy), or treatment with 0.1 mM KBrO3 with or without DOX (0.125 ug/ml) to induce A3A expression. (B) HMCES western blot of lysates from LXF-289 A3A HMCES WT and KO clones. Vinculin was used as a protein loading control, and molecular mass is indicated in kilodaltons. (C) Clonogenic survival assay of LXF-289 A3A HMCES WT and KO cells upon overexpression of A3A by DOX. (D) Clonogenic survival assay comparing HMCES WT and KO cells after treatment with the indicated small molecule inhibitor, exposure to IR (5 Gy), or treatment with 0.1 mM KBrO3 with or without DOX to induce A3A expression. For panels A and D, the “IND” column shows a Bliss independence model of additive activity of the 2 treatments, against which the combined treatment is tested (using t test, 2-tailed) to estimate synergistic activity [66]. Mean and SD are shown in all graphs. *, p ≤ 0.1, **, p ≤ 0.05 ***, p ≤ 0.01. Each experiment was repeated 3 times, and primary numerical data are provided in S5 Data. A3A, APOBEC3A; DOX, doxycycline; IR, ionizing radiation; KO, knockout; SC, synergy score; SD, standard deviation; WT, wild-type.
Fig 6
Fig 6. Secondary screening identifies modifiers of the response to A3A in HMCES KO LXF-289 cells.
(A) Schematic of the secondary screen in LXF-289 A3A HMCES KO cells. (B) PC analysis of A3A conditional LFC scores for all genes across all 10 experimental conditions (see labels next to arrows, which show loadings of the conditions on PC1 and PC2; HMCES wt refers to the parental LXF-289 cell line). Top genes, defined as the top 10 genes from S3C Fig, plus those that pass at least 1 filter (specified in the legend of S11 Fig), as well as additional genes that pass the filters when they are relaxed, are highlighted on the figure for each indicated comparison: green, synthetic advantage; black, synthetic lethality; red synthetic lethal in HMCES wt. Gene-level LFCs and GO analysis results are included in S6 and S7 Tables, and additional epistasis analysis is included in S11 Fig. (C) Selected genes from panel B, sorted by a score calculated as the mean of the standardized sgRNA LFCs and standardized MLE beta score differences from the 4 DOX vs. control comparisons of HMCES KO samples, minus the mean obtained in the same way for the HMCES wt samples. A negative score (black squares, as in B) indicates likely synthetic lethality with A3A expression in HMCES KO but not in HMCES wt, and a positive score (green triangles, as in B) suggests that the gene confers a synthetic advantage with A3A expression in HMCES KO, but not in HMCES wt (e.g., UNG). Known TSGs or oncogenes are indicated (see key, data derived from COSMIC: https://cancer.sanger.ac.uk/census). Gene products that are known PIKK substrates or regulators (PIKK) and those that have been demonstrated to localize to active replication forks (Fork) are indicated [–71]. Numerical data for panels B and C are provided in S6 Data. A3A, APOBEC3A; gDNA, guide DNA; GO, Gene Ontology; KO, knockout; LFC, log2 fold change; PC, principal component; PIKK, PI-3 kinase-like kinase; sgRNA, single gRNA; TSG, tumor supressor gene; wt, wild-type.

References

    1. Nik-Zainal S, Alexandrov LB, Wedge DC, Van P, Greenman CD, Raine K, et al.. Mutational processes molding the genomes of 21 breast cancers. Cell. 2012;149:979–93. 10.1016/j.cell.2012.04.024 - DOI - PMC - PubMed
    1. Nik-Zainal S, Wedge DC, Alexandrov LB, Petljak M, Butler AP, Bolli N, et al.. Association of a germline copy number polymorphism of APOBEC3A and APOBEC3B with burden of putative APOBEC-dependent mutations in breast cancer. Nat Genet. 2014;46:487–91. 10.1038/ng.2955 - DOI - PMC - PubMed
    1. Burns MB, Temiz NA, Harris RS. Evidence for APOBEC3B mutagenesis in multiple human cancers. Nat Genet. 2013;45:977–83. 10.1038/ng.2701 - DOI - PMC - PubMed
    1. Roberts SA, Lawrence MS, Klimczak LJ, Grimm SA, Fargo D, Stojanov P, et al.. An APOBEC cytidine deaminase mutagenesis pattern is widespread in human cancers. Nat Genet. 2013;45:970–6. 10.1038/ng.2702 - DOI - PMC - PubMed
    1. Roberts SA, Sterling J, Thompson C, Harris S, Mav D, Shah R, et al.. Clustered mutations in yeast and in human cancers can arise from damaged long single-strand DNA regions. Mol Cell. 2012;46:424–35. 10.1016/j.molcel.2012.03.030 - DOI - PMC - PubMed

Publication types

MeSH terms