. 2021 Mar 31;16(3):e0247614.
doi: 10.1371/journal.pone.0247614. eCollection 2021.

Containment of COVID-19: Simulating the impact of different policies and testing capacities for contact tracing, testing, and isolation

Affiliations

Containment of COVID-19: Simulating the impact of different policies and testing capacities for contact tracing, testing, and isolation

Vincenzo G Fiore et al. PLoS One. .

Abstract

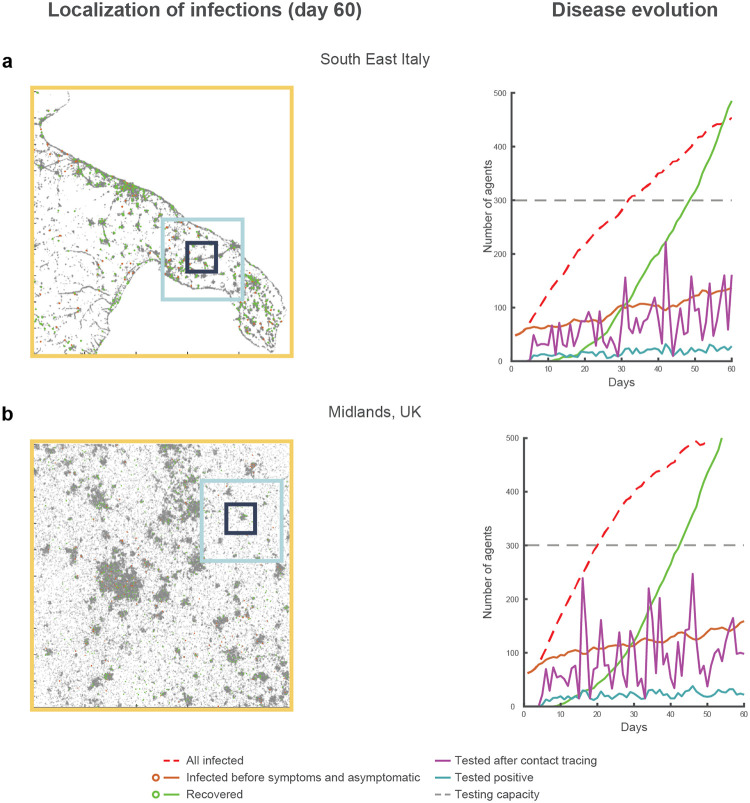
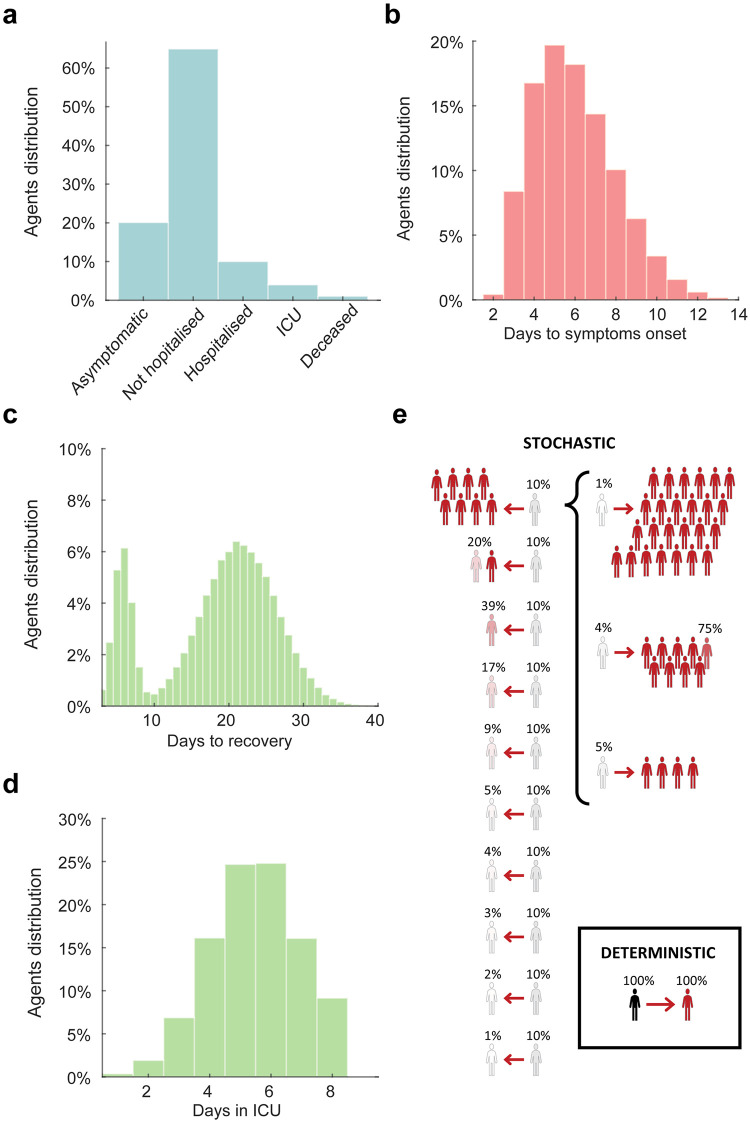
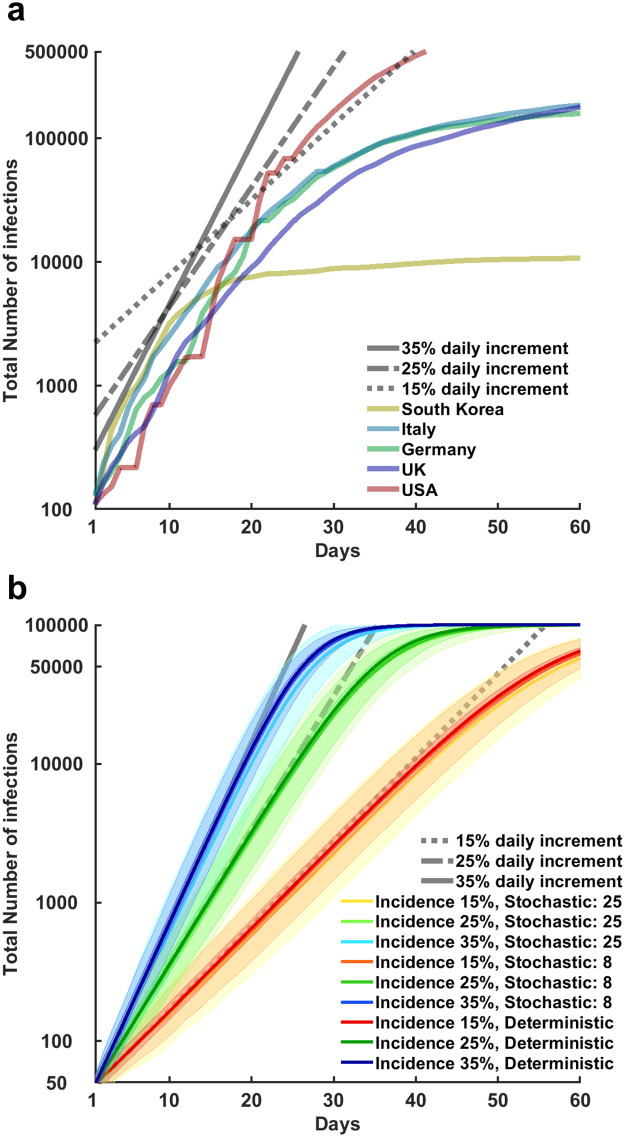
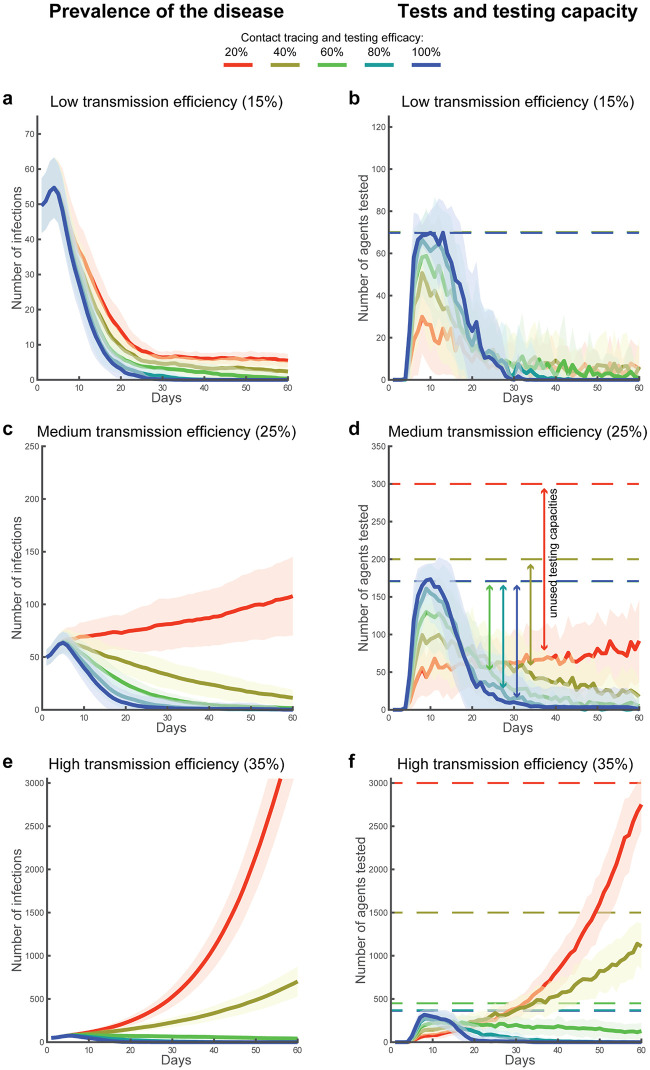
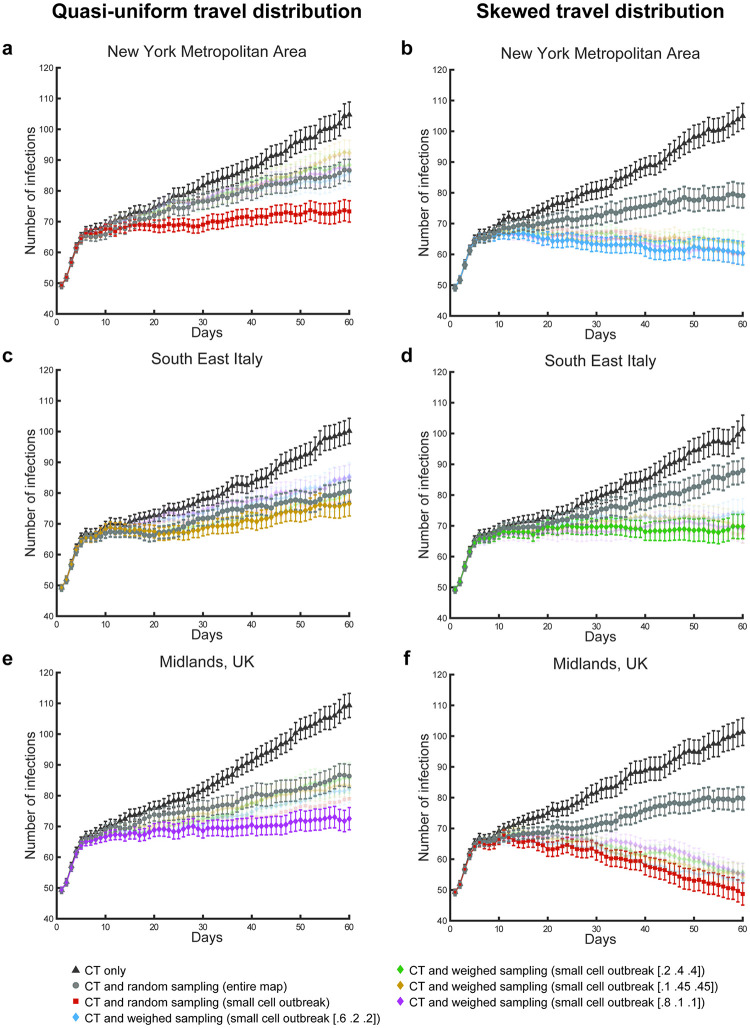
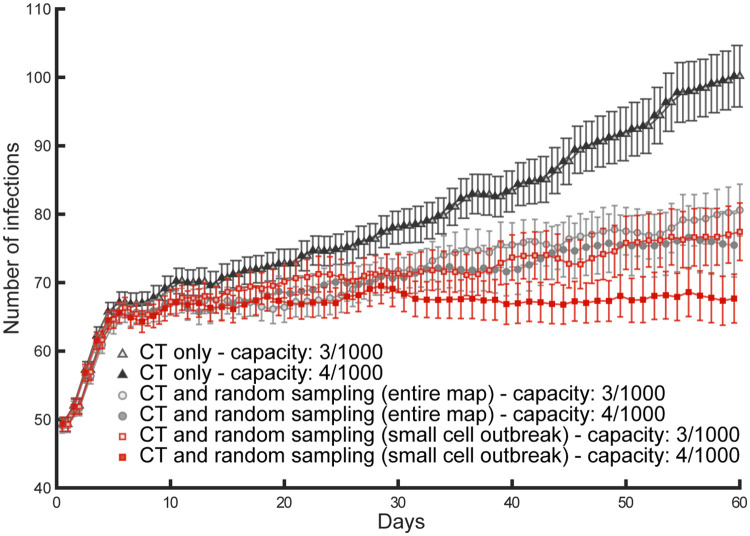
Efficient contact tracing and testing are fundamental tools to contain the transmission of SARS-CoV-2. We used multi-agent simulations to estimate the daily testing capacity required to find and isolate a number of infected agents sufficient to break the chain of transmission of SARS-CoV-2, so decreasing the risk of new waves of infections. Depending on the non-pharmaceutical mitigation policies in place, the size of secondary infection clusters allowed or the percentage of asymptomatic and paucisymptomatic (i.e., subclinical) infections, we estimated that the daily testing capacity required to contain the disease varies between 0.7 and 9.1 tests per thousand agents in the population. However, we also found that if contact tracing and testing efficacy dropped below 60% (e.g. due to false negatives or reduced tracing capability), the number of new daily infections did not always decrease and could even increase exponentially, irrespective of the testing capacity. Under these conditions, we show that population-level information about geographical distribution and travel behaviour could inform sampling policies to aid a successful containment, while avoiding concerns about government-controlled mass surveillance.


Conflict of interest statement

The authors have declared that no competing interests exist.

Figures

Fig 1
Fig 1. Simulated evolution of the virus transmission over two regions.
Illustration of two different simulations for the scenario 1 (i.e., identical seed) for the maps of southeast Italy (a) and the Midlands in UK (b). In the raster plots on the left, the dots represent the locations of the entire population of one hundred thousand agents. All simulations display the (failed) containment of the disease transmission relying only on contact tracing, testing, and isolation, under the conditions of medium relative transmission efficiency (25% daily increase in the number of infections), 20% contact tracing and testing efficacy, 20% of asymptomatic infections, deterministic transmission, and a distribution of travel cohorts of 40%, 30% and 30% for the short, medium and long travel range (respectively illustrated as black, blue and yellow squares overlaid on the maps). The right panels illustrate the oscillatory dynamic characterising the number of tests performed (magenta continuous line). The peaks in the number of tests performed never exhaust the daily testing capacity set for the simulations (horizontal dashed grey line). However, the process of contact tracing and testing constantly loses traces of the infection due to the low efficacy, determining the various dips in terms of the daily number of tests performed and consequently an increase in pre-symptomatic and asymptomatic infections (brown continuous line). Thus, this process failure in the attempt to find and isolate a sufficient number of infected agents to suppress or contain the reproduction of the infection is found irrespective of the testing capacity.
Fig 2
Fig 2. Simulation settings.
The histograms represent: a) the distribution of symptoms (under the condition of 30% of asymptomatic or paucisymptomatic infections, the difference is entirely absorbed by the number of not hospitalised agents); (b) days required for the symptoms onset; (c) days required for recovery after symptoms onset; (d) days required in intensive care unit. Note that the bimodal distribution of the days to recovery is due to the presence of asymptomatic or paucisymptomatic agents who are characterised by a shorter recovery time (marking the end of viral shedding). The days spent in the intensive care unit are considered as part of the time required to recovery, when recovery is possible. Finally, the diagram in panel e) illustrates the three conditions of secondary infection cluster size used for the simulations. In the deterministic case, each agent in the population, if infected and selected for the day, transmits the infection to one agent within their travel range. In the first stochastic condition of transmission, the population of agents is divided into 10 cohorts (each with the same assignment probability of 10%). In this case an infected agent transmits the infection to a number of targets that varies between 0 and 8 agents (e.g., a cluster size of 1.2 indicate 100% probability to reach one agent plus 20% probability to reach a second agent). In the second stochastic condition, the top cohort is split into 3 sub-cohorts with assigned probabilities of 5%, 4% and 1%. Under this condition, the number of possible targets of a single infected agent is up to 25.
Fig 3
Fig 3. Evolution in the total number of confirmed infections across multiple countries and simulated settings.
In the top panel (a), the time series illustrate on a logarithmic scale the number of total confirmed detected infections over a 60 days period for South Korea, Italy, Germany, United Kingdom, and United States (as reported by the World Health Organization). All these countries have recorded a first surge of detected infections that started in the period between late February and early March 2020. The curves have been aligned so to have at day 1 the first report of more than 100 total detected infections. The time series illustrate that the exponential growth in the number of infections was aligned initially on a 35% daily increment for all countries. After various mitigation policies became effective, the number of daily new infections (i.e. the relative transmission efficiency of the virus) followed a slower pace, at 25% increment, 15% or less. Finally, the curve is “flattened” for most countries, within the chosen time period of 60 days. Since mitigation strategies differ across countries, the curves highlight also important differences. Notably, in South Korea the prevalence of the disease was reduced to a very small number in a few days, by relying on a rapid expansion of contact tracing and testing efforts. Conversely, European countries had to rely on stay-at-home orders to achieve the same result after failed attempt to contain the viral transmission relying only on contact tracing and testing. For the United States, the initial daily average increment of 35% is sustained for a longer time than any other country here reported, resulting in a larger number of infections within the time frame considered. In the bottom panel (b) the error bands (mean and standard deviation) illustrate on a logarithmic scale the simulated number of total infected agents in a population of 100’000 agents, varying condition of transmission efficiency and size of the secondary infection clusters. These simulated scenarios assumed no testing and isolation strategy was in place and symptomatic agents were not automatically isolated at symptoms onset. The resulting exponential increase in the number of infections replicated the dynamics described for the real case scenarios presented in panel (a). These simulations also illustrate the effect of herd immunity, as the settings in the simulations do not allow any agent to be infected twice, the R0 decreases as a function of the number of infected agents that have become immune or died.
Fig 4
Fig 4. Disease prevalence, agents tested and capacity.
Error bands (mean and standard deviation) represent the prevalence of COVID-19 in the population over 60 days of simulated time (a, c, e), and the associated number of daily tested agents in relation with the respective testing capacities (solid and dotted lines respectively in b, d, f). The 3x5 design was used to simulate three conditions of simulated transmission efficiency, e.g., due to different mitigation strategies in place, which regulated the growth in the number of infections (a-b: 15%, c-d: 25% and e-f: 35%), and five conditions of contact tracing and testing efficacy (100%, 80%, 60%, 40% and 20%). These simulations illustrate the dynamics found across all conditions of symptomatology in the population distribution and across all conditions of secondary infection cluster size. For these simulations, the percentage of asymptomatic/paucisymptomatic infections is fixed at 20% and the size of the secondary infection cluster is fixed to 1 across all agents (i.e., deterministic setting).
Fig 5
Fig 5. Effects of mixed testing and isolation policies.
The charts report mean number of infections per day and standard error, associated with different conditions and testing policies. In particular, the panels highlight the different containment results generated using contact tracing and testing (CT), alone (black triangles), contact tracing and testing jointly with random sampling across the entire map (grey circles), and the combination of contact tracing and testing jointly with the best performing sampling policies. Note that these optimal policies change depending on the simulated conditions of geographical distribution and travel behaviour of the population. Under all conditions, the optimal testing policy to aid contact tracing limits the sampling to a cell in the map (100x100 pixel), centred on the coordinates of the most severe outbreak recorded in the previous day of simulated time. For two conditions, the optimal sampling is random within this cell (a, f). For the remaining four conditions (b, c, d, e), different sampling weights are used for the three cohorts of travel behaviour (short, medium, long travel range, respectively).
Fig 6
Fig 6. Increased testing capacity and testing policies.
These simulations illustrate the effects of an increase of testing capacity from 3 to 4 tests per thousand agents, jointly with 20% contact tracing and testing (CT) efficacy, deterministic transmission. The contact tracing and testing process, when considered alone (filled triangles for high capacity and empty triangles for high capacity), does not exhaust the initial testing capacity due to low efficacy, so that an increase in capacity is ineffective as it simply increases the number of unused tests per day. Instead, improved containment of the disease transmission is found both for contact tracing and testing jointly with random sampling over the entire population (filled circles for high capacity and empty circles for low capacity), as well as for contact tracing and testing jointly with random sampling over a small sector centred on the most recent outbreak (filled squares for high capacity and empty squares for low capacity). The latter mixed policy succeeds in keeping the number of daily infections constant (R0 ≈ 1), once the capacity is increased.

Update of

Similar articles

Cited by

References

    1. World Health Organization (2020) Novel Coronavirus (2019-nCoV) Situation Report– 1, Data as reported by: 20 January 2020.
    1. World Health Organization (2020) Weekly epidemiological update—1 December 2020.
    1. European Centre for Disease Prevention and Control (2020) Coronavirus disease 2019 (COVID-19) in the EU/EEA and the UK–tenth update, 11 June 2020. Stockholm: ECDC.
    1. European Centre for Disease Prevention and Control (2020) Coronavirus disease 2019 (COVID-19) in the EU/EEA and the UK–eleventh update, 10 August 2020. Stockholm: ECDC.
    1. World Health Organization (2020) Draft landscape of COVID-19 candidate vaccines—2 December 2020.

Publication types

MeSH terms