. 2021 Mar 31;17(3):e1009468.
doi: 10.1371/journal.ppat.1009468. eCollection 2021 Mar.

Staphylococcus aureus cell wall structure and dynamics during host-pathogen interaction

Affiliations

Staphylococcus aureus cell wall structure and dynamics during host-pathogen interaction

Joshua A F Sutton et al. PLoS Pathog. .

Abstract

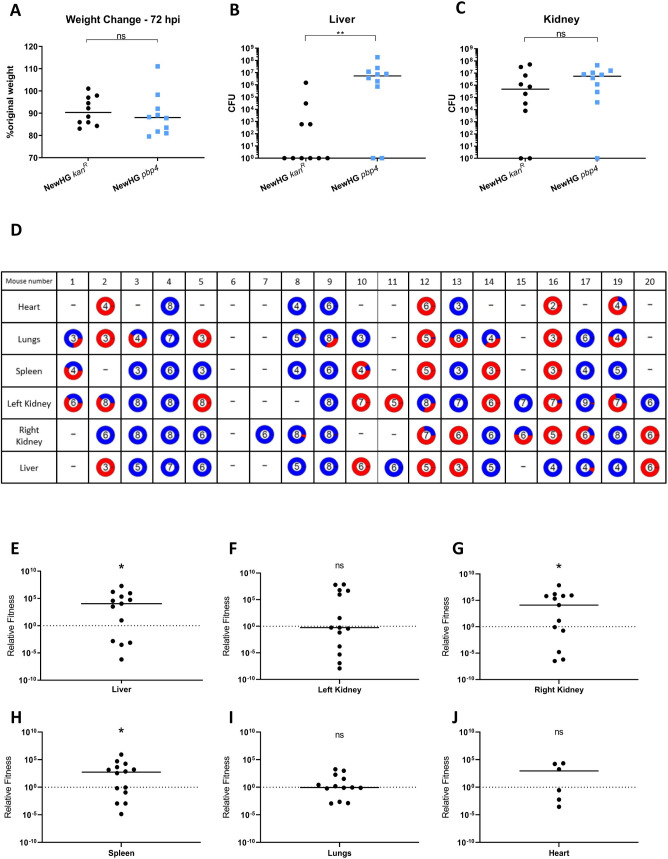
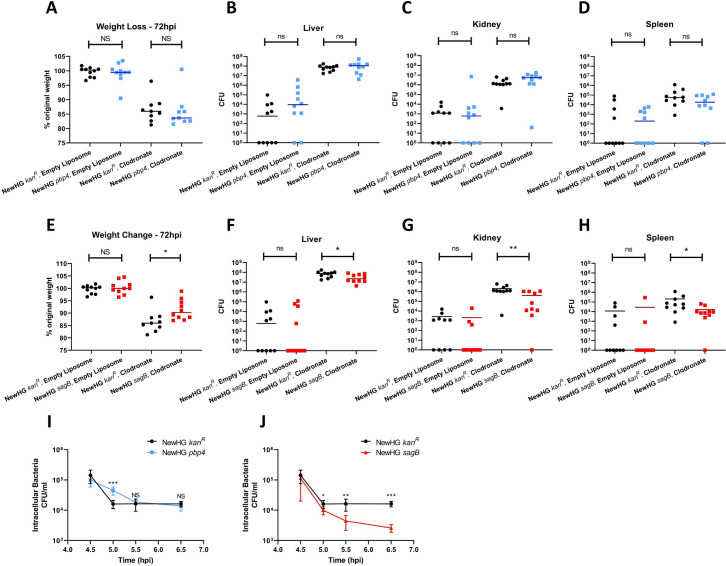
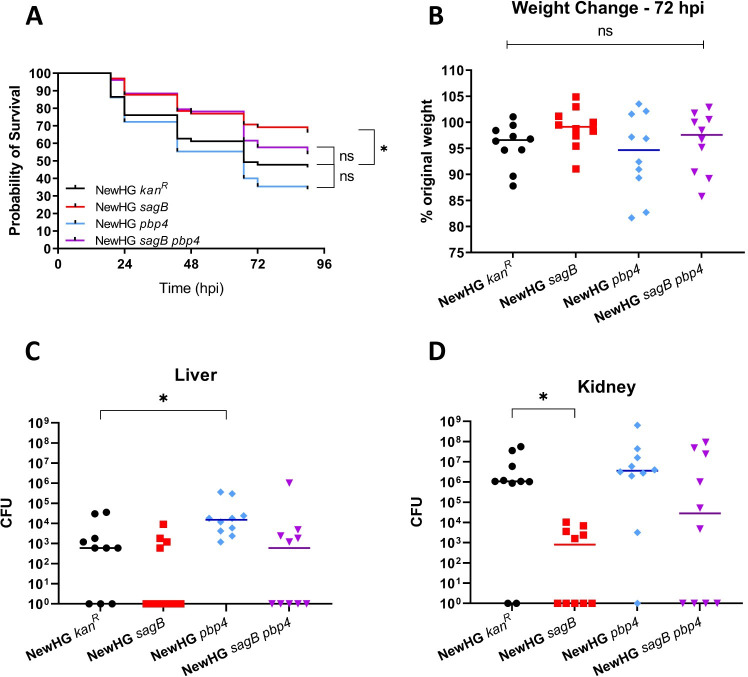
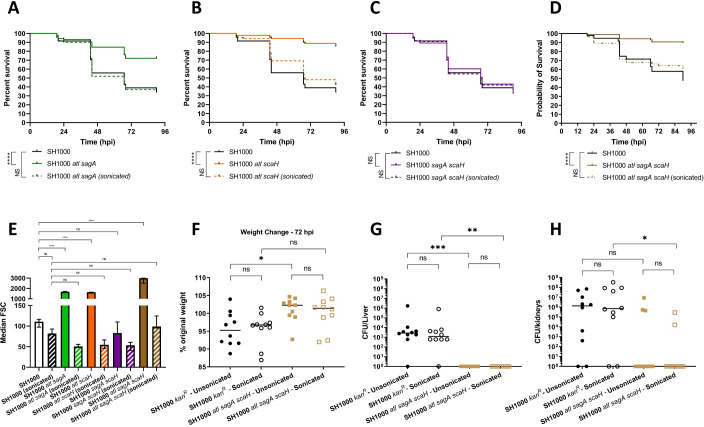
Peptidoglycan is the major structural component of the Staphylococcus aureus cell wall, in which it maintains cellular integrity, is the interface with the host, and its synthesis is targeted by some of the most crucial antibiotics developed. Despite this importance, and the wealth of data from in vitro studies, we do not understand the structure and dynamics of peptidoglycan during infection. In this study we have developed methods to harvest bacteria from an active infection in order to purify cell walls for biochemical analysis ex vivo. Isolated ex vivo bacterial cells are smaller than those actively growing in vitro, with thickened cell walls and reduced peptidoglycan crosslinking, similar to that of stationary phase cells. These features suggested a role for specific peptidoglycan homeostatic mechanisms in disease. As S. aureus missing penicillin binding protein 4 (PBP4) has reduced peptidoglycan crosslinking in vitro its role during infection was established. Loss of PBP4 resulted in an increased recovery of S. aureus from the livers of infected mice, which coincided with enhanced fitness within murine and human macrophages. Thicker cell walls correlate with reduced activity of peptidoglycan hydrolases. S. aureus has a family of 4 putative glucosaminidases, that are collectively crucial for growth. Loss of the major enzyme SagB, led to attenuation during murine infection and reduced survival in human macrophages. However, loss of the other three enzymes Atl, SagA and ScaH resulted in clustering dependent attenuation, in a zebrafish embryo, but not a murine, model of infection. A combination of pbp4 and sagB deficiencies resulted in a restoration of parental virulence. Our results, demonstrate the importance of appropriate cell wall structure and dynamics during pathogenesis, providing new insight to the mechanisms of disease.


Conflict of interest statement

The authors have declared that no competing interests exist.

Figures

Fig 1
Fig 1. TEM analysis of S. aureus NewHG grown in vitro and in vivo.
Thin sections of chemically fixed S. aureus NewHG kanR (SJF 3680) cultured in TSB to (A) exponential or (B) stationary phase or (C) recovered from murine kidneys (72 hpi). Scale bars (black line) represent500 nm. (D) Cell area of NewHG kanR cultured in TSB to exponential phase (3 independent repeats totalling 411 cells), in TSB to stationary phase (3 independent repeats totalling 320 cells) or recovered from murine kidneys (72 hpi) (2 independent repeats totalling 180 cells). Results analysed using a one-way ANOVA with multiple comparisons (* p = 0.0364, **** p < 0.0001). (E) Average cell wall thickness of NewHG kanR cultured in TSB to exponential phase (black lines, 3 independent repeats totalling 367 cells), in TSB to stationary phase (blue lines, 3 independent repeats totalling 256 cells) or recovered from murine kidneys (72 hpi) (red lines, 2 independent repeats totalling 104 cells). Results analysed using a one-way ANOVA with multiple comparisons (**** p < 0.0001). Box and whiskers for (D) and (E) represent mean, lower and upper quartiles, and range respectively. (F) Normalised percentage of NewHG kanR that show no, incomplete or a completed septum. Normalised proportions were compared using a two-way ANOVA with multiple comparisons with Tukey’s correction (no septa *** p = 0.0001, **** p < 0.0001; incomplete septa *** p = 0.0007, **** p < 0.0001; complete septa ** p = 0.0034 and 0.0057). Error bars represent the standard deviation of the mean. (Exponential phase cultured in TSB–black bars, stationary phase cultured in TSB–blue bars, cells recovered from murine kidney homogenate–red bars).
Fig 2
Fig 2. Analysis of S. aureus muropeptide profiles in different growth conditions.
Representative muropeptide profiles of NewHG kanR (SJF 3680) cultured in TSB in (A) exponential phase (OD600 ~0.6) or (B) stationary phase (OD600 ~9). Muropeptides have been labelled after being identified by MS (S1 Table) (C) Representative muropeptide profile of NewHG kanR (SJF 3680) recovered from murine kidneys 72 hpi. Identified muropeptides are labelled using muropeptide numbers from S3 Table. (D) Area of eluted identified UV-absorbing peaks shown as a percentage of the total of all identified peaks grouped based on cross-linking (exponential phase TSB—black bars n = 3, stationary phase TSB–blue bars n = 3, NewHG kanR recovered from murine kidney–red bars, n = 2 independent experiments, each consisting of 10 mice, error bars represent the standard deviation of the mean). A two-way ANOVA with Sidak’s multiple comparison post-test was used to compare abundance of each muropeptide species (monomers * p = 0.0108, ** p = 0.0081; oligomers * p = 0.0101, *** p = 0.0002). Representative generic muropeptide structures, (E) monomeric, (F) dimeric and (G) oligomeric.
Fig 3
Fig 3. The role of PBP4 in S. aureus virulence.
Mice (n = 10) were injected with approximately 5x10⁶ CFU S. aureus NewHG kanR (WT, SJF 3680) or NewHG pbp4::ery (SJF 5103). (A) Weight loss 72 hpi and CFUs recovered from (B) livers, (C) kidneys were determined. Groups were compared using a Mann-Whitney U test (NewHG kanR–black circles, NewHG pbp4::ery blue squares) (** p = 0.0051, * p = 0.0410). (D) Mice (n = 20) were injected with a 1:1 ratio (totalling 7 x 10⁶ CFU) of NewHG kanR (SJF 3680, red) and NewHG pbp4::ery (SJF 5103, blue). 72 hpi mice were culled and CFU ratios within organs were determined. The number in each pie chart represents the log total number of bacteria recovered (i.e. 106 CFU = 6). Mice 9 and 12 were culled at 54 hpi due to severity limits but are included in the analysis. Mouse 18 was found dead at 72 hpi and is excluded from analysis. The relative fitness of NewHG pbp4::ery (SJF 5103) against NewHG kanR (SJF 3680) was calculated using the formula w=x2(1x1)x1(1x2) (where w = relative fitness, X1 = starting mutant proportion and X2 = ending mutant proportion). This was calculated for the (E) liver (* p = 0.0105), (F) left kidney (p = 0.3258), (G) right kidney (* p = 0.0327), (H) spleen (* p = 0.0476), (I) lungs (p = 0.3396) and (J) heart (p = 0.43275). Line on graph depicts the median. Statistical significance was determined using a one sample Wilcoxon signed rank test, comparing the results to a theoretical median of 1, which would indicate an equal fitness between the strains.
Fig 4
Fig 4. The role of SagB in S. aureus virulence.
Approximately 1 x 10⁷ CFU of S. aureus NewHG kanR (SJF 3680) or NewHG sagB::kan (SJF 4912) were injected intravenously into mice (n = 10). (A) Weight loss 72 hpi (p = 0.0005), (B) liver CFU (p = 0.0178) and (C) kidney CFU (p = 0.0368). Groups were compared using a Mann-Whitney U test (NewHG kanR–black circles, NewHG sagB red squares).
Fig 5
Fig 5. The role of peptidoglycan metabolism components and macrophages in S. aureus host-pathogen interactions.
Mice (n = 10) were injected with approximately 1 x 10⁵ CFU of NewHG kanR (SJF 3680), NewHG pbp4::ery (SJF 5103) or NewHG sagB::kan (SJF 4912) 24 hours post treatment with either empty liposomes or clodronate containing liposomes. 72 hpi, mice were sacrificed and the weight change (A, E, * p = 0.0254) and liver (B, F, * p = 0.0243), kidney (C, G, ** p = 0.0030) and spleen (D, H, * p = 0.0196) CFU were determined. (NewHG kanR–black circles, NewHG pbp4::ery—blue squares, NewHG sagB::kan- red squares). One mouse in the NewHG kanR clodronate treated group and the NewHG pbp4 clodronate treated groups was culled at 48 hpi due to reaching severity limits and have been excluded from analysis. MDMs were infected with S. aureus NewHG kanR (SJF 3680, black bars), (I) NewHG pbp4::ery (SJF 5103, blue bars) or (J) or NewHG sagB::kan (SJF 4912, red bars) at a MOI of 5 (1 x 10⁶ CFU) for 4 hours before being treated with gentamycin for 0.5 hours to kill extracellular bacteria. MDMs were lysed at specific time points and intracellular bacterial numbers were determined. Paired two-tailed t-tests were used to compare between the strain CFU at subsequent time points. (For (I) *** p = 0.0008 and for (J) * p = 0.0250, ** p = 0.0075, *** p = 0.0003) Error bars show ±SD. (n = 3, each consisting of 2 intra-assay repeats).
Fig 6
Fig 6. Analysis of growth and virulence of NewHG sagB pbp4.
(A) Approximately 1500 CFU of bacteria (mutant or wildtype) was injected into the circulation valley of LWT zebrafish embryos around 30 hpf. A survival curve was produced comparing the virulence of parental NewHG (SJF 3663, black line) to: NewHG sagB::kan (SJF 4912, red line), NewHG pbp4::ery (SJF 5103, blue line) and NewHG sagB::kan pbp4::ery (SJF 5147, purple line). (3 repeats, n>20, * p = 0.0157). Mice (n = 10) were injected intravenously with approximately 1x10⁷ CFU S. aureus NewHG kanR (WT, SJF 3680), NewHG sagB::kan (SJF 4912), NewHG pbp4::ery (SJF 5103) or NewHG sagB::kan pbp4::ery (SJF 5147). (B) Weight loss 72 hpi and CFUs recovered from (C) livers (* p = 0.0119) and (D) kidneys (* p = 0.0055). Groups were compared using a Mann-Whitney U test (NewHG kanR–black circles, NewHG sagB::kan–red squares, NewHG pbp4::ery blue diamonds, NewHG sagB::kan pbp4::ery–purple triangles).
Fig 7
Fig 7. Role of putative glucosaminidases in S. aureus growth and virulence.
Survival curves comparing the virulence of 1300 CFU parental NewHG (SJF 3663, black lines) to (A) 400 particles unsonicated SH1000 atl sagA (SJF 5261, solid green line) consisting of 1300 bacteria (when sonicated) or approximately 1300 CFU of sonicated SH1000 atl sagA (broken green line). (B) 300 particles of unsonicated SH1000 atl scaH (SJF 5262, solid orange line) consisting of 1300 bacteria (after sonication) or 1300 CFU sonicated SH1000 atl scaH (broken orange line). (C) 1300 CFU unsonicated SH1000 sagA scaH (SJF 5217, solid purple line, sonication did not change CFU) or 1300 CFU sonicated SH1000 sagA scaH. (D) 100 particles of unsonicated SH1000 atl sagA scaH (consisting of 1500 bacteria, solid brown line), 1500 CFU of sonicated SH1000 atl sagA scaH (broken brown line). (A-D each consist of 3 repeats, n>20, **** p < 0.0001). (E) Comparison of the median FSC light values of parental SH1000 (unsonicated white bar, sonicated black and white bar), SH1000 atl sagA (unsonicated green bar, sonicated green and white bar), SH1000 atl scaH (unsonicated orange bar, sonicated orange and white bar) SH1000 sagA scaH (unsonicated purple bar, sonicated purple and white bar) and SH1000 atl sagA scaH (unsonicated brown bar, sonicated brown and purple bar). (n = 3, **** p < 0.0001). Error bars show ±SD, FSC values were compared using a one-way ANOVA with Dunnet’s multiple comparison test. (F-G) S. aureus SH1000 kanR (SJF 3674) or SH1000 atl sagA scaH (SJF 4611) were injected intravenously into mice (n = 10). Approximately 1 x 10⁷ bacteria were injected in unsonicated and sonicated groups. 1 x 10⁷ bacteria in 5 x 10⁶ particles of unsonicated SH1000 atl sagA scaH was injected (sonication had no effect on SH1000 kanR). (F) Weight loss 72 hpi (* p = 0.0314), (G) liver CFU (** p = 0.0014, *** p = 0.0003) and (H) kidney CFU (** p = 0.0096) were determined. Groups were compared using a Kruskal-Wallis test with multiple comparisons (Unsonicated SH1000 kanR–black circles, sonicated SH1000 kanR–open black circles, unsonicated SH1000 atl sagA scaH—brown squares and sonicated SH1000 atl sagA scaH–open brown squares). Sonication was for 20 seconds at an amplitude of 5 microns when required.

Similar articles

Cited by

References

    1. Mainous AG, Hueston WJ, Everett CJ, Diaz VA. Nasal Carriage of Staphylococcus aureus and Methicillin-Resistant S aureus in the United States, 2001–2002. Ann Fam Med. 2006;4: 132–137. 10.1370/afm.526 - DOI - PMC - PubMed
    1. Reddy PN, Srirama K, Dirisala VR. An Update on Clinical Burden, Diagnostic Tools, and Therapeutic Options of Staphylococcus aureus. Infect Dis (Auckl). 2017;10. 10.1177/1179916117703999 - DOI - PMC - PubMed
    1. Kim HK, Missiakas D, Schneewind O. Mouse models for infectious diseases caused by Staphylococcus aureus. Journal of Immunological Methods. 2014;410: 88–99. 10.1016/j.jim.2014.04.007 - DOI - PMC - PubMed
    1. Pollitt EJG, Szkuta PT, Burns N, Foster SJ. Staphylococcus aureus infection dynamics. PLOS Pathogens. 2018;14: e1007112. 10.1371/journal.ppat.1007112 - DOI - PMC - PubMed
    1. Turner RD, Vollmer W, Foster SJ. Different walls for rods and balls: the diversity of peptidoglycan. Molecular Microbiology. 2014;91: 862–874. 10.1111/mmi.12513 - DOI - PMC - PubMed

Publication types

MeSH terms