. 2021 Mar 31;17(3):e1009443.
doi: 10.1371/journal.ppat.1009443. eCollection 2021 Mar.

Bacteria primed by antimicrobial peptides develop tolerance and persist

Affiliations

Bacteria primed by antimicrobial peptides develop tolerance and persist

Alexandro Rodríguez-Rojas et al. PLoS Pathog. .

Abstract

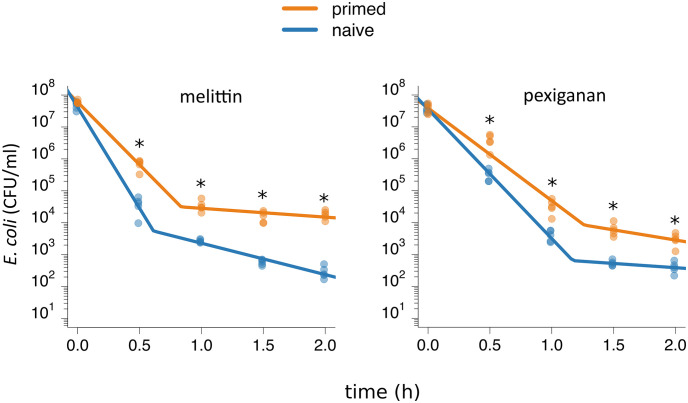
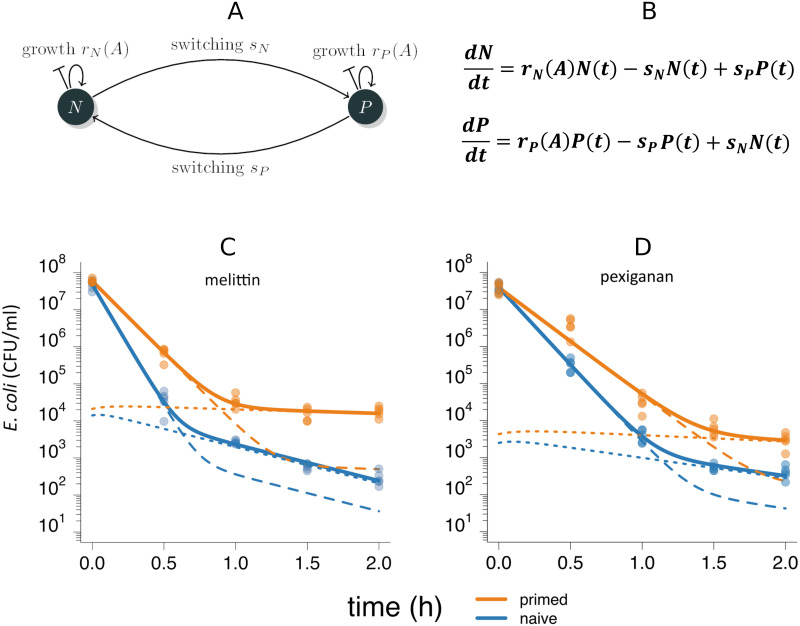
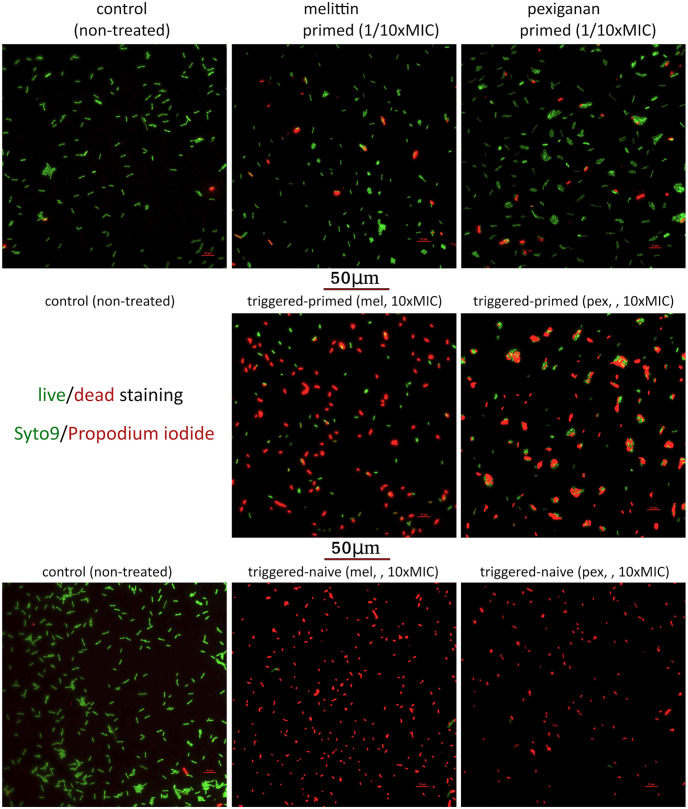
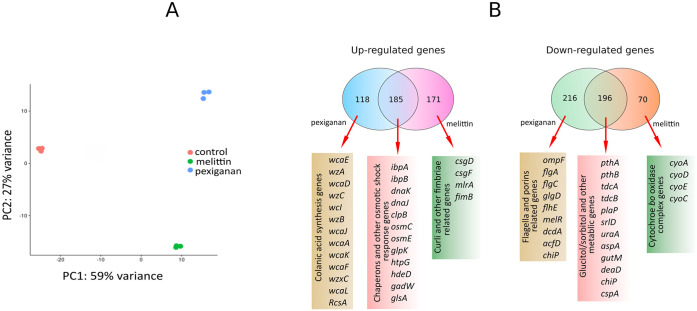
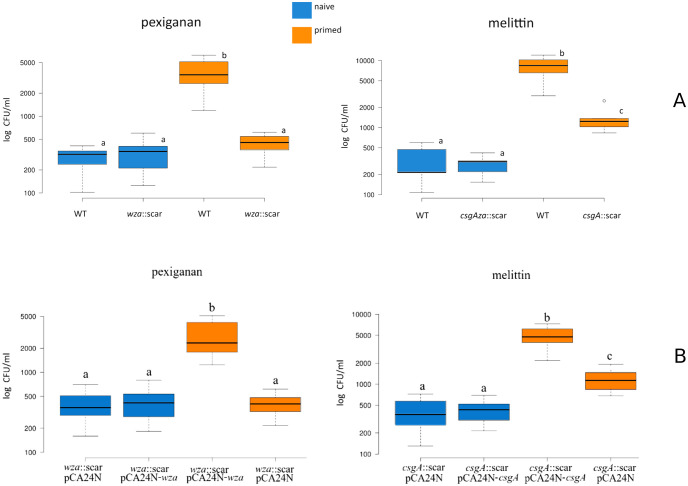
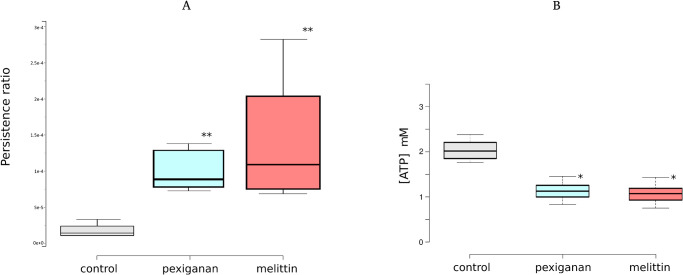
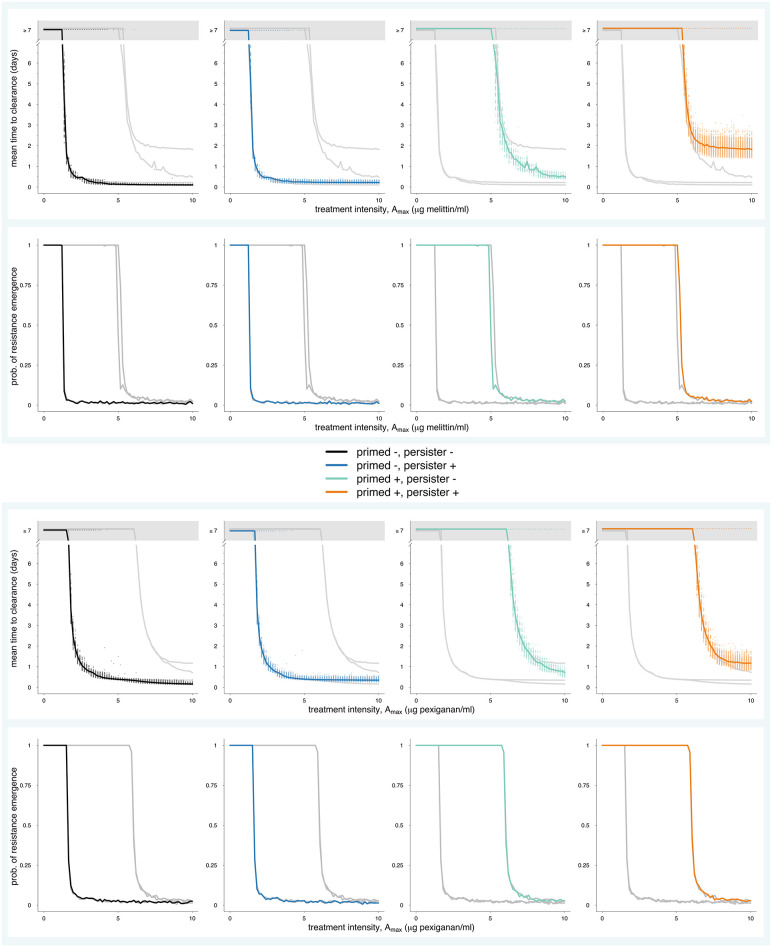
Antimicrobial peptides (AMPs) are key components of innate immune defenses. Because of the antibiotic crisis, AMPs have also come into focus as new drugs. Here, we explore whether prior exposure to sub-lethal doses of AMPs increases bacterial survival and abets the evolution of resistance. We show that Escherichia coli primed by sub-lethal doses of AMPs develop tolerance and increase persistence by producing curli or colanic acid, responses linked to biofilm formation. We develop a population dynamic model that predicts that priming delays the clearance of infections and fuels the evolution of resistance. The effects we describe should apply to many AMPs and other drugs that target the cell surface. The optimal strategy to tackle tolerant or persistent cells requires high concentrations of AMPs and fast and long-lasting expression. Our findings also offer a new understanding of non-inherited drug resistance as an adaptive response and could lead to measures that slow the evolution of resistance.


Conflict of interest statement

The authors have declared that no competing interests exist.

Figures

Fig 1
Fig 1. Bacterial tolerance and persistence determine the shape of time-kill curves.
Time-kill experiments with E. coli K-12 MG1655: primed (orange) and naive (blue) bacteria were exposed to 10xMIC of (A) melittin and (B) pexiganan. At each time-point, we measured the bacterial population size 5 times. We tested if priming influenced tolerance and persistence with contrasts following an ANOVA. For both antimicrobials, priming significantly increased the slope of the first phase, the measure of tolerance, and the bacterial level in the second phase, the measure of persistence, (significance level: p < 0.05). We corrected for multiple testing with the Bonferroni-method. The line in the plots indicates the best fit of a biphasic function (S2 Table), on which our statistical analysis is based.
Fig 2
Fig 2. The two-state model describes time-kill data.
(A) The two-state model (adapted from 29) consists of two subpopulations, normal cells (N) and persister cells (P) and is parameterized with the growth rates rN(A) and rP(A), which are dependent on the concentration of AMPs (A) in the system, and the switching rates sN, and sP. Each subpopulation is described with an ordinary differential equation (B), which describes the change of the respective subpopulation over time. For each antimicrobial, melittin (C) and pexiganan (D), we fitted the model to the data of naive (blue) and primed (orange) bacterial populations (see also Fig 1) individually. The continuous lines represent the total bacterial population B(t), with B(t) = N(t) + P(t), and the dashed and dotted lines represent the subpopulations N(t) and P(t), respectively. Bacteria primed with melittin have an increased net growth rate rN and decreased sP compared to the naive populations. In the case of pexiganan, the parameter rN is significantly higher in primed compared to naive populations. For an overview of the fitted parameters, see S5 Table.
Fig 3
Fig 3. Cell viability after treating with priming and trigger doses of melittin and pexiganan were determined using the live/dead BacLight Bacterial Viability Kit (Thermo Scientific, Germany) on-chip as described in the Material and methods section.
After priming during 30 minutes, the treatments were removed by perfusing fresh MHB. The cells were allowed to recover for another 30 minutes and challenged with 10xMIC for 10 minutes. The AMPs were quickly removed by perfusing fresh MHB supplemented with syto9 and propidium iodide. The fluorescence images were acquired as described in the Material and methods section.
Fig 4
Fig 4. Gene expression in primed E. coli.
(A) Principal component 1 separates the control from the peptide priming, PC2 separates the melittin induced response from the pexiganan response. (B) Venn diagrams showing specific and overlapping responses of E. coli MG1655 to priming concentrations of melittin and pexiganan.
Fig 5
Fig 5. E. coli MG1655 treated for 30 minutes with 1/10xMIC (priming concentration) of pexiganan (A) and non-treated bacteria (B, control) observed under phase contrast microscopy.
The specimens consisted of cells suspended in a 0.1% solution of nigrosin to create a strong contract to visualize the colanic acid capsules. Bacteria were observed with 1000X magnification.
Fig 6
Fig 6. SEM of E. coli MG1655 treated with 1/10xMIC (priming concentration) of pexiganan (A) and melittin (B) and non-treated bacteria (B, middle row, control).
Bacteria were treated with the AMPs for 30 minutes before sample fixation. No apparent differences were noticed between melittin-treated cells (C) and controls. In case of pexiganan, the treated cells tend to aggregate, a phenotype that is consistent with the presence of colanic acid. Red arrows indicate shadowed areas potentially produced by the capsule of colanic acid that collapse fixation and dehydration. Bacteria were observed with different magnifications ranging from 3000X to 40000X.
Fig 7
Fig 7. Detection of curli production by primed cells after exposure to a killing dose (10xMIC) of melittin for 30 minutes before image acquisition.
Curli production is only detected in a small proportion of primed cells (survival fraction). After treatment, we exposed the cells to ECtracer 680 (Ebba Biotech, Sweden), a red fluorescent tracer molecule for staining of curli.
Fig 8
Fig 8. Boxplots data show deficient priming responses of the E. coli MG1655 mutants wza::scar and csgA::scar when they are exposed to triggering concentrations of pexiganan and melittin respectively (top panel).
Complementation restores the lost priming capacity for both mutants in E. coli MG1655 csgA::scar and wza::scar (down panel). The strains were complemented with the plasmids pCA24N-wza and pCA24N-csgA from the ASKA collection. Note that control cells that were transformed with the cloning vector pCA24N show a decreased priming response similar to the one from the mutants. The statistical differences were tested by one-way ANOVA and Dennett’s tests. Different letters highlight significant differences (p<0.05).
Fig 9
Fig 9. Cell viability and persister formation after AMP priming.
The number of persister cells was determined after treating with priming doses of melittin and pexiganan. After priming for 30 minutes, the treatment was removed by centrifuging and washing cells twice with 2 ml of fresh MHB. Ciprofloxacin was added to a final concentration of 2 μg/ml and survival was determined by plating in MHB agar after 4 hours’ incubation (panel A). Before the addition of ciprofloxacin, the intracellular ATP concentration was also measured (panel B). The pre-treatment with melittin or pexiganan did not change the MIC of E. coli to melittin, pexiganan or ciprofloxacin (S1 Table).
Fig 10
Fig 10. Influence of priming on time until clearance and resistance evolution.
We extended a previously developed pharmacokinetics (PK) and pharmacodynamic (PD) framework to include persistence (S3B Fig). With this framework, we estimated PD curves (S7 Fig) for primed and naive bacteria and the estimated switching rates (Fig 2) to predict time until clearance and probability of resistance evolution. We simulated primed bacteria with heterogeneous population consisting of N and P subpopulations (primed +, persisters +), and naive bacteria with heterogeneous subpopulation (primed -, persisters +). In addition, we simulated dynamics without persistence for both primed and naive bacteria (primed +, persisters - and primed -, persisters–). In in row 1 and 3, each dot is an individual run. The lines denote the average of the respective runs. No clearance (grey area) means that simulated treatment could not reduce bacteria population < 1 cell within 7 days of treatment. For comparison, we plotted all simulation results in each plot. All parameter values used in the mathematical model are listed in S5 Table.

Similar articles

Cited by

References

    1. Lazzaro BP, Zasloff M, Rolff J. Antimicrobial peptides: Application informed by evolution. Science (80-). American Association for the Advancement of Science; 2020;368: eaau5480. 10.1126/science.aau5480 - DOI - PMC - PubMed
    1. Bevins CL, Salzman NH. Paneth cells, antimicrobial peptides and maintenance of intestinal homeostasis [Internet]. Nature Reviews Microbiology. Nat Rev Microbiol; 2011. pp. 356–368. 10.1038/nrmicro2546 - DOI - PubMed
    1. Mergaert P. Role of antimicrobial peptides in controlling symbiotic bacterial populations [Internet]. Natural Product Reports. Royal Society of Chemistry; 2018. pp. 336–356. 10.1039/c7np00056a - DOI - PubMed
    1. Mookherjee N, Anderson MA, Haagsman HP, Davidson DJ. Antimicrobial host defence peptides: functions and clinical potential [Internet]. Nature Reviews Drug Discovery. Nature Research; 2020. 10.1038/s41573-019-0058-8 - DOI - PubMed
    1. Koo HB, Seo J. Antimicrobial peptides under clinical investigation. Pept Sci. John Wiley and Sons Inc.; 2019;111. 10.1002/pep2.24122 - DOI

Publication types

MeSH terms