. 2021 Jun 11;186(2):1336-1353.
doi: 10.1093/plphys/kiab155.

Drought affects the rate and duration of organ growth but not inter-organ growth coordination

Affiliations

Drought affects the rate and duration of organ growth but not inter-organ growth coordination

Lennart Verbraeken et al. Plant Physiol. .

Abstract

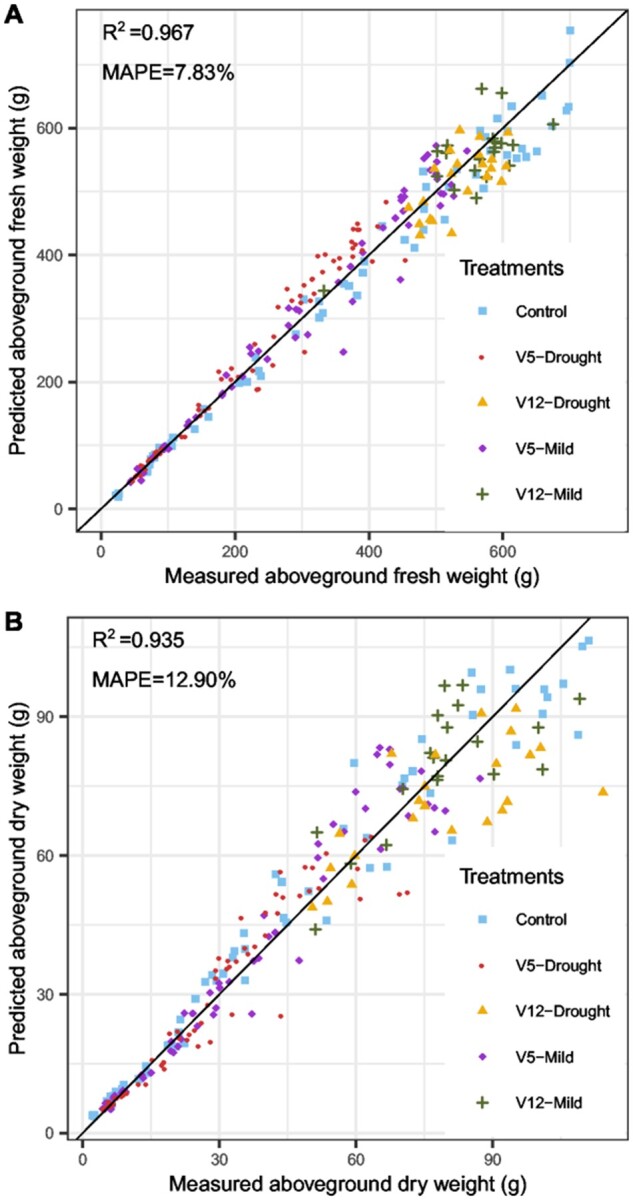
Drought at flowering and grain filling greatly reduces maize (Zea mays) yield. Climate change is causing earlier and longer-lasting periods of drought, which affect the growth of multiple maize organs throughout development. To study how long periods of water deficit impact the dynamic nature of growth, and to determine how these relate to reproductive drought, we employed a high-throughput phenotyping platform featuring precise irrigation, imaging systems, and image-based biomass estimations. Prolonged drought resulted in a reduction of growth rate of individual organs-though an extension of growth duration partially compensated for this-culminating in lower biomass and delayed flowering. However, long periods of drought did not affect the highly organized succession of maximal growth rates of the distinct organs, i.e. leaves, stems, and ears. Two drought treatments negatively affected distinct seed yield components: Prolonged drought mainly reduced the number of spikelets, and drought during the reproductive period increased the anthesis-silking interval. The identification of these divergent biomass and yield components, which were affected by the shift in duration and intensity of drought, will facilitate trait-specific breeding toward future climate-resilient crops.


Figures

Figure 1
Figure 1
Illustration of plant growth, development and drought treatments on the PHENOVISION platform. A. Illustration of plant growth and development over time in the PHENOVISION platform. For all treatments, images from left to right were taken at 15, 25, 35, 45, 55, and 65 d after plant emergence. Control plants (top row) were kept well-watered throughout their entire development. Drought-treated plants were kept well-watered until reaching the V5 or V12 developmental stage (middle or bottom row, respectively), after which the soil water content was lowered for the remainder of the experiment. The mean plant age at the start of the V5- and V12-Drought treatments is indicated by a red or yellow arrow, respectively. B, Visualization of the soil water content after daily watering throughout plant development for the Control, V5-Drought, and V12-Drought treatments. Upon reaching V5 or V12 stage, target soil humidity was lowered from 2.4 g H2O/g dry soil to 1.4 g H2O/g dry soil. On average, V5-Drought plants did not receive water for 7 d (until their soil water content was sufficiently reduced), and V12-Drought plants did not receive water for 3 d on average.
Figure 2
Figure 2
Mean timing of organ growth and selected developmental stages for all treatments. Tall vertical lines indicate the mean plant age at the start of the drought treatments (16.3 DAE for V5-Drought, 39.6 DAE for V12-Drought). Open rectangles indicate the average growth timespan for the observed leaf ranks, with a vertical line inside the rectangle indicating the mean plant age at the emergence of the leaf from the whorl. Growth timespans were determined from three-piece-linear functions fitted to the length profiles of individual leaves. Filled rectangles indicate the elongation timespan for different subgroups of internodes (Int). Elongation timespans were determined from three-piece-linear functions fitted to destructive measurements from multiple plants throughout growth. Short vertical lines indicate the mean plant age at tassel emergence from the whorl (Tassel), ear husk leaf emergence (Ear), anthesis (Anthesis), and silk emergence (Silking). Sample numbers (n) for different leaf traits can be found in Supplemental Table S1. For the internode traits, n = 48 for the Control treatment, n = 49 for the V5-Drought treatment, and n = 22 for the V12-Drought treatment (after V12-stage). Sample numbers for the reproductive developmental time points can be found in Supplemental Table S3.
Figure 3
Figure 3
Scatterplot of the observed values for mean LER (mm/day) on the x-axis and LED on the y-axis (days) for the different treatments and leaf ranks observed. The overall Pearson’s correlation coefficient r between LED and mean LER is −0.96 at a P < 10−149. Exact sample numbers (n) for leaf growth curves can be found in Supplemental Table S1 for the traits LERmean and LED.
Figure 4
Figure 4
Growth curves for leaves, stems, stem fractions, and ears and ear development. A–C, Leaf elongation rates based on beta-sigmoid growth curves fitted to the length profiles of leaves 4, 6, 9, 12, 15, and 18 and their sum (gray) and smoothed sum (black), for the well-watered treatment (A), V5-Drought treatment (B), and V12-Drought treatment (C). Underlying leaf length data and fits are visualized in Supplemental Figure S4, A–C. Exact sample numbers (n) for leaf growth curves can be found in Supplemental Table S1, under the trait FLL. D–F, Elongation rates for the well-watered treatment (D), V5-Drought treatment (E), and the V12-Drought treatment (F) based on beta-sigmoid growth curves fitted to the length profiles of the stem fractions composed of internodes 1–8, 9–11, 12–14, 15–17, and 18–19 and the whole stem up to node 20 (black). An alternative approach to obtain the stem elongation rate is to take a smoothed sum of the elongation rates of the stem fractions (gray). Black vertical lines in B, C, E, F indicate the start of V5- or V12-Drought treatment. For the internode traits: n = 48 for the Control treatment, n = 49 for the V5-Drought treatment, and n = 37 for the V12-Drought treatment (22 V12-Drought samples taken after V12-stage, complemented with data from 15 Control-treated plants sampled before the V12-stage). G and H, Ear development over time, the number of ear rows (G) and spikelets per row (H) over time for the three treatments. Each circle represents a separate plant and lines are smoothing splines fitted to the measurements of all plants in a treatment. n = 119 for Control, n = 116 for V5-Drought, and n = 69 for V12-Drought (of which 54 were V12-Drought-treated plants after the V12-stage and 15 were Control-treated plants before the V12-Stage). I, Ear elongation rate as derived from exponential growth functions fitted to ear length measurements over time for the three treatments. n = 97 for Control, n = 101 for V5-Drought, and n = 69 for V12-Drought (of which 54 were V12-Drought-treated plants after the V12-stage and 15 were Control-treated plants before the V12-Stage). Yellow vertical lines in G, H, I indicate the start of the V12-Drought treatment. J, The development of the number of spikelets per ear compared with the ear elongation rate. Each circle represents a separate plant and lines are smoothing splines fitted to the measurements of all plants in a treatment. n = 90 for Control, n = 90 for V5-Drought, and n = 63 for V12-Drought (of which 54 were V12-Drought treated plants after the V12-stage and 9 were Control treated plants before the V12-Stage). Raw length data for A–F and I are shown in Supplemental Figure S4.
Figure 5
Figure 5
Performance of the image-based biomass estimation models. A, Performance of the image-based fresh weight prediction model. B, Performance of the image-based dry weight prediction model. Predictions were made using leave-one-out-cross-validation: Each prediction is made using a model trained on all other data points. Destructively measured ground-truth biomass measurements are on the x-axes; image-based predictions using leave-one-out cross-validation are on the y-axes. n = 236 (69 Control, 63 V5-Drought, 61 V5-Mild, 23 V12-Drought, 20 V12-Mild) for both fresh and dry weight. R2 and MAPE values are displayed in the top left.
Figure 6
Figure 6
Plant biomass and biomass accumulation rates over time. A, Estimated above-ground plant fresh weight over time. B, estimated above-ground plant dry weight over time. C, estimated plant fresh weight accumulation rate over time. D, estimated plant dry weight accumulation rate over time. Thin lines connect daily estimates of weight of individual plants in A and B, while circles indicate individual estimates of accumulation rates in C and D. Thick lines trace the daily mean values per treatment. Vertical dashed lines indicate the mean time of drought treatment initiation (V5-Drought: 16.3 DAE, V12-Drought: 39.6 DAE), and the colored rectangles directly above the x-axis indicate the periods in which there is a significant difference (Mann–Whitney U test with Holm–Bonferroni multiple testing correction, P < 0.05) between the respective drought treatment and the control treatment. Detachment and loss of lower leaves caused a loss of biomass and a perceived reduction and inaccurate estimation in biomass accumulation rate for all treatments during the period 40 DAE – 45 DAE. The total number of observations for both FW and DW is 24,982 (9137 Control, 10,778 V5-Drought, and 5067 V12-Drought) for 897 unique observed plants (384 Control, 376 V5-Drought, 137 V12-Drought). The details regarding the number of observations for each day can be found for FW in Supplemental Table S8, DW in Supplemental Table S9, FW accumulation rate in Supplemental Table S6, and DW accumulation rate in Supplemental Table S7.
Figure 7
Figure 7
Normalized organ growth rates over time. The cumulative elongation rate of the leaves, the stem elongation rate, and the ear elongation rate are all scaled relative to the peak value in the control treatment. Cumulative leaf growth rate is represented by a cubic smoothing spline fitted to the sum of the growth rates of the individual measured leaves. Stem growth rate is calculated as the first derivative of a beta-sigmoid growth function fitted to stem length measurements. Ear growth rate is calculated as the first derivative of an exponential growth function fitted to ear length measurement. Vertical dashed lines indicate the start of the drought treatments (V5-Drought: 16.3 DAE, V12-Drought: 39.6 DAE). This figure is supplemented with biomass accumulation data in Supplemental Figure S9A and treatments are combined in a single graph for comparing treatment effects in Supplemental Figure S9B.

References

    1. Anami SE, Mgutu AJ, Taracha C, Coussens G, Karimi M, Hilson P, Van Lijsebettens M, Machuka J (2010) Somatic embryogenesis and plant regeneration of tropical maize genotypes. Plant Cell Tiss Organ Cult 102: 285–295
    1. Asaari MSM, Mertens S, Dhondt S, Inzé D, Wuyts N, Scheunders P (2019) Analysis of hyperspectral images for detection of drought stress and recovery in maize plants in a high-throughput phenotyping platform. Comput Electron Agric 162: 749–758
    1. Avramova V, AbdElgawad H, Vasileva I, Petrova AS, Holek A, Mariën J, Asard H, Beemster GTS (2017) High antioxidant activity facilitates maintenance of cell division in leaves of drought tolerant maize hybrids. Front Plant Sci 8: 84. - PMC - PubMed
    1. Avramova V, AbdElgawad H, Zhang Z, Fotschki B, Casadevall R, Vergauwen L, Knapen D, Taleisnik E, Guisez Y, Asard H, et al. (2015) Drought induces distinct growth response, protection and recovery mechanisms in the maize leaf growth zone. Plant Physiol 169: 1382–1396 - PMC - PubMed
    1. Bechtold U, Penfold CA, Jenkins DJ, Legaie R, Moore JD, Lawson T, Matthews JSA, Vialet-Chabrand SRM, Baxter L, Subramaniam S, et al. (2016) Time-series transcriptomics reveals that AGAMOUS-LIKE22 affects primary metabolism and developmental processes in drought-stressed Arabidopsis. Plant Cell 28: 345–366 - PMC - PubMed

Publication types

LinkOut - more resources