Review
. 2021 Aug;113(8):344-373.
doi: 10.1111/boc.202000110. Epub 2021 Apr 28.

Dynamic interplay between cell membrane tension and clathrin-mediated endocytosis

Affiliations
Review

Dynamic interplay between cell membrane tension and clathrin-mediated endocytosis

Umidahan Djakbarova et al. Biol Cell. 2021 Aug.

Abstract

Deformability of the plasma membrane, the outermost surface of metazoan cells, allows cells to be dynamic, mobile and flexible. Factors that affect this deformability, such as tension on the membrane, can regulate a myriad of cellular functions, including membrane resealing, cell motility, polarisation, shape maintenance, membrane area control and endocytic vesicle trafficking. This review focuses on mechanoregulation of clathrin-mediated endocytosis (CME). We first delineate the origins of cell membrane tension and the factors that yield to its spatial and temporal fluctuations within cells. We then review the recent literature demonstrating that tension on the membrane is a fast-acting and reversible regulator of CME. Finally, we discuss tension-based regulation of endocytic clathrin coat formation during physiological processes.

Keywords: Cell migration/adhesion; Cellular imaging; Clathrin; Endocytosis/exocytosis; Membrane tension; Membrane trafficking.


Conflict of interest statement

Conflict of interest statement

The authors have declared no conflict of interest.

Figures
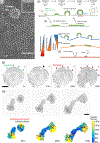
Figure 1 |
Figure 1 |. Structural and dynamic heterogeneity of endocytic clathrin-coated structures
(a) Quick-freeze deep-etch electron microscopy images show coats of distinct geometries that clathrin triskelions (inset) can assemble into, that is, highly curved pits and flat lattices. Scale bars, 33 nm. Reproduced, with permission, from Heuser et al. (1987). (b) Initiation (nucleation), formation (growth), scission (budding) and dissolution (uncoating) phases of endocytic clathrin vesicle formation are depicted according to the constant curvature model [Kirchhausen, 2009, Willy et al., 2019]. In this model, curvature is initiated and maintained by adaptor-mediated recruitment of clathrin triskelions to the plasma membrane. Various adaptor/accessory proteins take action at different stages, (c) An alternative (flat-to-curved transition) model predicts that flat clathrin arrays are the precursors of curved clathrin pits: the bending of the membrane takes place rather abruptly after the coat area reaches a critical threshold [Avinoam et al., 2015, Sochacki and Taraska, 2019]. (d) The energy cost of membrane bending is at the minimum when the tension is low. This allows formation of curved and dynamic clathrin pits, (e) clathrin arrays with lower curvature levels are formed on surfaces with moderate tension [Saleem et al., 2015]. These structures have slower internalisation dynamics (i.e., longer lifetimes) compared with Clathrin pits [Ferguson et al., 2016, Saffarian et al., 2009, Batchelder and Yarar, 2010]. (f) Increased membrane tension can lead to complete Inhibition of clathrin coat formation [Saleem et al., 2015] either due to hindered Initiation or premature disassembly (abortion), (g) Fluorescence images (Inverted) show clathrin coats at the ventral surface of a cultured cell originally extending toward the top-right corner of the field of view. Each spot corresponds to an Individual endocytic clathrin coat. The lamella ceases to extend and begins to retract upon contact with a micromanipulator- controlled glass tip (the site of contact is marked by the black arrowhead). Retraction of the lamella is accompanied by a rapid increase in the initiation rate of endocytic clathrin coats at the ventral surface. Scale bar, 20 μm. Reproduced, with permission, from Ferguson et al. (2017). (h) Fluorescence images (inverted) show clathrin coats at the ventral surface of two asymmetrically spreading cells (upper panel). clathrin coat lifetime maps assembled for the same cells demonstrate the spatial heterogeneity in CME dynamics at various stages of spreading (lower panel). Significant correlation between the lifetime dipoles (vector pointing toward the area with longer clathrin coat lifetimes) and displacement of cells affirm the front-to-rear tension gradient in migrating cells. Scale bar, 10 μm. Reproduced, with permission, from Willy et al. (2017).
Figure 2 |
Figure 2 |. Origins and quantification of membrane tension in live cells
(a) Schematic representations of the plasma membrane, where the phospholipid bilayer is shown In gray, proteins attached to the underlying actin cytoskeleton (green) are in red and proteins with no interaction with the cytoskeleton are in blue, (b) Mem-brane blebs form when the lipid bilayer is detached from the cytoskeleton. (c) The plasma membrane is modelled as a viscous fluid flowing through immobile proteins with the Darcy permeability (k) used to obtain the diffusion coefficient, (d) Micropipette aspiration allows the use of Laplace’s law for determining the tension as a function of the membrane curvature and pressure difference between the inside and outside of the micropipette. (e) Membrane tether forces (f) measured by various force spec-troscopy techniques, such as optical tweezers, can be used to quantify the tension on the membrane. (F) A membrane tether is generated on the surface of a fibroblast by pulling an optically trapped bead attached to the plasma membrane. Reproduced, with permission, from Gauthier et al. (2009). (g) Membrane tether forces measured at different stages of cell spreading demon-strate a significant reduction in membrane tension. Reproduced, with permission, from Gauthier et al. (2009). (h) A front-to-rear gradient in membrane tension is assessed using optical tweezers in migrating cells. Reproduced, with permission, from Lieber et al. (2015).
Figure 3 |
Figure 3 |. Assessing endocytic clathrin coat dynamics
(a) Kymograph shows the CME activity at the ventral surface of a cell. Each dark streak is the trace of an individual clathrin coat. Blue and red arrowheads mark the initiation and dissolution of a clathrin coat, respectively, and the time between the two (Δt) is the lifetime. Clathrin traces elongate gradually upon increase of membrane tension via microaspiration of the cell from the dorsal surface (starting with the dashed line), (b) Fluorescence intensity profiles are shown for three independent endocytic clathrin coats with lifetimes of 105,63 and 38 s, respectively. In each trace, increasing signal intensity is due to the growth/formation of the coat and the rapid dimming marks the dissolution (i.e., uncoating), (c) Microaspiration slows down CME dynamics due to increased tension. Clathrin coat lifetime distributions are assembled for cells before and during aspiration, (d) Density of de novo clathrin- coated vesicle formation also reduces significantly with the increasing levels of membrane tension, (e) Fluorescence intensity traces of multiple clathrln-coated structures are averaged after synchronisation at the beginning, maximum intensity frame and end of traces. Both the rates of growth/formation and dissolution slow down upon microaspiration, (f) Change in endocytic dynamics induced by increased tension (due to microaspiration) can be observed in growth rate distributions. Increasing tension inhibits fast formation and dissolution rates, resulting In distributions having smaller standard deviations (SDs). (g) The change in the SD of clathrin growth rates is shown for 9 microaspirated BSC1 cells. The lower SD values indicate slower CME dynamics, (h) Membrane tension can also be changed by increasing the hydrostatic pressure in cells upon squeezing. Kymograph shows the clathrin traces detected at the ventral surface of a cell at two distinct levels of squeezing (marked by the dashed lines), (i) The SD of the growth rates reduce in a stepwise manner due to increased membrane tension at discrete levels of squeezing. Reproduced, with permission, from Ferguson et al. (2016, 2017).
Figure 4 |
Figure 4 |. Spatiotemporal variations in CME dynamics during Drosophila embryogenesis
(a) Changes in CME dynamics at the amnioserosa tissues during the dorsal closure of embryos. Box plots show SD of growth rate distributions obtained from amnioserosa tissues at early and late stages of the dorsal closure. CME dynamics slow down with increasing tension In the tissue, (b) Left, clathrin-coated structures at the dorsal surface of a Drosophila embryo. Right, SD map determined using clathrin growth rates obtained at the amnioserosa (AS) and the lateral epidermis (LE) tissues. Lower values of the SD demonstrate slower CME dynamics at the AS tissue, (c) More examples demonstrating the spatial heterogeneity of CME dynamics at the dorsal surface of late stage Drosophila embryos, (d) Box plots showing SD of growth rates obtained from lateral epidermis and amnioserosa tissues. Reproduced, with permission, from Willy et al. (2017).
Figure 5 |
Figure 5 |
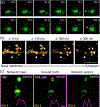
(a) TIRF-SIM time-lapse acquisitions in live COS-7 cells show clathrin-coated pits aggregated into plaques and dis-sociation of individual pits (indicated by arrowheads) from the plaque. Reproduced, with permission, from Li et al. (2015). (b) Three-dimensional stochastic optical reconstruction microscopy (STORM) images show a clathrin plaque at different axial positions. Arrowheads mark the positions of clathrin-coated pits in the vicinity of the plaque. Scale bar, 1 μm. Reproduced, with permission, from Leyton-Puig et al. (2017). (c) Generative adversarial networks enable super-resolution in clathrin coat images acquired using diffraction-limited microscopy. Clathrin-coated structures at the ventral surface a SUM159 cell genome edited to express AP2 adaptor protein fused with GFP, where the left panel is the original acquisition at the TIRF mode, the middle panel Is the TIRF-SIM Image of the same area, and the right panel is the prediction of the deep neural network. The Intensity profile between the two arrowheads is plotted at the bottom-right corner of each image to demonstrate resolution enhancement. Scale bar, 500 nm. Reproduced, with permission, from Wang et al. (2019).
Figure 6 |
Figure 6 |. CME dynamics in spreading cells
(a) Membrane tether force measurements conducted on a spreading cell demonstrate Increased tension during extension of the membrane and reduction in tension during retraction. Yellow dashed line shows the position of the cell boundary over time. Reproduced, with permission, from Masters et al. (2013). (b) Snapshots show the bottom surface of a spreading cell at different time points. Note that clathrin coat initiation is hindered due to high membrane tension at the early stages of spreading (see Figure 2G). Traces with distinct colours belong to endocytic clathrin coats with different lifetimes, (c) For the spreading cell shown in b, the upper panel shows the change in average clathrin coat lifetime and spreading area. The bottom panel is the temporal evolution of the SD of growth rates during spreading. Note that Increased clathrin lifetimes and reduced SD mark slow CME dynamics due to high tension during spreading. The dynamics recover when the spreading is complete, (d) Average normalised lifetime is plotted for different membrane extension rates obtained from multiple spreading cells. Reproduced, with permission, from Willy et al. (2017).
Figure 7 |
Figure 7 |. CME dynamics during cell migration
(a) Fluorescence Image (Inverted) shows clathrln-coated structures at the ventral and dorsal surfaces of a migrating cell. The arrow marks the direction of migration, (b) Clathrin coat traces obtained from the cell in a are colour coded relative to their z-position. (c) Growth rate map of the dorsal surface created using the SD of local clathrin growth rates. SD values are lower in the vicinity of the leading edge due to slower CME dynamics, (d) Lifetime distributions of dorsal clathrin coats at the lamellar region (orange) and leading edge (indigo), (e) Box plots show SD of growth rate distributions of clathrin coat populations at the leading edge and lamellar regions obtained in different cells, (f) Hemocytes expressing fluorescently tagged clathrin (green) and CD4 (red) are imaged at the ventral surface of late Drosophila embryos. For this particular hemocyte, the analyses in G-J demonstrate that the density of endocytic clathrin-coated structures is lower at the leading edge during in vivo migration, (g) Positions of the clathrin coats within the proximity of the cell surface are shown with green dots. (H and I) Gray scale represents thickness of the hemocyte. Z-position (h) and local densities (i) of clathrin-coated structures are colour coded, (j) Spatial density map of clathrin-coated structures generated from average distance between them. Reproduced, with permission, from Willy etal. (2017).
Figure 8 |
Figure 8 |. Origins of tension heterogeneity across the plasma membrane of spreading and migrating cells
(a) When newly placed on a substrate, the cell appears rounded and membrane tension is localised at membrane folds, (b) Isotropic spreading occurs as extra membrane is unfolded. Tension rises at locations of actin cytoskeleton polymerisation and as additional area provided by membrane folds is depleted, (c) Anisotropic spreading occurs, where focal adhesions are formed from actin rearrangement. Exocytosis levels increase to balance the high membrane tension manifested in isotropic spreading, (d) Plasma membrane area dramatically increases as the cell reduces the number of protrusions. Focal adhesions attach tightly to the substrate and tension stabilises towards a resting level, as cell spreading completes. Exocytosis activity is balanced by CME, which experiences spatlotemporal heterogeneity upon spreading, (e) Cell polarisation occurs due to rearrangement of the actin cytoskeleton, which results in the generation of a single stable protrusion at the leading edge and multiple protrusions at the trailing edge. A front-to-rear tension heterogeneity in the plasma membrane Is exhibited [Lieber et al., 2015], where CME activity is reduced at the leading edge and enhanced at the trailing edge [Willy et al., 2017]. (f) Cell polarity is improved by adhesive contacts between the cell and the substrate. The establishment of a front-to-rear tension gradient generated by cell polarisation induces migration to occur.

Similar articles

Cited by

References

    1. Aghamohammadzadeh S. and Ayscough KR (2009) Differential requirements for actin during yeast and mammalian endocytosis. Nat. Cell Biol 11,1039–1042. - PMC - PubMed
    1. Agrawal A. and Steigmann DJ (2009) Modeling protein-mediated morphology in biomembranes. Biomech. Model. Mechanobioi 8, 371–379. - PubMed
    1. Agrawal NJ, Nukpezah J. and Radhakrishnan R. (2010) Minimal Mesoscale Model for Protein-Mediated Vésiculation in Clathrin-Dependent Endocytosis. PLoS Comput. Biol 6, e1000926. - PMC - PubMed
    1. Aguet F, Antonescu CN, Mettlen M, Schmid SL and Danuser G (2013) Advances in Analysis of Low Signai-to-Noise Images Link Dynamin and AP2 to the Functions of an Endocytic Checkpoint. Dev. Cell 26, 279–291. - PMC - PubMed
    1. Aguet F, Upadhyayula S, Gaudin R, Chou Y, Cocucci E, He K, Chen B-C, Mosaliganti K, Pasham M, Skillern W, Legant WR, Liu T-L, Findlay G, Marino E, Danuser G, Megason S, Betzig E. and Kirchhausen T. (2016) Membrane dynamics of dividing cells imaged by lattice light-sheet microscopy. Mol. Biol. Cell 27, 3418–3435. - PMC - PubMed

LinkOut - more resources