. 2021 May;35(5):e21467.
doi: 10.1096/fj.202002387R.

Gene expression profiles of diabetic kidney disease and neuropathy in eNOS knockout mice: Predictors of pathology and RAS blockade effects

Affiliations

Gene expression profiles of diabetic kidney disease and neuropathy in eNOS knockout mice: Predictors of pathology and RAS blockade effects

Stephanie A Eid et al. FASEB J. 2021 May.

Abstract

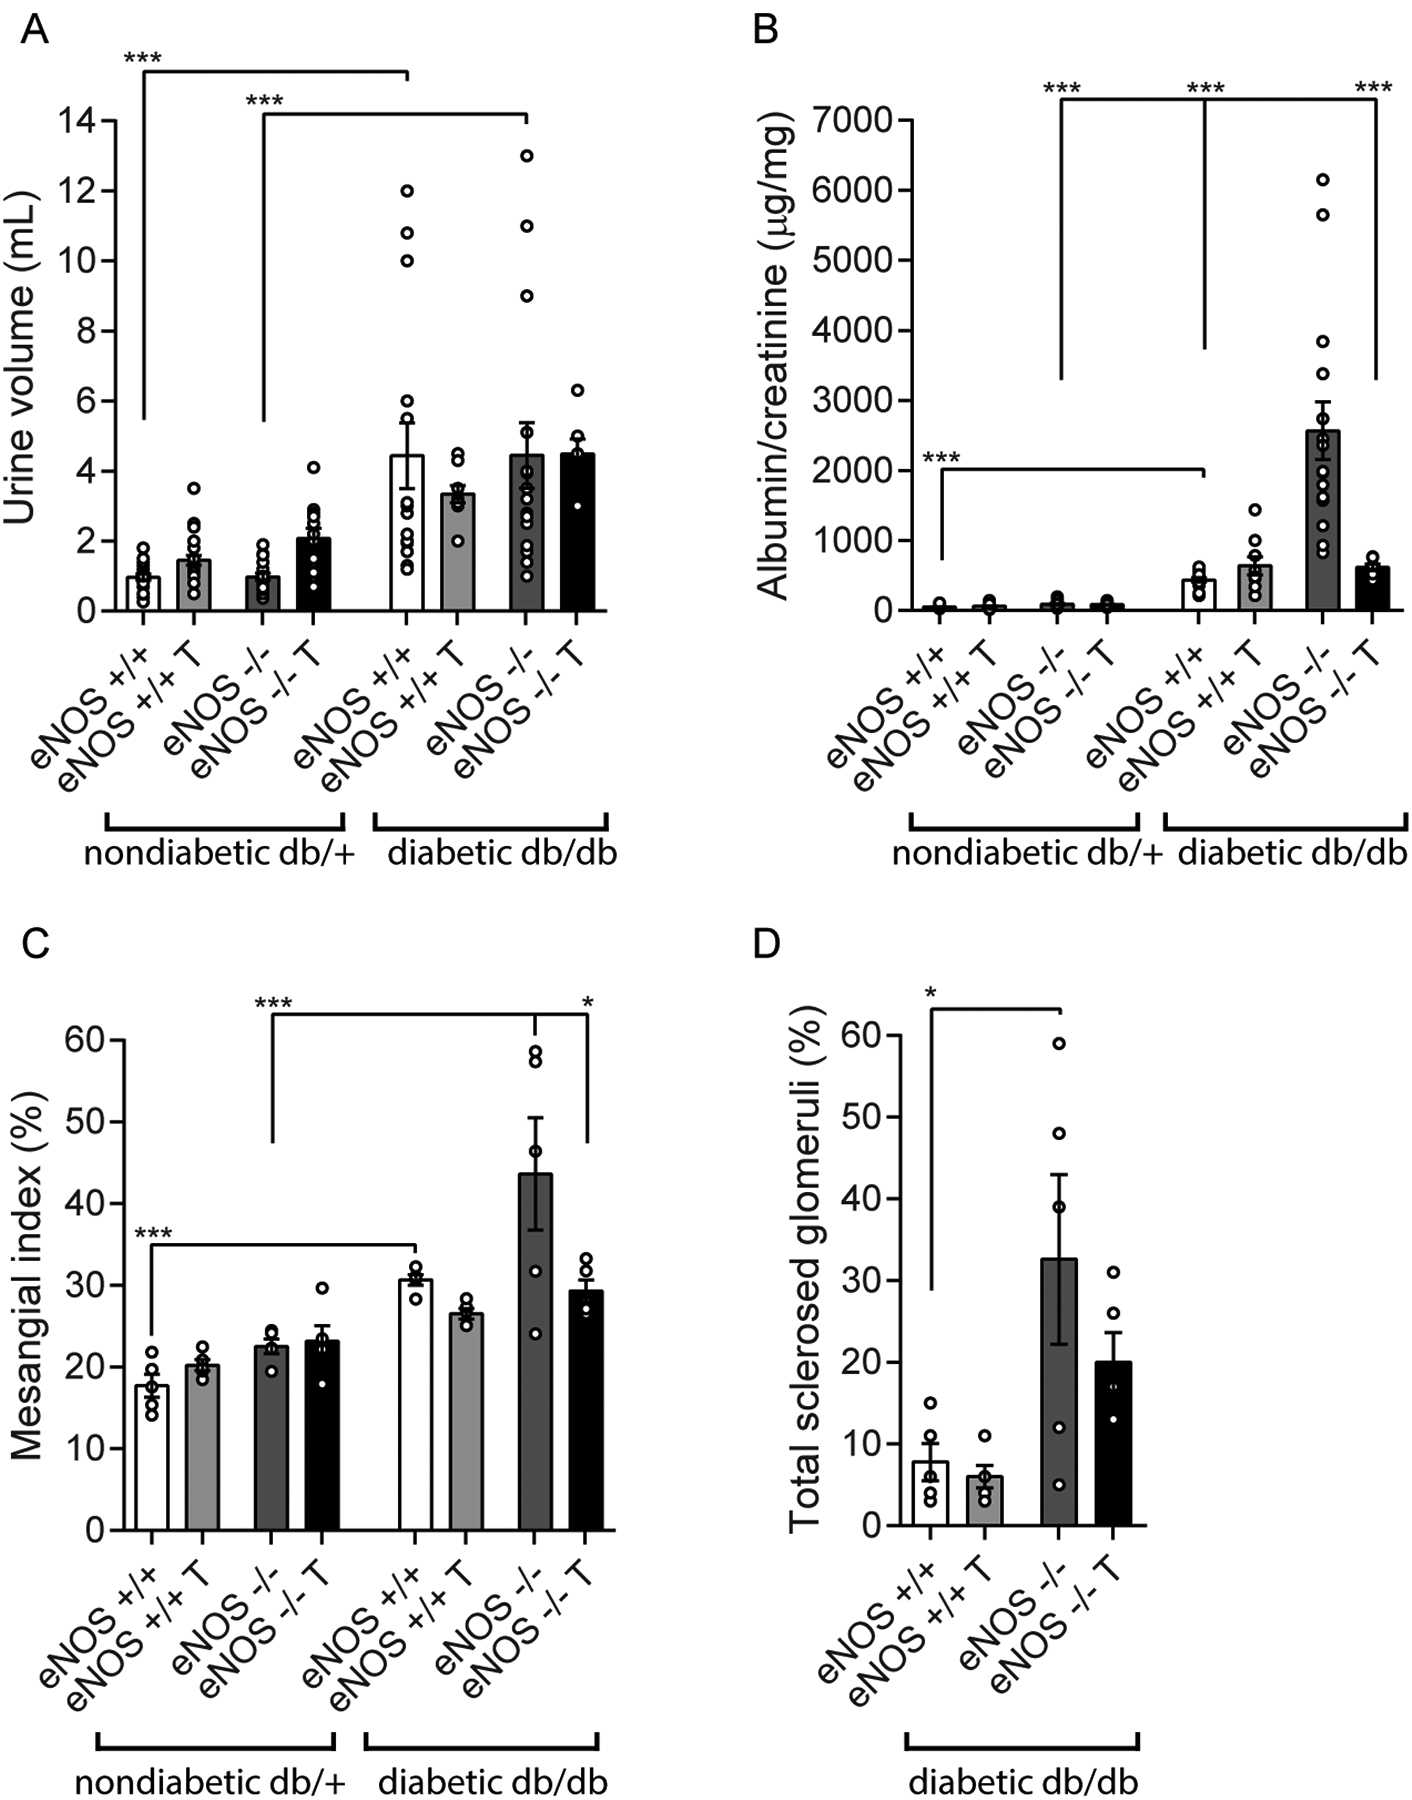
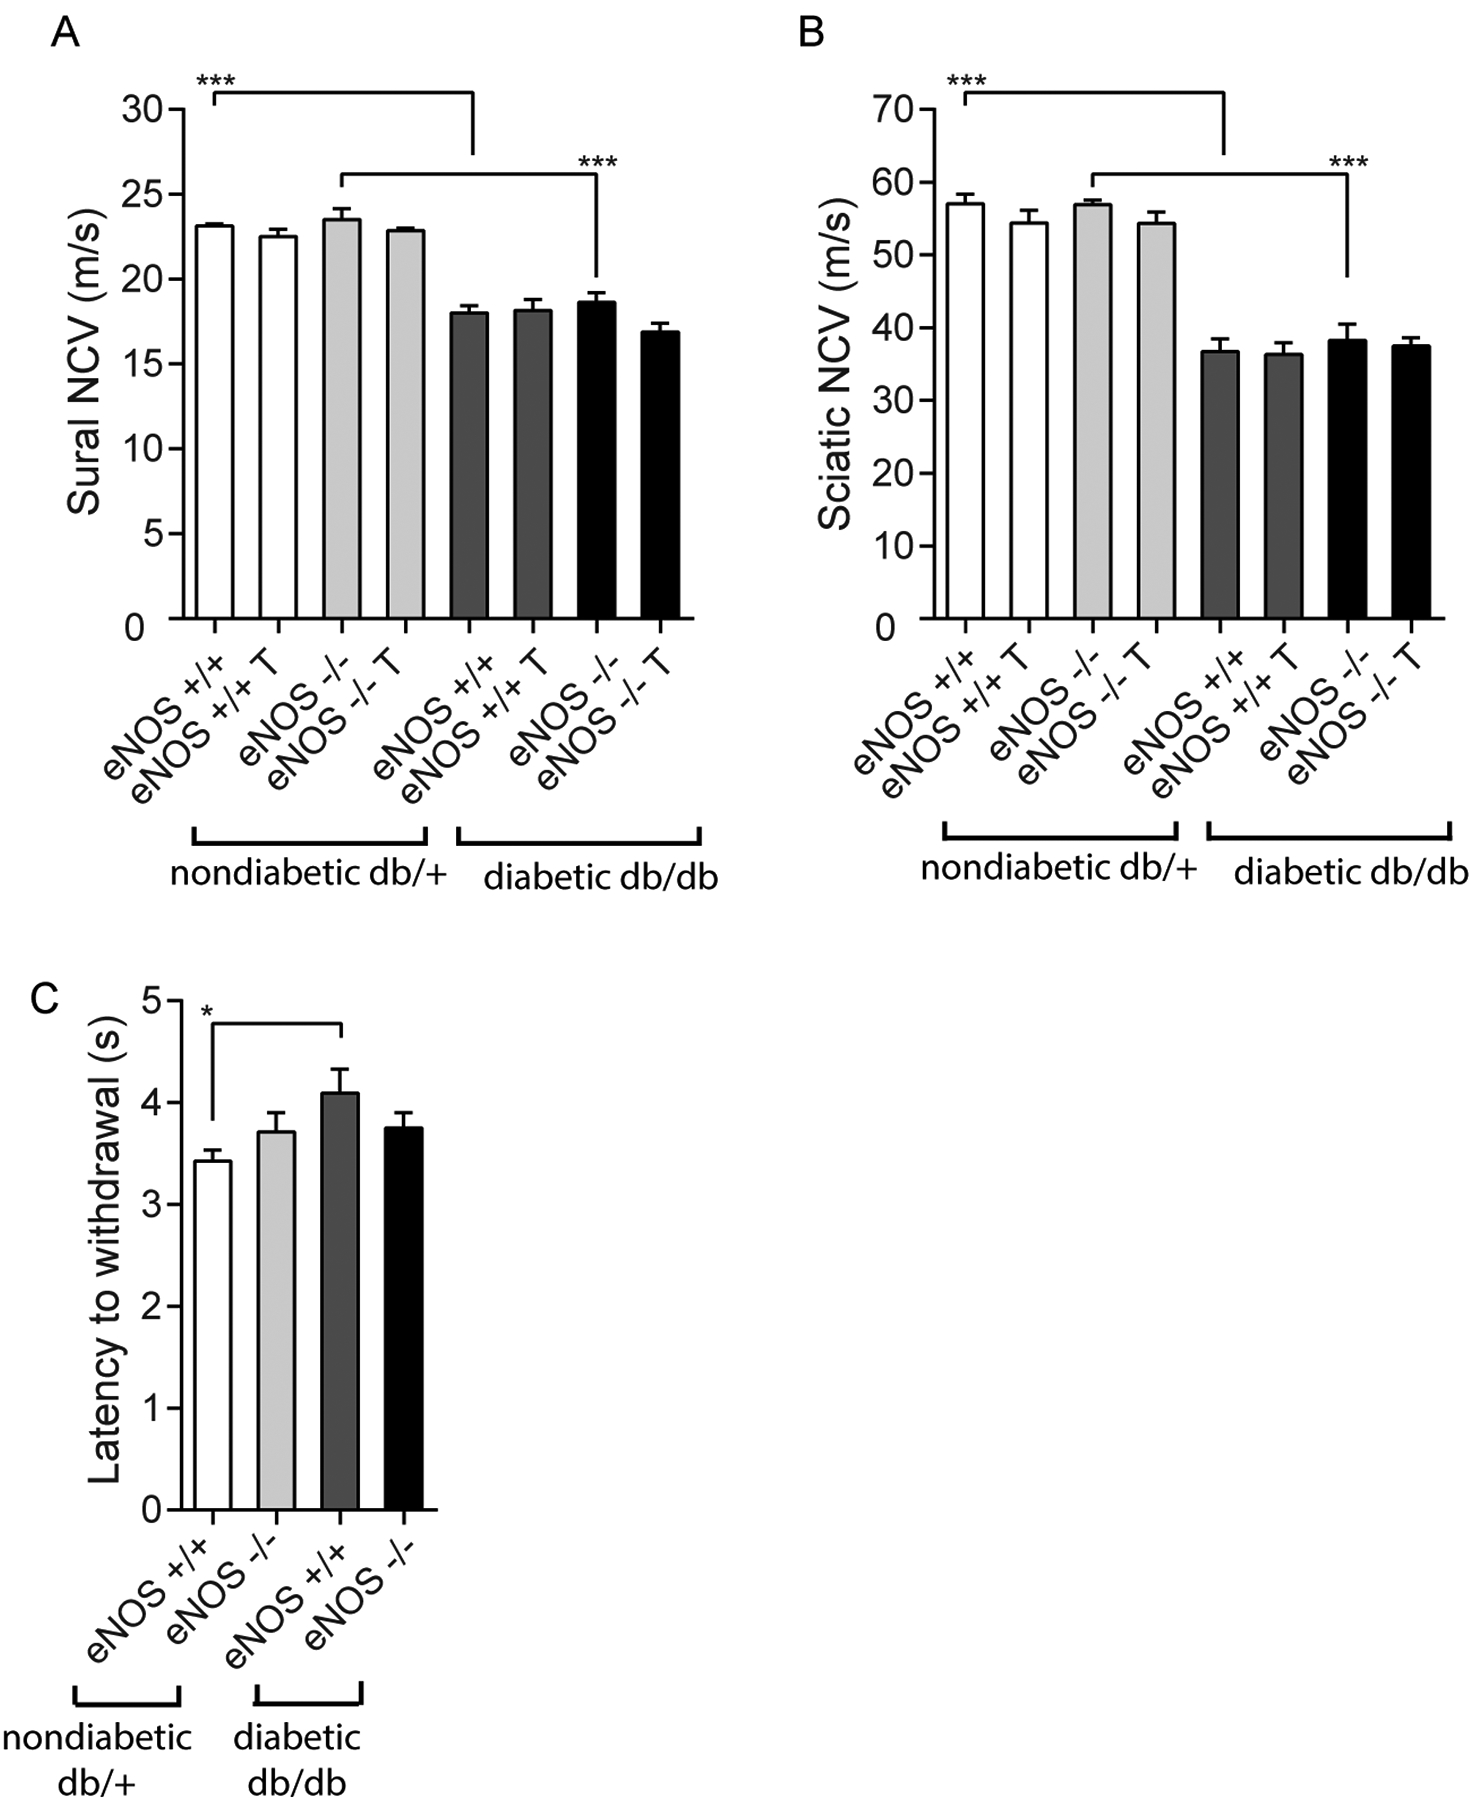
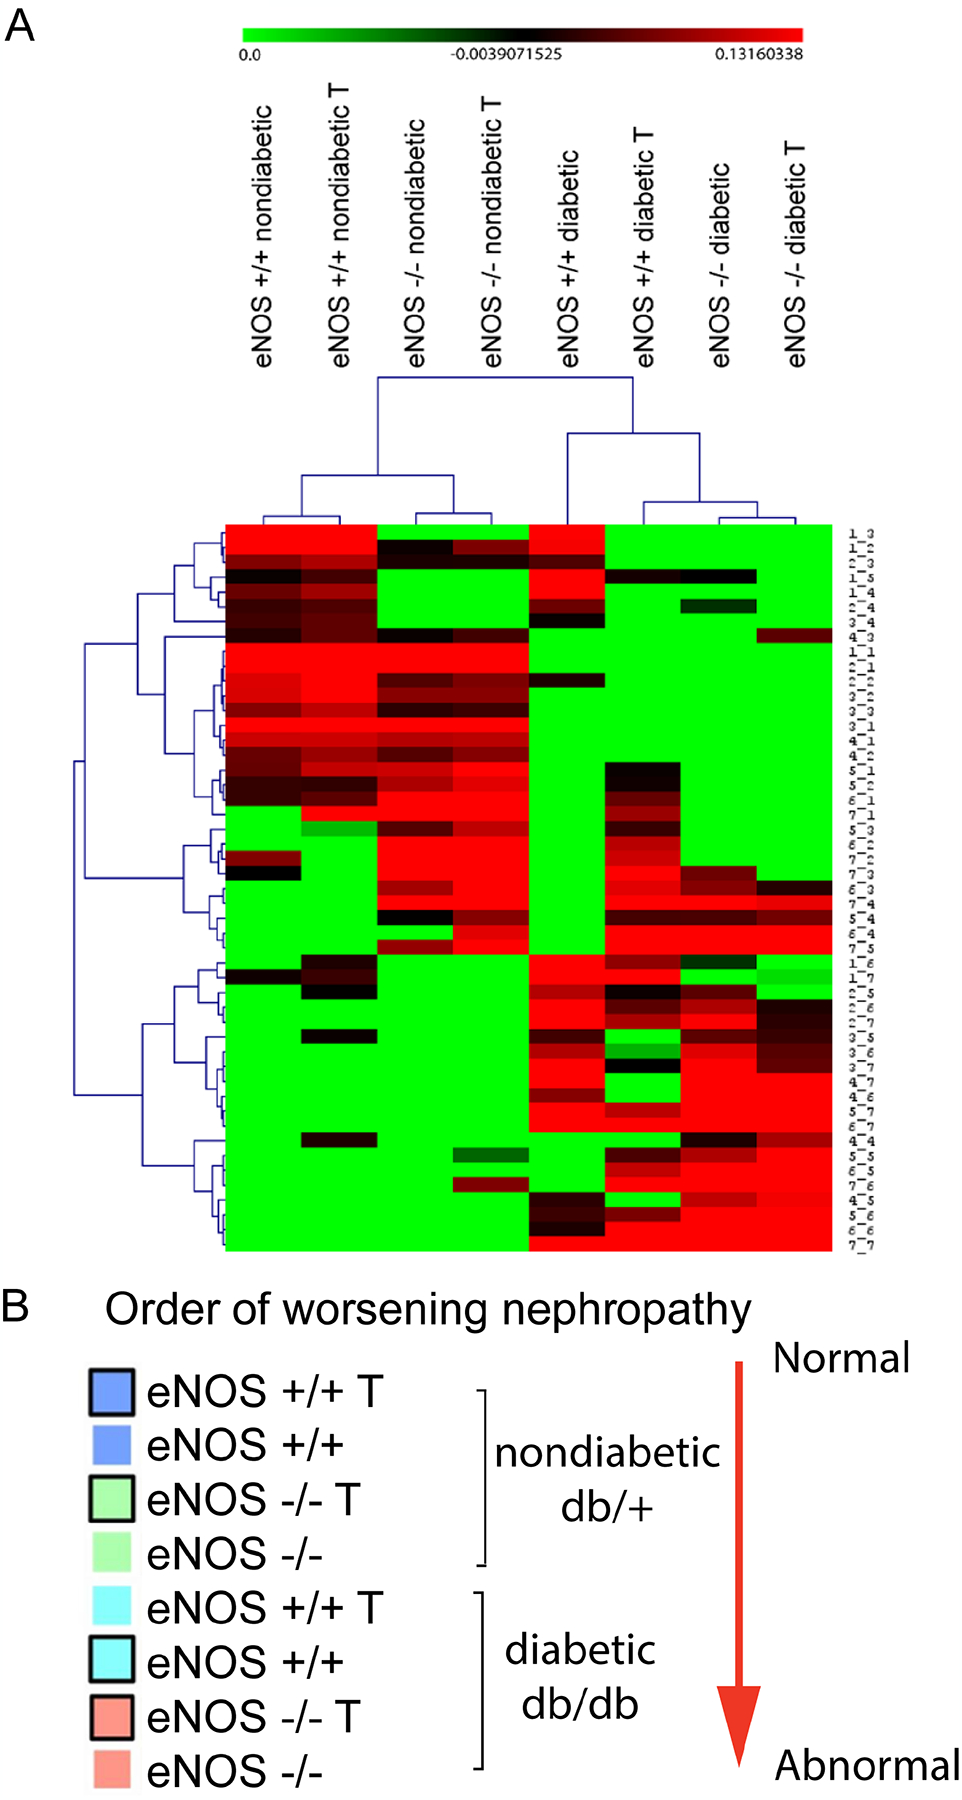
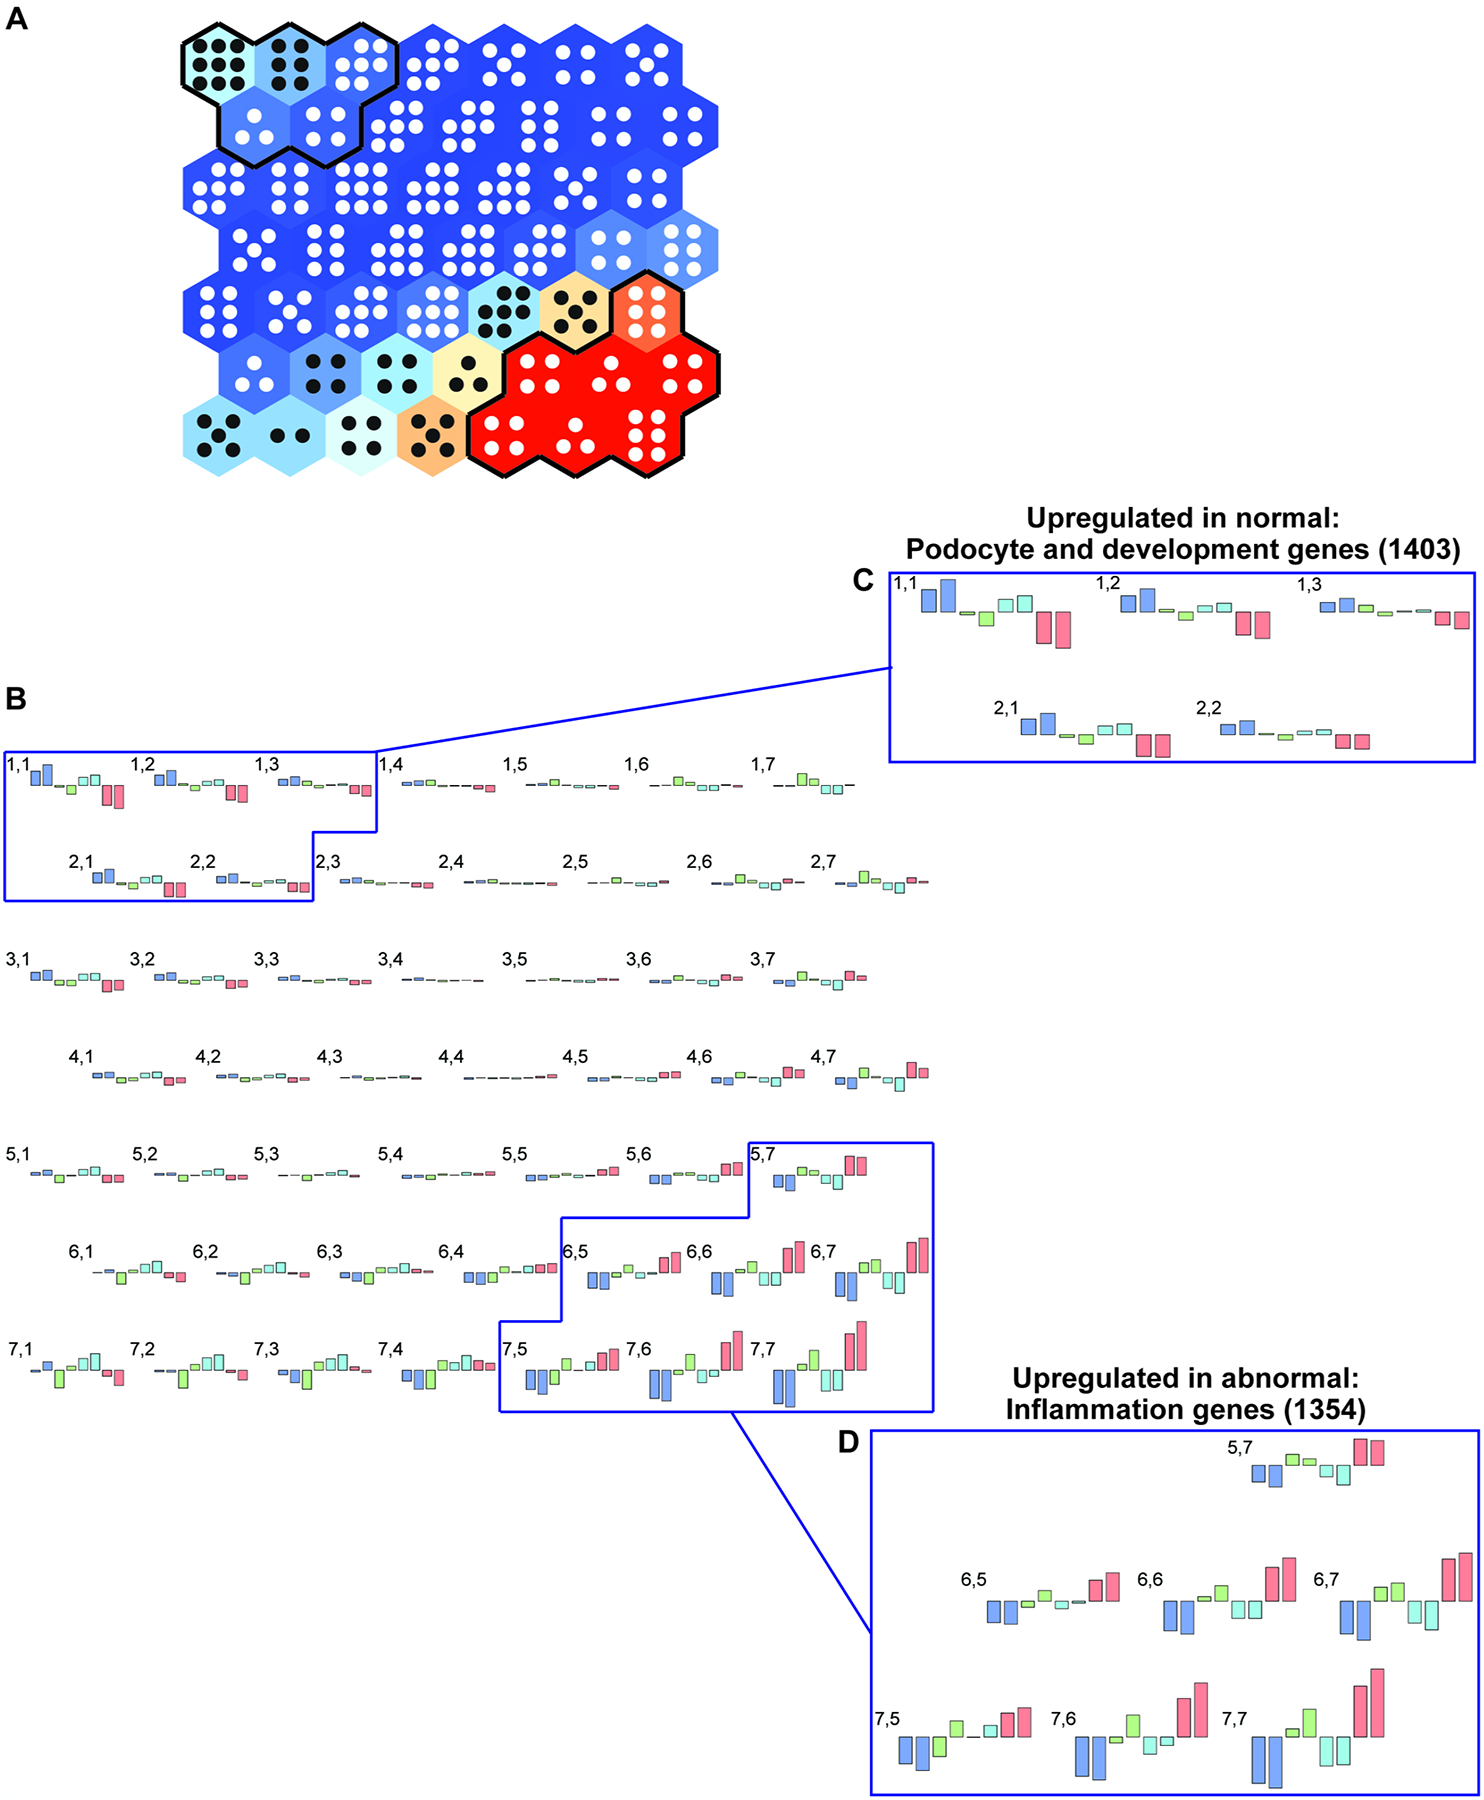
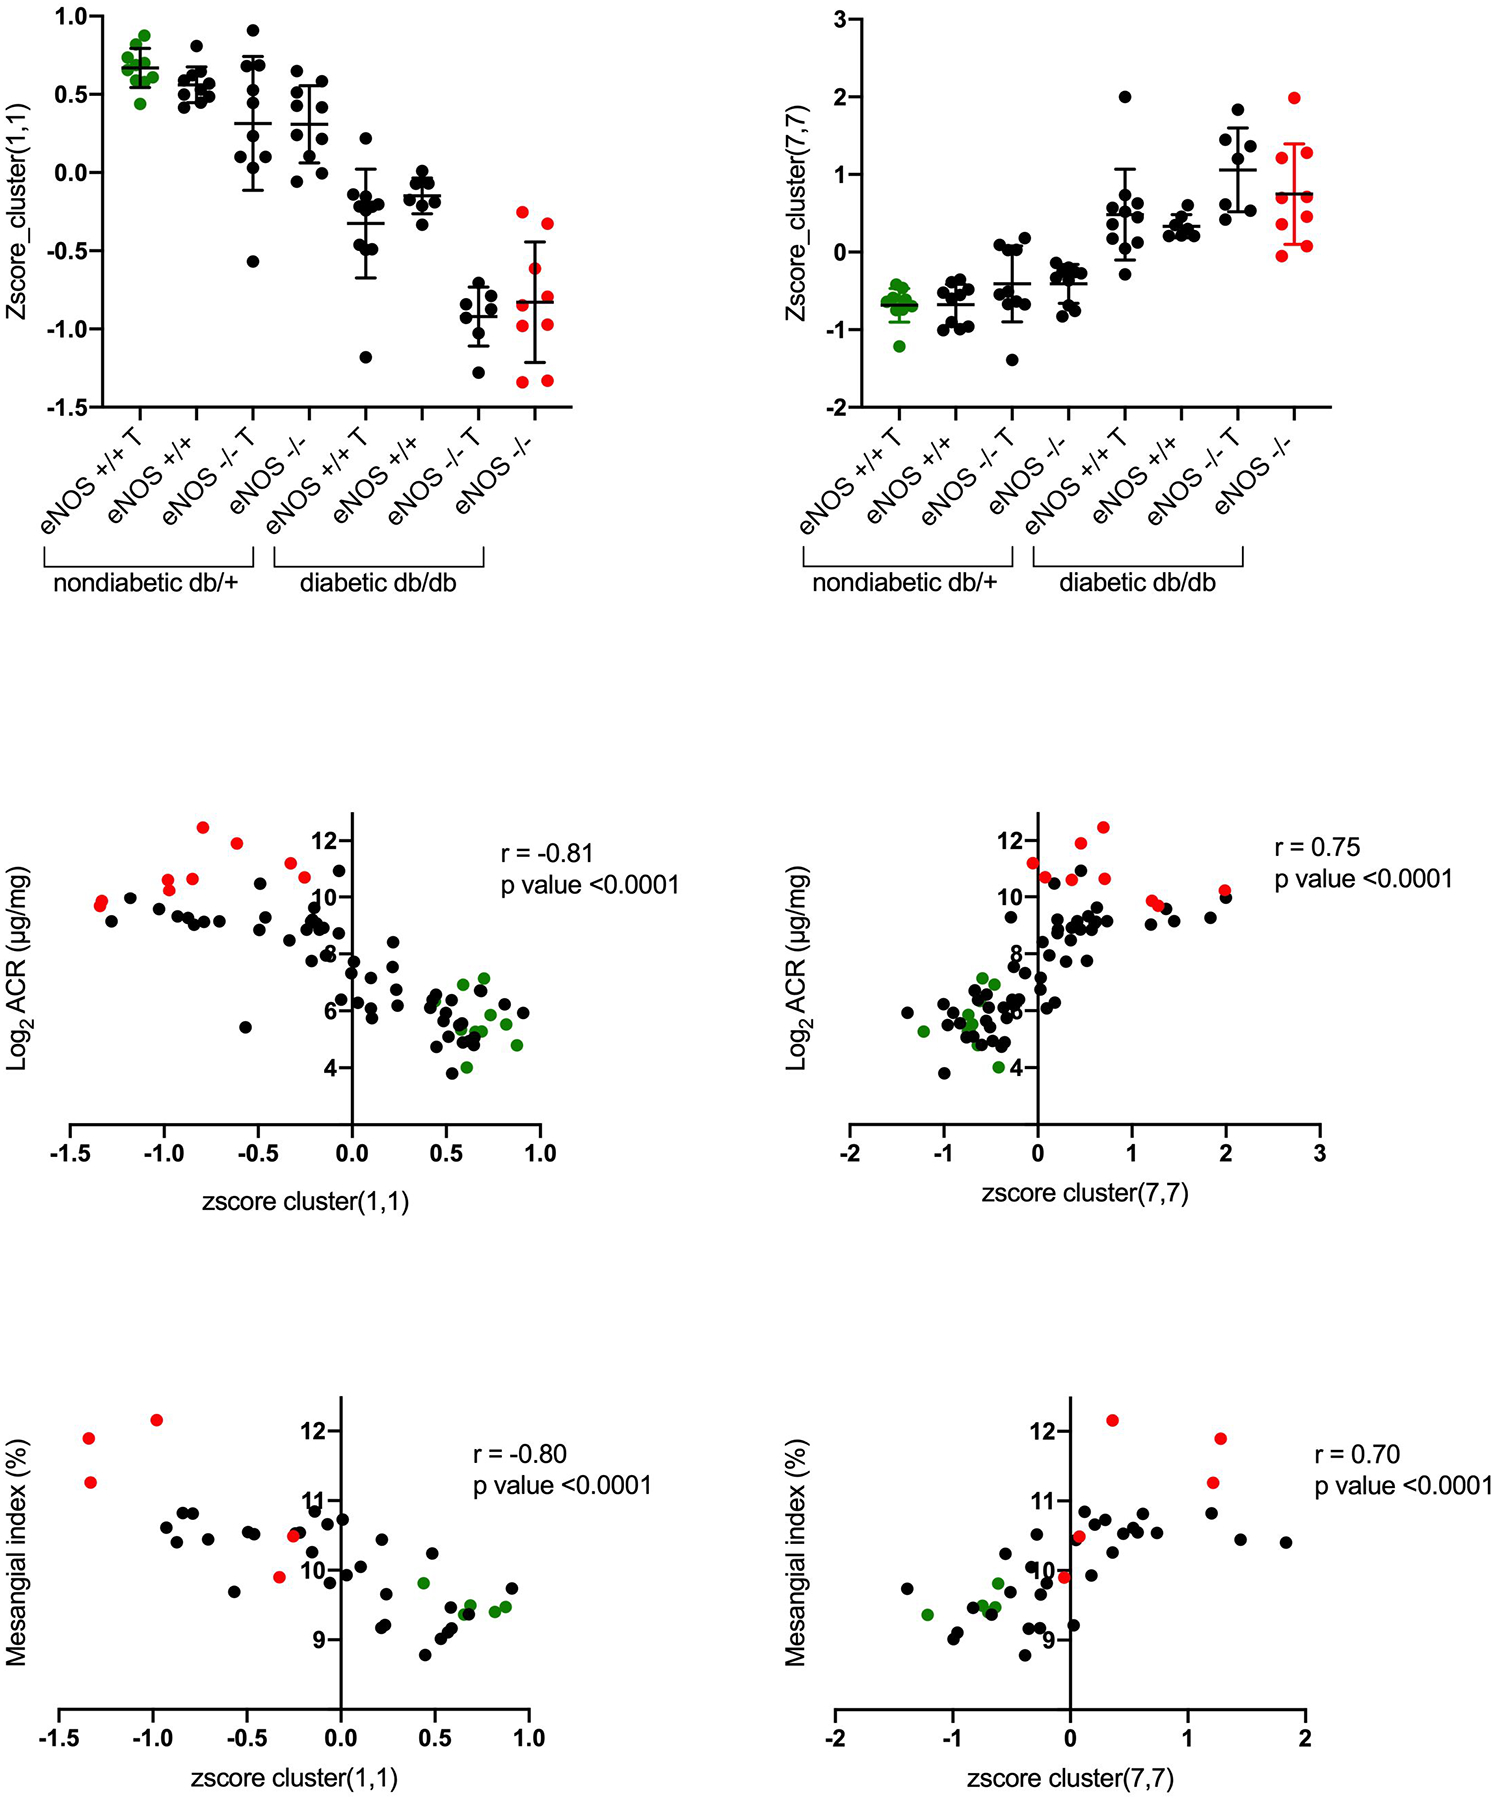
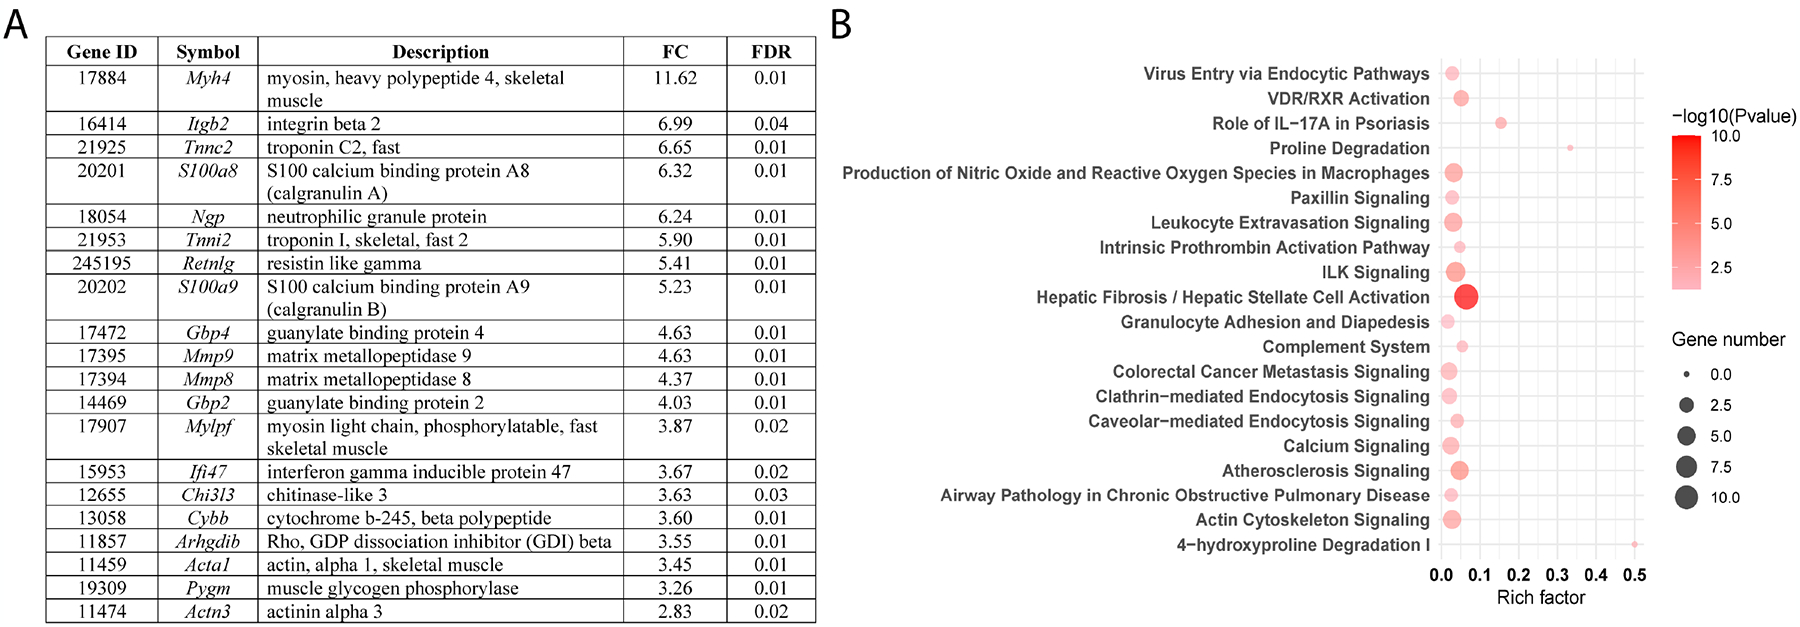
Diabetic kidney disease (DKD) and diabetic peripheral neuropathy (DPN) are two common diabetic complications. However, their pathogenesis remains elusive and current therapies are only modestly effective. We evaluated genome-wide expression to identify pathways involved in DKD and DPN progression in db/db eNOS-/- mice receiving renin-angiotensin-aldosterone system (RAS)-blocking drugs to mimic the current standard of care for DKD patients. Diabetes and eNOS deletion worsened DKD, which improved with RAS treatment. Diabetes also induced DPN, which was not affected by eNOS deletion or RAS blockade. Given the multiple factors affecting DKD and the graded differences in disease severity across mouse groups, an automatic data analysis method, SOM, or self-organizing map was used to elucidate glomerular transcriptional changes associated with DKD, whereas pairwise bioinformatic analysis was used for DPN. These analyses revealed that enhanced gene expression in several pro-inflammatory networks and reduced expression of development genes correlated with worsening DKD. Although RAS treatment ameliorated the nephropathy phenotype, it did not alter the more abnormal gene expression changes in kidney. Moreover, RAS exacerbated expression of genes related to inflammation and oxidant generation in peripheral nerves. The graded increase in inflammatory gene expression and decrease in development gene expression with DKD progression underline the potentially important role of these pathways in DKD pathogenesis. Since RAS blockers worsened this gene expression pattern in both DKD and DPN, it may partly explain the inadequate therapeutic efficacy of such blockers.

Keywords: RAS blockade; diabetic kidney disease; diabetic peripheral neuropathy; genome-wide expression; self-organizing map.


Conflict of interest statement

Conflict of Interest

The authors have stated explicitly that there are no conflicts of interest in connection with this article.

Figures

Figure 1.
Figure 1.
Diabetic kidney disease (DKD) phenotype for the 8 experimental groups to demonstrate both the separate and combined effects of diabetes status (db/db) and eNOS deletion. Urine volume (panel A), albuminuria (panel B), and mesangial expansion as quantified by mesangial index (panel C) increased by diabetes alone, but not by eNOS deletion alone. Albuminuria, mesangial index, and the percentage of totally sclerosed glomeruli increased in db/db eNOS−/− compared to db/db eNOS+/+ animals (panels B-D). There were only occasional sclerosed glomeruli in the nondiabetic groups (up to a maximum of 2.2% in the eNOS−/− nondiabetic mice; not shown) so these were not included in the analysis. RAS inhibitor treatment significantly ameliorated both albuminuria and mesangial expansion in the db/db eNOS−/− animals. *p < 0.05, ***p < 0.001. T, indicates RAS inhibitor treatment.
Figure 2.
Figure 2.
Diabetic peripheral neuropathy (DPN) phenotype for the 8 experimental groups to demonstrate the effects of diabetes and eNOS deletion. Sural (Panel A) and sciatic (Panel B) nerve conduction velocities (NCVs) decreased in db/db animals, but were not influenced by either eNOS deletion or RAS inhibitor treatment. Similarly, latency to withdrawal of hind paw (Panel C) was modestly increased in diabetes but was not clearly affected by eNOS deletion *p < 0.05, ***p < 0.001. T, indicates RAS inhibitor treatment.
Figure 3.
Figure 3.
Hierarchical clustering of the 8 experimental groups based on genome-wide changes in glomerular gene expression (Panel A). This clustering placed the mice in an order that generally corresponded to DKD severity based on functional and pathologic features (Panel B). The same color code used in panel B to differentiate the different experimental groups is later used for Fig. 4, panel B. One unexpected aspect of the hierarchical clustering is that RAS inhibitor treatment was associated with glomerular gene expression changes that were generally correlated with increasing, not decreasing, DKD severity. The hierarchical clustering suggested that diabetes (db/db) has a major effect on gene expression, whereas eNOS deletion exerted minor effect in the same direction. T, indicates RAS inhibitor treatment.
Figure 4.
Figure 4.
Self-organizing map (SOM) (panel A) for glomerular gene expression changes in the 8 experimental groups to demonstrate the response to diabetes (db/db), eNOS knockout, and RAS inhibition. All gene expression patterns were projected onto a 7 × 7 module (panel A). Each module (hexagon) contains genes with similar expression patterns across the groups (panel B). Hierarchical cluster analysis of the SOM (see Fig. 3) orders the groups as shown in panel B and serves as its legend. Gene expression patterns for each of the 49 modules are depicted in panel B, where numbers correspond to the hexagons from panel A, with 1,1 representing the upper left hexagon and 7,7 the lower right hexagon. Colors and outlines of gene expression changes in each module correspond to the legend in Fig. 3, panel B. Units with similar gene expression patterns that show ordered increases or decreases across the 8 groups are indicated in insets C and D. A total of 1403 genes were identified whose gene expression pattern correlated positively with more normal, undiseased phenotypes (inset C), while expression of 1354 genes correlated positively with more abnormal, diseased phenotypes (inset D). These gene groups were used for further analysis (see Fig. 5).
Figure 5.
Figure 5.
The correlation between albuminuria and mesangial index was determined with the genes for the most extreme and informative modules (1,1 and 7,7 on the SOM upper left and lower right corners, respectively [Fig. 4]). The top panel shows the aggregate gene expression values in modules 1,1 and 7, 7 for each animal. Correlation between the aggregate gene expression values (from modules 1,1 or 7,7) and albuminuria (middle panel) and mesangial index (bottom panel). For all panels, the green points represent the aggregate gene expression for the most “normal” animal group (db/+ eNOS +/+ treated), while the red points represent the gene expression for the most “diseased” animal group (db/db eNOS −/− untreated). T, indicates RAS inhibitor treatment.
Figure 6.
Figure 6.
Transcriptomics data analysis of dorsal root ganglia (DRG) tissue collected from db/db eNOS −/− animals with or without RAS blockade indicated that treatment enhanced expression of several genes involved in DPN pathogenesis. The top 20 differentially expressed genes (DEGs) in DRG from db/db eNOS −/− treated vs. untreated mice are listed in panel A. Functional enrichment analysis of DEGs was performed by IPA, and the 20 most significantly enriched canonical pathways are illustrated in dot plots (panel B). Rich factor refers to the proportion of DEGs belonging to a specific IPA term. Node size (gene number) refers to the number of DEGs within each term, while node color indicates significance level (−log10 p-value). FC, fold-change; FDR, false discovery rate.

Similar articles

Cited by

References

    1. Saran R, Robinson B, Abbott KC, Agodoa LYC, Bragg-Gresham J, Balkrishnan R, Bhave N, Dietrich X, Ding Z, Eggers PW, Gaipov A, Gillen D, Gipson D, Gu H, Guro P, Haggerty D, Han Y, He K, Herman W, Heung M, Hirth RA, Hsiung JT, Hutton D, Inoue A, Jacobsen SJ, Jin Y, Kalantar-Zadeh K, Kapke A, Kleine CE, Kovesdy CP, Krueter W, Kurtz V, Li Y, Liu S, Marroquin MV, McCullough K, Molnar MZ, Modi Z, Montez-Rath M, Moradi H, Morgenstern H, Mukhopadhyay P, Nallamothu B, Nguyen DV, Norris KC, O’Hare AM, Obi Y, Park C, Pearson J, Pisoni R, Potukuchi PK, Repeck K, Rhee CM, Schaubel DE, Schrager J, Selewski DT, Shamraj R, Shaw SF, Shi JM, Shieu M, Sim JJ, Soohoo M, Steffick D, Streja E, Sumida K, Kurella Tamura M, Tilea A, Turf M, Wang D, Weng W, Woodside KJ, Wyncott A, Xiang J, Xin X, Yin M, You AS, Zhang X, Zhou H, and Shahinian V (2019) US Renal Data System 2018 Annual Data Report: Epidemiology of Kidney Disease in the United States. Am J Kidney Dis 73, A7–A8 - PMC - PubMed
    1. Leoncini G, Viazzi F, De Cosmo S, Russo G, Fioretto P, and Pontremoli R (2020) Blood pressure reduction and RAAS inhibition in diabetic kidney disease: therapeutic potentials and limitations. J Nephrol - PMC - PubMed
    1. Feldman EL, Callaghan BC, Pop-Busui R, Zochodne DW, Wright DE, Bennett DL, Bril V, Russell JW, and Viswanathan V (2019) Diabetic neuropathy. Nat Rev Dis Primers 5, 41. - PubMed
    1. Callaghan BC, Price RS, and Feldman EL (2020) Distal Symmetric Polyneuropathy in 2020. JAMA 324, 90–91 - PubMed
    1. Juster-Switlyk K, and Smith AG (2016) Updates in diabetic peripheral neuropathy. F1000Res 5 - PMC - PubMed

Publication types

MeSH terms