. 2021 May 5;109(9):1449-1464.e13.
doi: 10.1016/j.neuron.2021.03.011. Epub 2021 Mar 30.

Enhancer viruses for combinatorial cell-subclass-specific labeling

Affiliations

Enhancer viruses for combinatorial cell-subclass-specific labeling

Lucas T Graybuck et al. Neuron. .

Abstract

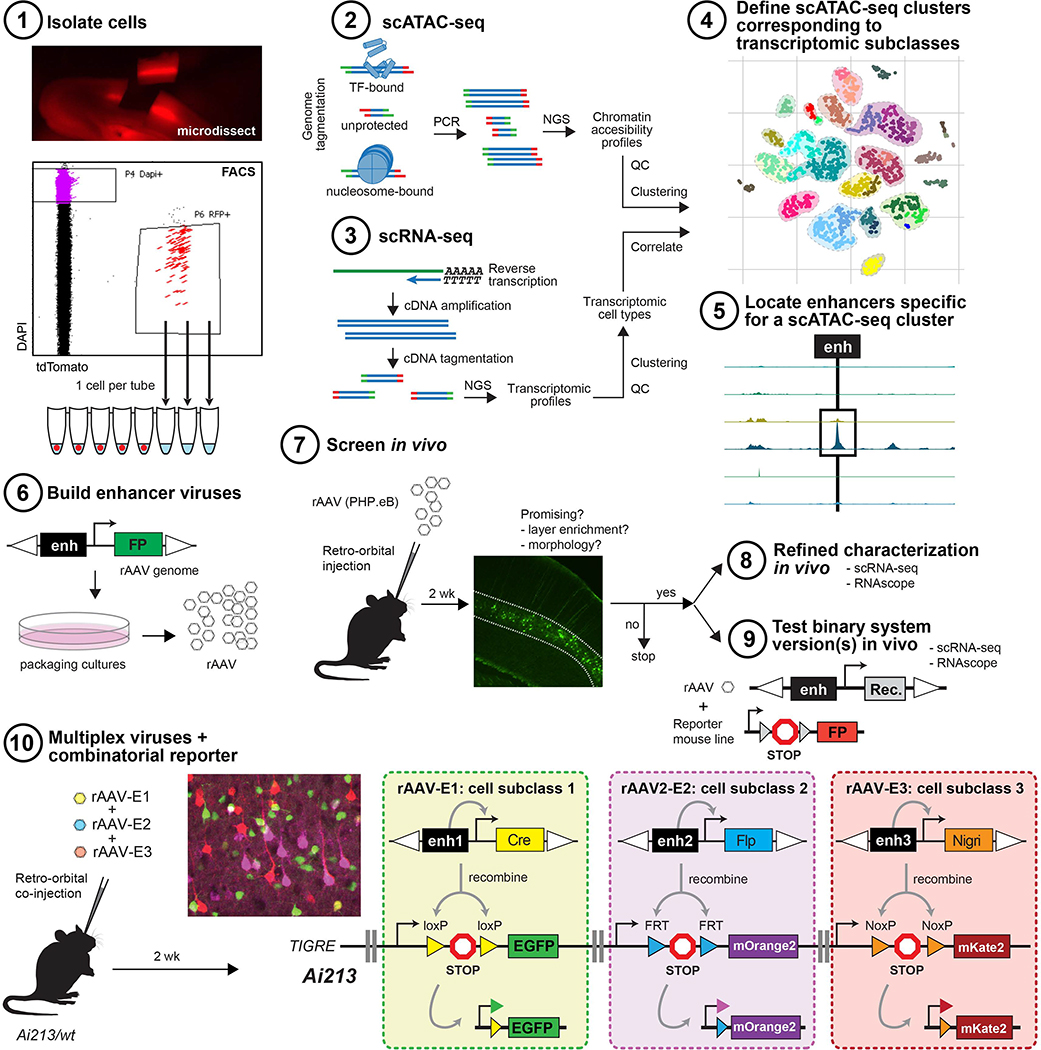
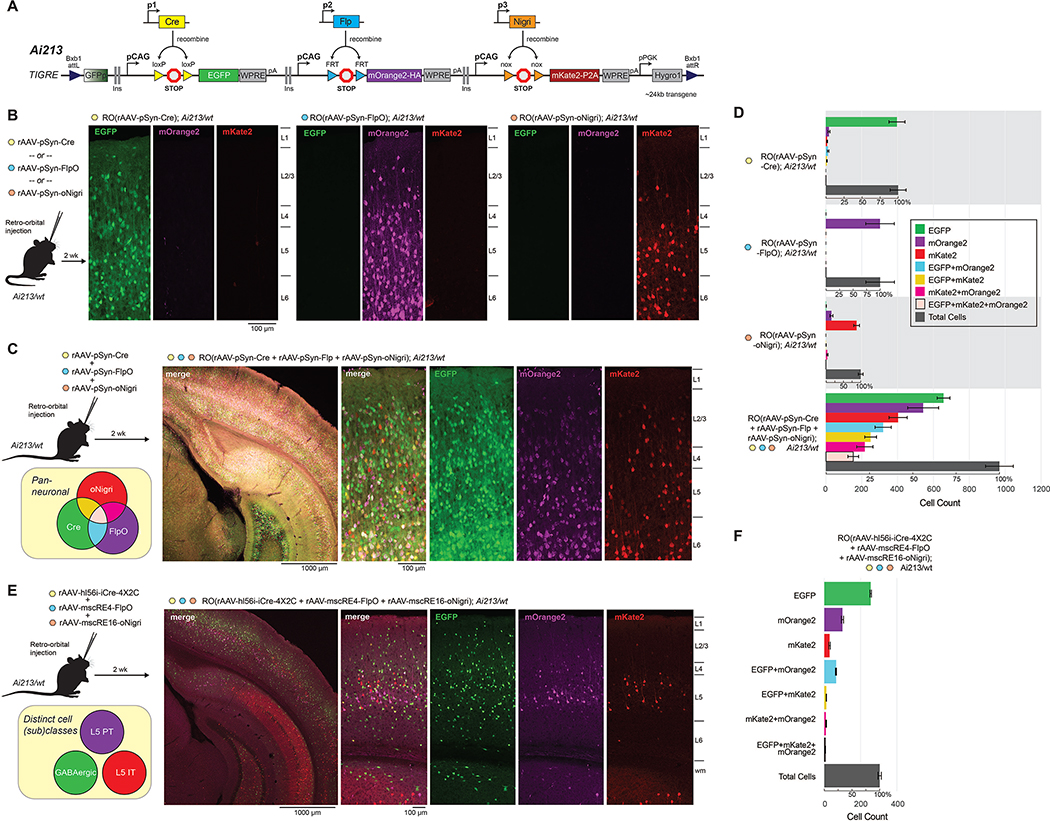
Rapid cell type identification by new genomic single-cell analysis methods has not been met with efficient experimental access to these cell types. To facilitate access to specific neural populations in mouse cortex, we collected chromatin accessibility data from individual cells and identified enhancers specific for cell subclasses and types. When cloned into recombinant adeno-associated viruses (AAVs) and delivered to the brain, these enhancers drive transgene expression in specific cortical cell subclasses. We extensively characterized several enhancer AAVs to show that they label different projection neuron subclasses as well as a homologous neuron subclass in human cortical slices. We also show how coupling enhancer viruses expressing recombinases to a newly generated transgenic mouse, Ai213, enables strong labeling of three different neuronal classes/subclasses in the brain of a single transgenic animal. This approach combines unprecedented flexibility with specificity for investigation of cell types in the mouse brain and beyond.

Keywords: AAV; ATAC-seq; cell types; cortex; enhancer; recombinase; transgenic mouse.


Conflict of interest statement

Declaration of interests L.T.G., T.L.D., J.T.T., J.K.M., B.P.L., E.L., B.K., H.Z., and B.T. are inventors on several U.S. provisional patent applications related to this work. All authors declare no other competing interests.

Figures

Figure 1.
Figure 1.. Overview of enhancer discovery for viral tool development.
1–4) To build cell type-specific labeling tools, we isolated cells from adult mouse cortex, performed scATAC-seq, clustered the samples, and compared them to scRNA-seq datasets to assign identity to the scATAC-seq clusters and cells. 5–8) Putative enhancers differentially accessible in scATAC-seq clusters were identified, cloned into recombinant AAVs and screened for desired expression patterns. 8–9) Promising viruses were further evaluated by scRNA-seq, RNAscope, and/or in binary expression systems. 10) Three enhancer viruses were delivered to an Ai213 transgenic animal to label three distinct cell types in a single animal.
Figure 2.
Figure 2.. Identification of cell classes, subclasses, and types in scATAC-seq data by correlation with scRNA-seq.
(A) For scATAC-seq analysis, we retained samples with >10,000 uniquely mapped fragments (QC1) that overlapped ENCODE whole-cortex DNase-seq peaks with >25% of fragments (QC2), and which had nucleosomal structure identified by >10% of all aligned fragments with an insert size >250bp (QC3). (B) Samples were down-sampled to 10,000 unique fragments, which were extended to 1 kb, and overlaps were merged for comparison between samples using a Jaccard distance. Distances were used as input for t-SNE projection. (C) Samples were clustered in t-SNE space using RPhenograph clustering. Cells from each cluster were pooled and fragments within 20 kb of each TSS were counted. Marker genes for transcriptomic clusters from Tasic et al. (Tasic et al., 2018) were correlated between ATAC TSS counts and log-transformed gene expression. Each ATAC cluster was assigned identity based on its best-correlated transcriptomic cluster. (D) t-SNE as in (C) labeled according to cell source. (E–H) Native fluorescence images of live coronal brain sections of Ai14 reporter mice retrogradely injected by CAV-Cre into various brain locations. (E) Left: full hemisphere with injection site (RT, reticular nucleus of thalamus). Right, VISp containing retrogradely labeled cells collected for scRNA-seq. (F) As in (E) for a superior colliculus (SC) retrograde injection. (G) t-SNE of scATAC-seq samples colored according to source: Rbp4-Cre (Rbp4, blue); retro-RT (orange), retro-SC (red). (H) As in (E) for a VISp-contralateral (VISp-c) retrograde injection. One hemisphere was injected (left), and cells were collected only from the opposite hemisphere (right). Asterisk, tissue lost in sectioning. Right: closer view of collection site. (I) t-SNE of samples colored to highlight cells collected from Cux2-CreERT2 (Cux2, green) and retrograde labeling from VISp-c (purple).
Figure 3.
Figure 3.. Example mscREs.
Chromatin accessibility in clusters on the basis of single-cell ATAC-seq data for select genomic regions containing (A) mscRE4, (B) mscRE16, (C) mscRE10, and (D) mscRE13. The nearby gene, which is the likely target of each enhancer (shaded), with the transcription start site (TSS) and the direction of transcription designated by a small arrow. The distance between each TSS and mscRE is indicated by a dashed line with a large arrow. For a complete set of mscREs examined in this study, see Figure S3C.
Figure 4.
Figure 4.. Direct fluorophore labeling of L5 PT neurons by enhancer viruses.
(A) Experimental workflow for testing the enhancer virus containing a putative Fam84b enhancer, mscRE4, in a self-complementary AAV backbone (scAAV) with a beta-globin minimal promoter (pBGmin) driving SYFP2. WPRE3: short woodchuck hepatitis virus posttranscriptional regulatory element; pA: polyadenylation site. (B) Live tissue section (250 μm-thick) imaged on a dissecting microscope shows fluorescently labeled cells in L5. (C) L5 was dissected and analyzed by scRNA-seq (n = 219 cells from n = 2 animals were mapped to the Tasic et al. (Tasic et al., 2018) cell type reference). ~92% mapped to L5 PT cell types. (D) scATAC-seq samples in a t-SNE projection with subclass and type labels for reference – same as in rightmost panel in Figure 2C, included here for ease of comparison. (E) Cells in (D), highlighting samples collected for mscRE4-SYFP2, VISp L5 dissection, and FACS (n = 61 QC-qualified cells from n = 1 animal; 90% of cells cluster with L5 PT subclass). (F) Electrophysiological characterization of cells in cortical slices from animals in (A). Left: Example voltage responses to a series of hyperpolarizing and depolarizing current injections for a YFP(+) neuron from VISp and unlabeled PT-like and IT-like neurons from somatosensory cortex. Middle: Example impedance amplitude (Z) for same neurons including a nearby YFP(−) neuron in VISp. Right: Resonance frequency (fR) plotted as a function of input resistance (RN, right) for same neurons. (G) Input resistance (RN), sag ratio, and resonance frequency (fR) for the four neuronal groups in (F). (H) Schematics of viral genomes constructed to evaluate concatenation of mscRE4. A CMV minimal promoter and a non-self-complementary AAV backbone was used. Center, Tn5 transposon footprinting of the genomic region including mscRE4 (blue bars). The Core-mscRE4 subregion (orange bars) was selected based on differential accessibility in L5 PT scATAC-seq cluster (green) vs. non-L5 PT scATAC-seq samples (gray) and conservation (PhastCons scaled between 0–1 (black)). Accessibility tracks are scaled to Footprints per Million Reads (FpPM). (I) Native fluorescence imaged with identical settings in VISp of labeling by titer-matched mscRE4-pCMVmin-SYFP2 and the 3xCore-mscRE4-pCMVmin-SYFP2 viruses delivered by RO injections three weeks earlier. (J) RNAscope analysis workflow performed after experimental workflow in (A) but on 20 μm-sections (detailed in STAR Methods). (K) In-tissue positions of cells labeled by RNAscope from an animal RO injected with mscRE4-pCMVmin-SYFP2. Black dashed lines indicate the calculated L5 boundaries based on Fam84b expression. Each spot is a single cell: gray, unlabeled; SYFP2+ only (brown); Fam84b+ only (magenta); Rorb+ only (yellow); SYFP2+ and Fam84b+ (green); SYFP2+ and Rorb+ (dark blue); Fam84b+ and Rorb+ (orange). (L) Data from (K) plotted as cell counts (top) relative to pia for cells positive for each combination of probes (below the plot). Cell counts for the full cortical depth (FD) or restricted to L5 are provided above the plot. Completeness and specificity were calculated based on L5 counts. Points are jittered on the x-axis using quasirandom positioning. (M) Same as (K) but for 3xCore-mscRE4-pCMVmin-SYFP2 virus. (N) Data from (M) plotted as in (L).
Figure 5.
Figure 5.. Cell subclass labeling by enhancer-driven recombinase or transcription factor viruses.
(A) Schematics of enhancer-driven FlpO, dgCre, iCre, or tTA2 viruses. E: enhancer, pBGmin: minimal beta-globin promoter; WPRE: woodchuck hepatitis virus posttranscriptional regulatory element; pA: polyadenylation site. Viral genomes were packaged into PHP.eB-serotype rAAVs and RO injected into reporter mice. Images show native reporter fluorescence in VISp, 2–3 weeks post-injection. (B-E) Representative images of native reporter fluorescence from VISp in mice RO injected with indicated FlpO viruses (left). Lines indicate approximate layer boundaries. tdTomato+ cells from full cortical depth were collected by FACS for scRNA-seq, and their transcriptomic profiles were mapped to reference cell types from Tasic et al. (Tasic et al., 2018). (F-G) Representative RNAscope images from VISp of animals injected with mscRE4-FlpO or mscRE16-FlpO viruses probed for Fam84b, Rorb, and tdTomato expression. (H) Positions of individual cells (dots) relative to the pial surface from animal in (F) examined by RNAscope: unlabeled (gray); tdTomato+ only (magenta); Fam84b+ only (cyan); Rorb+ only (yellow); tdTomato+ and Fam84b+ (purple); tdTomato+ and Rorb+ (orange); Fam84b+ and Rorb+ (green). Cell counts and probe combinations are shown above and below, respectively, for whole cortical depth and L5 only (n = 1 brain slice analyzed per genotype/virus combination). Black dashed lines indicate calculated L5 boundaries based on Fam84b expression. Points are jittered on the x-axis using quasirandom positioning. (I) Same as in (H) for animal in (G).
Figure 6.
Figure 6.. Combinatorial cell subclass labeling.
(A) Schematic representation of strategy to label single- (red or green) or dual recombinase-expressing (yellow) cell types. (B) Representative native fluorescence images from an Ai65F;Ai140 dual-reporter mouse injected with mscRE16-FlpO and mscRE4-iCre viruses showing mostly mutually exclusive labeling in L5. White box = inset image (right). (C) Cell counts within each layer for all cortical regions containing EGFP and tdTomato cells.
Figure 7.
Figure 7.. Combinatorial cell (sub)class labeling with a new three-color reporter line, Ai213.
(A) Schematic representation of the Ai213 reporter transgene in the TIGRE locus. mOrange2 and mKate2 were tagged with the HA and P2A epitopes, respectively. (B,C) Ai213 heterozygous mice were RO-injected with either pSyn-Cre (B, left panel), pSyn-FlpO (B, middle panel), or pSyn-oNigri (B, right panel) viruses or all three viruses in combination (C); 1×10¹¹ genome copies (GCs) per each virus. Native reporter fluorescence was imaged with the same instrument settings in VISp. (D) Numbers of cells labeled with specified fluorophores in VISp from genotypes and viruses indicated on the left from images in (B) and (C). EGFP counts represent all cells expressing EGFP including double and triple positive cells; same applies to counts for other fluorophore labels. Data are expressed as mean cell counts ± S.E.M (n ≥ 2 images per n = 3 mice per group). Second scale for % total cells labeled is provided. (E) Ai213 heterozygous mice were RO-injected with a mixture of the hl56i-iCre-4X2C (pan-GABAergic), mscRE4-FlpO (L5 PT), and mscRE16-oNigri (L5 IT) viruses with 1×10¹¹ GCs per each virus. Native reporter fluorescence was imaged in VlSp. (F) The number of labeled cells for each fluorophore was quantified as in (D) for n = 2 images per n = 3 mice.
Figure 8.
Figure 8.. mscRE4-based virus labels L5 PT neurons in human middle temporal gyrus.
(A) mscRE4-Cre enhancer virus in combination with a conditional reporter virus drives fluorescent protein expression in human MTG. EGFP+ neurons were targeted for Patch-seq/standard patch-clamp experiments. (B) Biocytin fills of two double labeled neurons in human MTG. (C) Example voltage responses to a chirp stimulus for an EGFP+ neuron and a non-labeled EGFP- L5 pyramidal neuron. (D) Impedance amplitude profiles for the neurons in (C). (E) Voltage response to a suprathreshold depolarizing current injection and hyperpolarizing current injection for the neurons in (C). (F) Resonance frequency as a function of input resistance. (G) Representative EGFP-labeled neuron mapped to a putative PT transcriptomic cell type while the non-labeled neuron mapped to a L6 IT transcriptomic cell type.

References

    1. Adler D, Murdoch D, et al. (2018). rgl: 3D Visualization Using OpenGL.
    1. Arnold CD, Gerlach C, Stelzer C, Boryri LM, Rath M, and Stark A (2013). Genome-Wide Quantitative Enhancer Activity Maps Identified by STARR-seq. Science 339, 1074–1077. - PubMed
    1. Attali D, and Baker C (2019). ggExtra: Add Marginal Histograms to “ggplot2”, and More “ggplot2” Enhancements.
    1. Attanasio C, Nord AS, Zhu Y, Blow MJ, Li Z, Liberton DK, Morrison H, Plajzer-Frick I, Holt A, Hosseini R, et al. (2013). Fine tuning of craniofacial morphology by distant-acting enhancers. Science 342, 1241006. - PMC - PubMed
    1. Baker A, Kalmbach B, Morishima M, Kim J, Juavinett A, Li N, and Dembrow N (2018). Specialized Subpopulations of Deep-Layer Pyramidal Neurons in the Neocortex: Bridging Cellular Properties to Functional Consequences. J Neurosci 38, 5441–5455. - PMC - PubMed

Publication types