. 2021 Apr 13;54(4):702-720.e17.
doi: 10.1016/j.immuni.2021.03.007. Epub 2021 Mar 30.

Single-cell chromatin accessibility landscape identifies tissue repair program in human regulatory T cells

Affiliations

Single-cell chromatin accessibility landscape identifies tissue repair program in human regulatory T cells

Michael Delacher et al. Immunity. .

Abstract

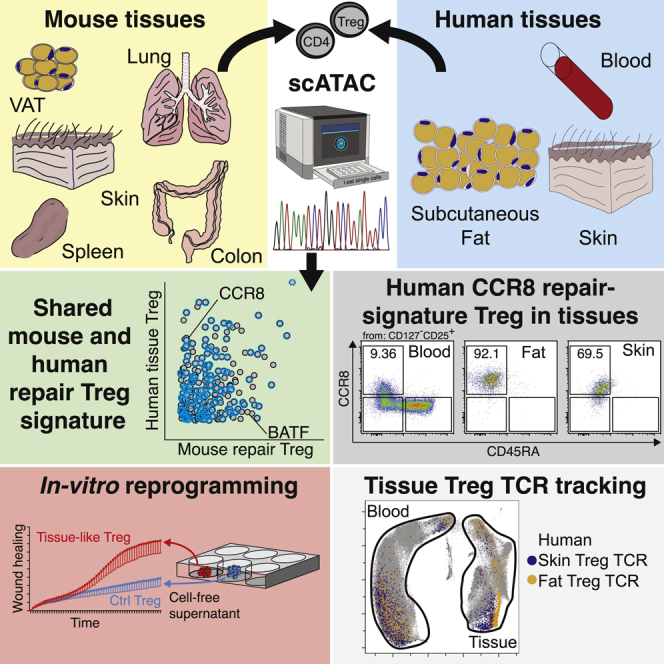
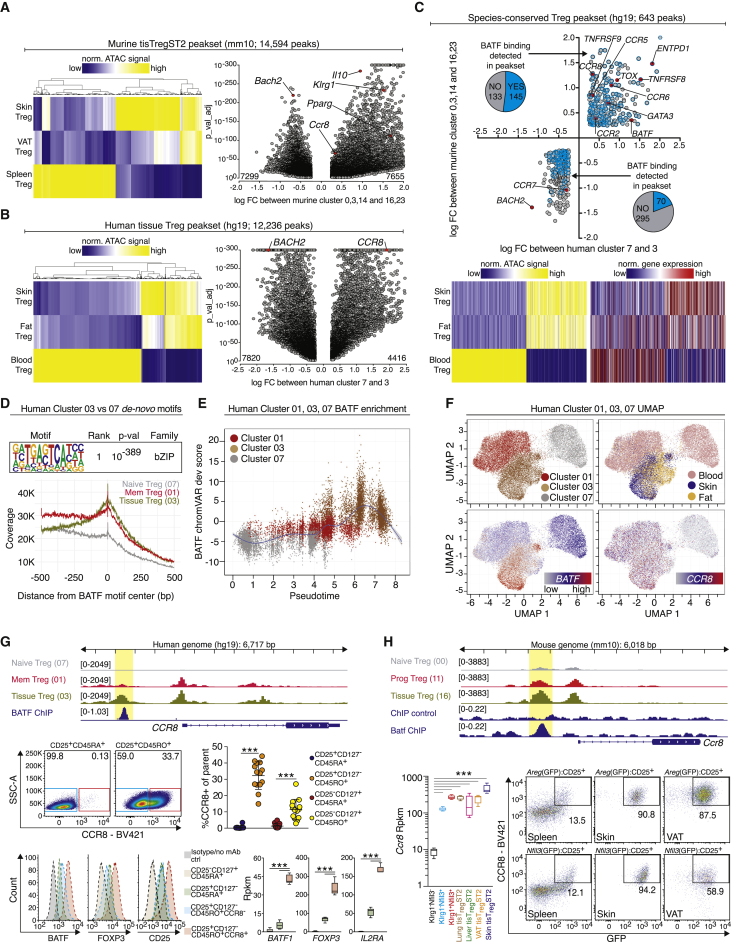
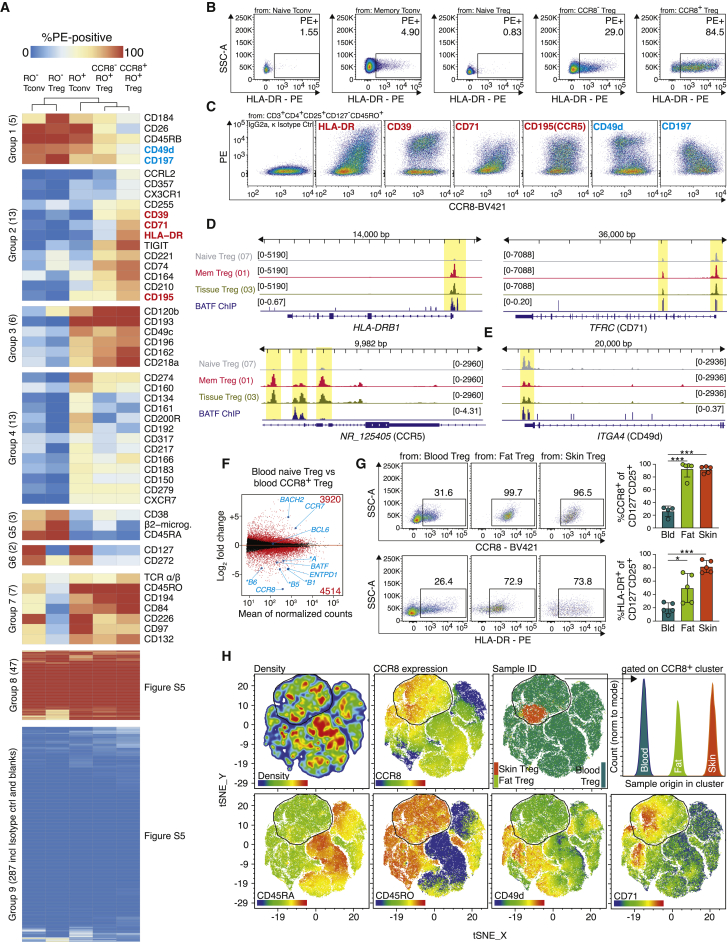
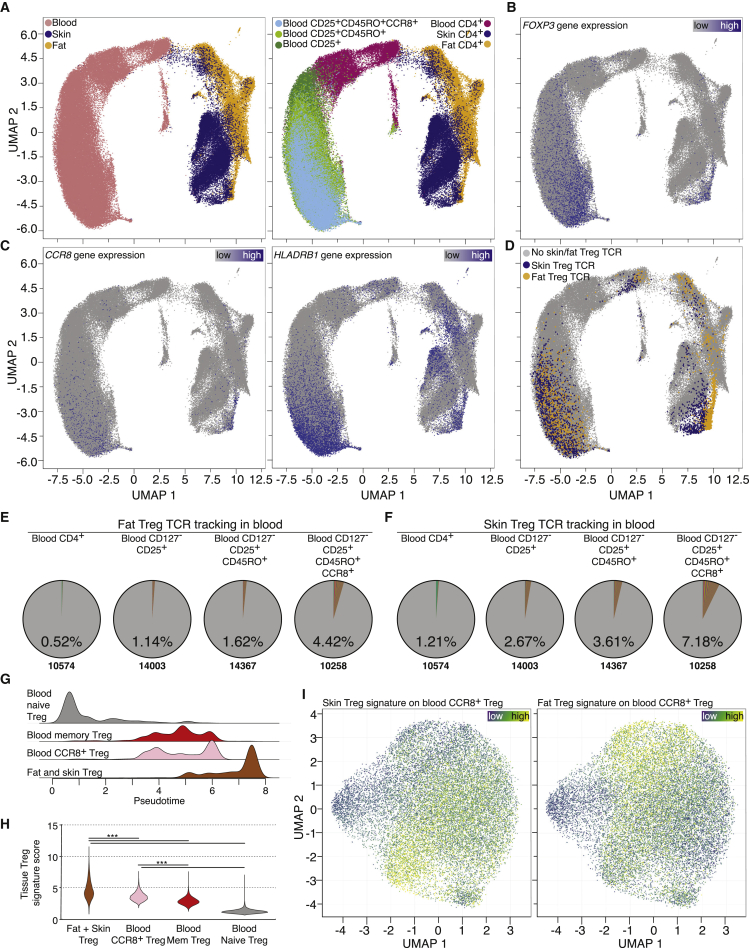
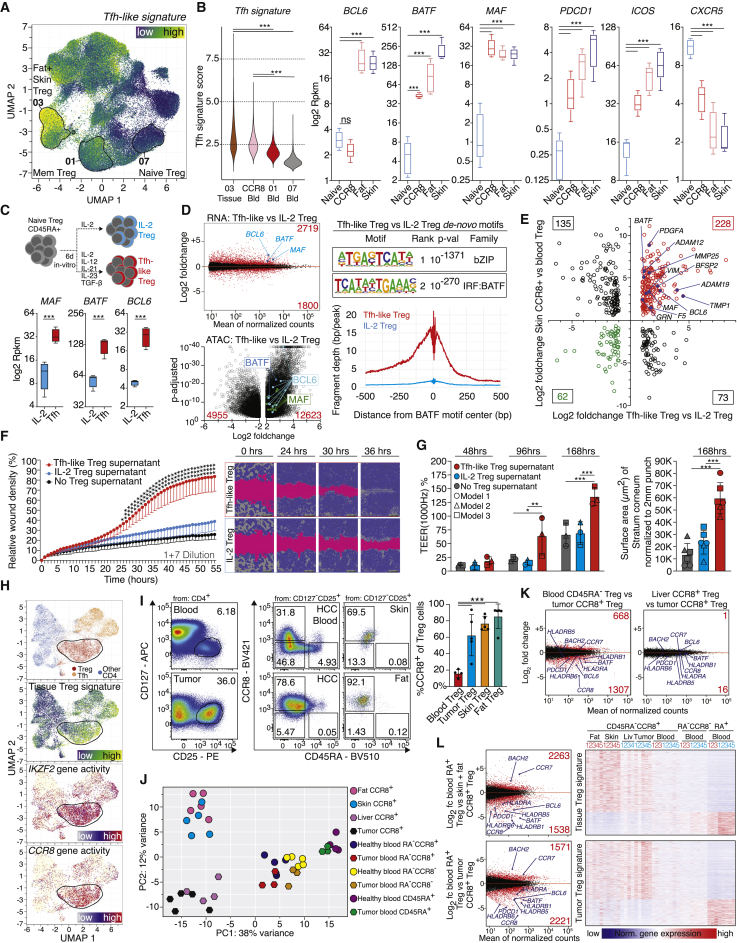
Murine regulatory T (Treg) cells in tissues promote tissue homeostasis and regeneration. We sought to identify features that characterize human Treg cells with these functions in healthy tissues. Single-cell chromatin accessibility profiles of murine and human tissue Treg cells defined a conserved, microbiota-independent tissue-repair Treg signature with a prevailing footprint of the transcription factor BATF. This signature, combined with gene expression profiling and TCR fate mapping, identified a population of tissue-like Treg cells in human peripheral blood that expressed BATF, chemokine receptor CCR8 and HLA-DR. Human BATF+CCR8+ Treg cells from normal skin and adipose tissue shared features with nonlymphoid T follicular helper-like (Tfh-like) cells, and induction of a Tfh-like differentiation program in naive human Treg cells partially recapitulated tissue Treg regenerative characteristics, including wound healing potential. Human BATF+CCR8+ Treg cells from healthy tissue share features with tumor-resident Treg cells, highlighting the importance of understanding the context-specific functions of these cells.


Conflict of interest statement

Declaration of interest The authors declare no competing financial interests.

Figures

None
Graphical abstract
Figure 1
Figure 1
Single-cell ATAC landscape identifies repair Treg signature in murine tissues and spleen (A) UMAP of scATAC-seq data derived from FACS-sorted CD4+ and CD25+ T cell populations of spleen, colon, lung, skin, and VAT. Sort layout and post-sort QC in Figure S1. Left, cells color-coded based on tissue of origin, batch-corrected using Harmony. Right, cells grouped in 26 clusters. (B) Chromatin accessibility of Foxp3 and Il2 gene locus, with blue = low and red = high accessibility. (C and D) Chromatin accessibility of the Sell, Tbx21 and Ifng gene locus. (E and F) ATAC signature of skin tisTregST2 (340 peaks), VAT tisTregST2 (417 peaks), a core tisTregST2 signature (2,267 peaks) or early (3,323 peaks), and late (1,726 peaks) tisTregST2 precursor signature overlaid on UMAP, with blue = low and yellow = high overlap. Contribution of signature to clusters in pie chart. All signatures in Table S1. (G) Pseudotime values and Batf chromVAR scores for selected clusters. (H) UMAP of scATAC-data with colon T cells. Outlined fraction localization of tisTregST2 cells. Right, chromatin accessibility of the Foxp3, Klrg1, Rorc and Ikzf2 gene locus with blue = low and red = high accessibility. Data derived from four experiments with 18 C57BL/6J male mice bred under specified pathogen-free (SFP) conditions.
Figure 2
Figure 2
Treg repair signature in single-cell ATAC landscape of T cells from germ-free animals (A) UMAP of scATAC-seq data derived from FACS-sorted CD4+ T cell populations of spleen, colon, skin, and VAT of germ-free animals. Sort layout and post-sort QC in Figure S2. Left, cells color-coded based on tissue of origin. Right, cells grouped in 21 clusters. (B) Chromatin accessibility of the Foxp3, Il2, Sell, Tbx21, and Ifng gene locus. (C) Bulk ATAC signature of skin tisTregST2, a core tisTregST2 signature or a late tisTregST2 precursor signature overlaid on UMAP. Contribution of signature to clusters in pie chart. (D) Pseudotime values and Batf chromVAR scores for selected clusters. (E) Flow cytometry of T cells from SPF versus gnotobiotic mice. Top, percentage of Foxp3+CD25+ Treg cells of CD4+ T cells in spleen and mesenteric LN (mes LN). Below, Klrg1+PD1+ late tisTregST2 precursors of CD4+Foxp3+ Treg cells in spleen and tissues (2-way ANOVA with Sidak’s multiple comparison test, n = 4–13 with ∗∗∗p < 0.001 or ns = p > 0.05). (F) UMAP of colon T cells. Outlined fraction localization of tisTregST2 cells. Right, chromatin accessibility of the Foxp3, Klrg1, Rorc, and Ikzf2 gene locus. Data derived from three experiments with 18 male mice bred under germ-free conditions or SPF conditions.
Figure 3
Figure 3
Single-cell ATAC and gene expression landscape of human blood, fat and skin CD4+ T cells (A) UMAP of scATAC-seq data derived from FACS-sorted CD4+ T cell populations of human peripheral blood, skin, and fat of individual donors. Sort layout and post-sort QC in Figure S3. Left, cells color-coded based on tissue of origin, batch-corrected for donor differences using Harmony. Right, cells grouped in 16 clusters. (B–E) Chromatin accessibility of the FOXP3, IKZF2, SELL, IL2, and IFNG gene loci. (F) PCA of DEG (padj < 0.001) in a comparison of bulk RNA-seq data from CD4+CD25+CD127- human fat and skin Treg cells and blood CD45RA+CD45RO- naive or blood CD45RA-CD45RO+ memory Treg cells. Sort layout and post-sort QC in Figure S3, Rpkm table and statistics in Table S2. (G) DEG between blood and tissue Treg cells. Several genes and number of DEG labeled. (H) Hierarchical clustering highlighting a common RNA tissue Treg signature with 2,779 DEG, selected by comparing memory Treg versus fat Treg cells (foldchange (fc) < 0.5 or > 2) and fat Treg versus skin Treg (fc < 0.5 or > 2). (I) Left, DEG between skin and fat Treg cells. Right, UMAP of scATAC-seq data from skin and fat Treg cells with tissue of origin and clustering. (J) ATAC-seq data for the GPR55, AHRR, and ITGA4 locus with two clusters (0, Skin Treg and 1, Fat Treg). All datasets group-normalized to maximum peak height indicated in brackets. scATAC-seq data are derived from four experiments with five female donors. Bulk RNA-seq data are derived from 11 experiments with 14 female donors.
Figure 4
Figure 4
Species-conserved tissue Treg peakset identifies CCR8+ Treg cell population in human blood (A) Murine tissue repair Treg signature. All peaks in a heatmap (left) and volcano plot (right). Some peaks highlighted and labeled by their closest gene. Peaks as hexagons p value < 10−300. (B) Human tissue Treg signature. (C) Shared peaks in murine (A) and human (B) tissue Treg datasets. Peaks as hexagons log FC > 2.0. Peaks overlapping with ChIP-confirmed BATF binding sites (B cells, GSM803538) blue and counted in pie charts. All peaks in heatmap with ATAC signal (left) and corresponding gene expression (right). All peaksets in Table S3. (D) HOMER de novo motif results in the comparison of tissue Treg (03) versus blood naive Treg (07). Below, read coverage versus distance from BATF motif center. (E) BATF chromVAR deviation against pseudotime for human Treg cell cluster 01, 03, and 07. Smoothing line fitted to the data. (F) UMAP with scATAC-seq data (cluster 01, 03, 07) and chromatin accessibility of the BATF and CCR8 gene locus. (G) Chromatin accessibility of the CCR8 locus in human Treg clusters 01, 03, and 07 with BATF ChIP-Seq data. Below, flow cytometry of BATF or FOXP3 of CCR8+ Treg cells (protein: n = 14, one-way ANOVA; RNA: n = 5, Deseq2). (H) Chromatin accessibility of the Ccr8 locus in murine Treg cluster 00, 11 and 16 combined with publicly available Batf ChIP-Seq (CD8 T cells, GSE54191). Below, expression of Ccr8 in tisTregST2 and precursor cells (n = 5, Deseq2). Pseudocolor dot plots: co-staining of Nfil3(GFP) or Areg(GFP) versus Ccr8 in spleen, skin or VAT-derived CD4+CD25+Treg cells from Nfil3(GFP) or Areg(GFP) reporter mice. All data are derived from two to five independent experiments with five or more individual mice or donors.
Figure 5
Figure 5
Surface protein, transcriptional and epigenetic analysis of human CCR8+ Treg cells in blood (A) Human Treg cells from healthy donors were pre-enriched and surface-stained (CD3+CD4+CD25+CD127-CD45RO+CCR8+), followed by individual staining with 361 PE-conjugated anti-human surface antibodies and measurement by flow cytometry. Color code indicates expression with blue = low and red = high. Gating, isotype control staining and additional results are shown in Figure S5. (B) Expression of HLA-DR in five subpopulations of human Treg cells. (C) Co-expression of CCR8 (x axis) and PE-coupled antibody (y axis), pre-gated on memory Treg cells. Blue = negative correlation, red = positive correlation. (D-E) Chromatin accessibility of the human HLA-DRB1, TFRC, NR_125405 and ITGA4 locus. Data are derived from antigen-naive Treg cells (07), memory Treg cells (01), and fat and skin Treg cells (03). BATF ChIP-Seq signal below (GSM803538). (F) DEG between blood memory CCR8+ and blood naive Treg cells. Several genes and total number of DEG are labeled. (G) Flow cytometry of Treg cells (CD4+CD25+CD127-) isolated from human blood, fat and skin tissue with CCR8 and HLA-DR expression (n = 4–5, one-way ANOVA with Tukey post-test). (H) Flow cytometry and tSNE with 100,000 human blood Treg cells, 1,763 fat Treg cells and 5,546 skin Treg cells. tSNE grouping based on CD25, CD39, BATF, CD45RA, CD45RO, CD195, CCR8, CD49d, HLA-DR, CD71 and FOXP3 expression. All data are derived from one independent experiment with three donors (A-C) or five independent experiments with five human female donors (F) and (G) or an individual donor, (H).
Figure 6
Figure 6
Single-cell RNA and TCR landscape of donor-matched human blood, fat and skin CD4+ T cells (A) UMAP of scRNA-seq data derived from FACS-sorted CD4+ T cell populations of human peripheral blood, skin and fat of one individual donor, second donor in Figure S6. Left, cells color-coded based on tissue of origin. Right, cells color-coded based on sort strategy. (B and C) Gene expression of FOXP3, CCR8, and HLA-DRB1 plotted on UMAP. Color code indicates expression strength. (D) TCRs derived from all skin Treg cells (blue) and all fat Treg cells (yellow) extracted and highlighted. TCRs listed in Table S4. (E and F) Tracking of fat (E) or skin (F) Treg TCR clones in different sorted populations of peripheral blood of the same donor. Percentage indicates fraction of detected clones, total number of clones shown below. (G and H) scATAC-seq based pseudotime trajectory and tissue Treg signature (2687 peaks) score (∗∗∗p < 0.001, Kruskal-Wallies test). (I) UMAP of scATAC-seq data derived from FACS-sorted CCR8+ T cell population of human peripheral blood of female donors highlighting the skin Treg signature (1,030 peaks) and fat Treg signature (437 peaks). All data are derived from two independent experiments with one female donor (scRNA/scTCR) or two independent experiments with two female donors (scATAC).
Figure 7
Figure 7
Treg cells in wound healing and cancer (A) UMAP with Tfh signature (3,099 peaks). (B) Tfh signature score and RNA expression of Tfh-related molecules (n = 5, Deseq2). (C and D) Human blood-derived naive Treg cells treated for six days with IL-2 or Tfh mix, followed by ATAC and RNA-seq (n = 4, Deseq2, Table S5). ATAC loci highlighted, peaks padj < 10−40 capped. Right, HOMER de-novo motif search and reads around BATF motif center. (E) RNA-seq data (Tfh Treg versus IL-2 Treg) compared to RNA-seq of CCR8+ skin Treg versus blood naive Treg. (F) Supernatants of Tfh-like Treg cells or IL-2 Treg cells from 5 donors used in wound healing assay (HaCaT, 1+7 dilution, n = 5, unpaired t testing with Holm-Sidak post-test). (G) Tfh-like Treg or IL-2 Treg supernatants from 16 donors used in human epidermal reconstruction model. Left, electrical impedance (n = 3 models); right, surface area of Stratum corneum (n = 3, two scans of each model, ANOVA and Tukey post-test). (H) UMAP of CD4+ T cell populations of human basal cell carcinoma (Satpathy et al., 2019) with cell type, tissue Treg signature, IKZF2 and CCR8 gene activity. (I) CCR8 and CD45RA expression in Treg cells from liver tumor, blood, skin or fat (one-way ANOVA with Tukey post-test, n = 4–5). (J) PCA with 500 most differential DEG for Treg cells from tumors or healthy donors (Table S5). (K) DEG between liver tumor CCR8+ Treg versus blood CD45RA+ Treg (left) or liver tumor CCR8+ Treg versus NAT liver CCR8+ Treg. (L) Top, DEG between skin and fat CCR8+ Treg versus blood CD45RA+ Treg with heatmap. Below, DEG between liver tumor CCR8+ Treg versus patient blood CD45RA+ Treg cells with heatmap. Data are derived from 11 experiments with 14 donors (B), 2 experiments 4 donors (C-D), one experiment with 5 (F) or 16 donors (G), or 9 experiments with 10 female and male donors (I–L).

Comment in

References

    1. Ali N., Zirak B., Rodriguez R.S., Pauli M.L., Truong H.A., Lai K., Ahn R., Corbin K., Lowe M.M., Scharschmidt T.C. Regulatory T Cells in Skin Facilitate Epithelial Stem Cell Differentiation. Cell. 2017;169:1119–1129. - PMC - PubMed
    1. Alvisi G., Brummelman J., Puccio S., Mazza E.M., Tomada E.P., Losurdo A., Zanon V., Peano C., Colombo F.S., Scarpa A. IRF4 instructs effector Treg differentiation and immune suppression in human cancer. J. Clin. Invest. 2020;130:3137–3150. - PMC - PubMed
    1. Arpaia N., Green J.A., Moltedo B., Arvey A., Hemmers S., Yuan S., Treuting P.M., Rudensky A.Y. A Distinct Function of Regulatory T Cells in Tissue Protection. Cell. 2015;162:1078–1089. - PMC - PubMed
    1. Atarashi K., Tanoue T., Shima T., Imaoka A., Kuwahara T., Momose Y., Cheng G., Yamasaki S., Saito T., Ohba Y. Induction of colonic regulatory T cells by indigenous Clostridium species. Science. 2011;331:337–341. - PMC - PubMed
    1. Azizi E., Carr A.J., Plitas G., Cornish A.E., Konopacki C., Prabhakaran S., Nainys J., Wu K., Kiseliovas V., Setty M. Single-Cell Map of Diverse Immune Phenotypes in the Breast Tumor Microenvironment. Cell. 2018;174:1293–1308. - PMC - PubMed

Publication types