. 2021 Mar 30;34(13):108754.
doi: 10.1016/j.celrep.2021.108754.

Functional enhancer elements drive subclass-selective expression from mouse to primate neocortex

Affiliations

Functional enhancer elements drive subclass-selective expression from mouse to primate neocortex

John K Mich et al. Cell Rep. .

Abstract

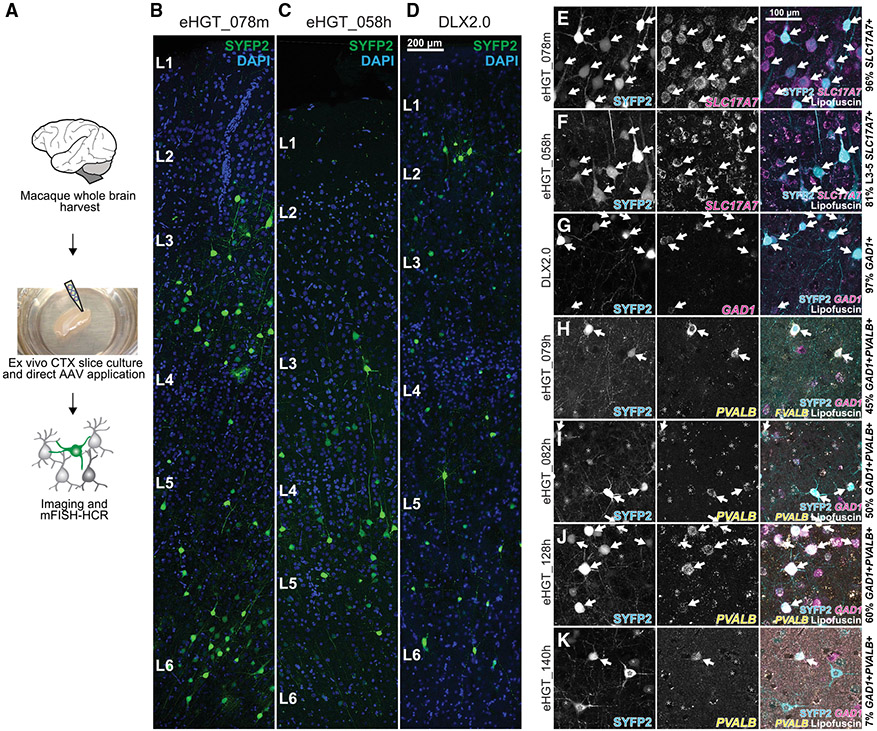
Viral genetic tools that target specific brain cell types could transform basic neuroscience and targeted gene therapy. Here, we use comparative open chromatin analysis to identify thousands of human-neocortical-subclass-specific putative enhancers from across the genome to control gene expression in adeno-associated virus (AAV) vectors. The cellular specificity of reporter expression from enhancer-AAVs is established by molecular profiling after systemic AAV delivery in mouse. Over 30% of enhancer-AAVs produce specific expression in the targeted subclass, including both excitatory and inhibitory subclasses. We present a collection of Parvalbumin (PVALB) enhancer-AAVs that show highly enriched expression not only in cortical PVALB cells but also in some subcortical PVALB populations. Five vectors maintain PVALB-enriched expression in primate neocortex. These results demonstrate how genome-wide open chromatin data mining and cross-species AAV validation can be used to create the next generation of non-species-restricted viral genetic tools.

Keywords: AAVs; ATAC-seq; brain cell types; enhancers; epigenetics; ex vivo brain slice; genetic tools; human; macaque; parvalbumin.


Conflict of interest statement

Declaration of interests J.K.M., L.T.G., E.E.H., H.Z., B.T., E.L., J.T.T., and B.P.L. are inventors on several U.S. patent applications related to this work. The remaining authors declare no competing interests.

Figures

Figure 1.
Figure 1.. A database of human neocortical cell subclass-specific accessible chromatin elements
(A) Workflow for human neocortical open chromatin characterization. See STAR Methods for details. (B–D) High-quality nuclei (2,858 from 14 specimens) visualized by t-distributed stochastic neighbor embedding (t-SNE) and colored according to mapped transcriptomic cell types grouped into cell type subclass (B), sort strategy (C), or specimen (D). (E) Transcriptomic abundances of 11 cell subclass-enriched marker genes (median counts per million [CPM] within subclass) for 11 subclasses of cell types identified in human MTG (Hodge et al., 2019). (F) Eleven example subclass-specific marker genes demonstrating uniquely accessible chromatin elements in their vicinity (less than 50 kb distance to gene). Pileup heights are scaled proportionally to read number, and yellow bars highlight subclass-specific peaks for visualization. Dashed lines, introns; thick bars, exons; arrows, direction to gene body.
Figure 2.
Figure 2.. High conservation of human neocortical accessible genomic elements and association with disease
(A) Jaccard similarity coefficient enrichments (ratio of real to randomized peak positions) between human and mouse neocortical cell subclasses. Subclass-specific peaksets almost always best match their orthologous peakset across species. (B) Visualization of conserved (Cons.) and divergent (Div.) peak counts across cell subclass in human and mouse. Conserved peaks are more frequent than expected by chance (**FDR < 0.01). (C) Greater primary sequence conservation for conservedly accessible peaks than for divergently accessible peaks in both human and mouse. ***p < 0.001 by heteroscedastic t test (human t = 10.3, df = 18.5; mouse t = 6.6, df = 19.9). Dashed line indicates no difference between real and randomized peak positions. (D) Associations between GWAS-identified loci and subclass ATAC-seq peaksets (top) and methylation DMRs (bottom; Lister et al., 2013; Luo et al., 2017). Heatmap fill represents ratio of the proportion of heritability contained by that peakset’s linked SNPs, to the proportion of that peakset’s linked SNPs, as calculated by LDSC (Bulik-Sullivan et al., 2015; Finucane et al., 2015). Outline color marks significance; Bonferroni correction for multiple hypothesis testing (180 tests for ATAC-seq peaks and 150 tests for DMRs). (E) Associations between conserved and divergent human ATAC-seq peaks, and GWAS-identified loci. Outline color marks significance; Bonferroni-corrected p values are employed (345 tests performed). (F) Total summed heritability of all SNPs associated with conserved peaks versus those associated with divergent peaks, for three studies with multiple significant neuron subclass associations. ***p < 0.01 by heteroscedastic t test, t = 3.8, degrees of freedom (df) = 45.6.
Figure 3.
Figure 3.. Accessible chromatin elements furnish cell subclass-specific AAV genetic tools
(A) AAV2/PHP.eB viral reporter vector design for testing presumptive enhancers cloned upstream of a minimal promoter and SYFP2 reporter expression cassette in mouse retro-orbital assay. (B) Transgene expression from AAV-hSyn1-H2B-SYFP2 in most neurons throughout mouse brain. (C) Transgene expression from AAV-hDLXI56i-minBG-SYFP2 in mouse forebrain interneurons, in agreement with previous reports (Zerucha et al., 2000; Dimidschstein et al., 2016). (D) Several identified enhancers showing ATAC-seq peaks in distinct target cell subclasses. Each selected enhancer is highlighted in yellow on read pileups, and heatmap below demonstrates ATAC-seq read CPM in all cell subclasses. (E) Distinct expression patterns from these enhancer-AAV vectors in live 300-μm-thick slices of primary visual cortex (VISp) after retro-orbital delivery, consistent with different subclass-specific expression patterns. (F) Multiplexed FISH in VISp region revealing differing subclass specificities from various enhancer-AAV vectors. Text represents mean ± SD for labeling specificity across three independent mice. (G)scRNA-seq on sorted individual SYFP2+ cells from VISp region confirming distinct cell subclass transcriptomic identities labeled by the highlighted enhancer-AAV vectors.
Figure 4.
Figure 4.. PVALB neocortical interneuron enhancers display distinct subcortical expression patterns
(A) Twenty putative PVALB enhancers from snATAC-seq data cloned into AAV vectors. Seven of the 20 (35%) exhibited low or high specificity for PVALB cells in mouse retro-orbital assay (indicated with green boxes). (B–G) mFISH in L2/L3 of VISp demonstrating positive labeling of Pvalb+ cells (arrows) by each of the indicated enhancer-AAV vectors. eHGT_023h and eHGT_064h also label non-Pvalb+ cells (asterisks). Percentages indicate the mean ± SD of SYFP2 labeling specificity for Pvalb+ cells across three independent mice. (H–M) scRNA-seq in VISp confirming the PVALB transcriptomic cell subclass identity of enhancer-AAV vector-labeled cells. Bar graph shows the percentage of single cells that map to a transcriptomic cell type within that subclass. In contrast, the percentages given in the text are the percentage of cells recovered that expressed the indicated gene. Note that although only 65% of the eHGT_079h-marked cell types mapped to the PVALB subclass, 94% of the eHGT_079h-marked cells expressed Pvalb mRNA. This is because several SST subclass cell types also express Pvalb mRNA. (N) Pvalb mRNA expression pattern (Allen Institute public in situ hybridization data) with multiple sites of expression throughout mouse brain. (O–T) Labeling of both neocortical PVALB cells and various subcortical brain regions by PVALB-specific enhancers. These subcortical brain regions are also seen in the endogenous Pvalb mRNA expression pattern. Two enhancers (eHGT_079h and 140h) show exceptional specificity to neocortical PVALB cells. CTX, cerebral cortex; HPF, hippocampal formation; MOB, main olfactory bulb; MB, midbrain nuclei; MY, medulla nuclei; P, pons; IC, inferior colliculus; CBX, cerebellar cortex; CBN, cerebellar nuclei. (U and V) Subcortical labeling by eHGT_023h in Purkinje cells (U) and eHGT_082h in CBN (V). eHGT_023h-labeled Purkinje cells are Pvalb+Gad1+, and eHGT_082h-labeled CBN cells are either Pvalb+Gad1+ or Pvalb+Gad1.
Figure 5.
Figure 5.. Multiple PVALB enhancer vectors demonstrate cell subclass specificity across the NHP neocortex
(A) Workflow for in vivo AAV vector testing by multisite intraparenchymal injection in NHP brain. (B–E) Injection of eHGT_079h, 082h, 128h, and 359h AAV vectors into NHP occipital cortex. These four vectors label PVALB cells throughout the cortical column with high specificity and completeness. Colored dots indicate the positions of immunophenotypic counted cells observed by coimmunostaining with anti-GFP and anti-PVALB antibodies. (F–I) Injection of eHGT_140h AAV vector into different NHP neocortical areas. This vector labels PVALB cells across multiple cortical areas with moderate or high specificity and completeness. Colored dots represent immunophenotypes of counted cells. Red arrows indicate rare labeled large L5 pyramidal neurons. Quantifications in each panel (B–I) represent >200 cells counted per vector in one experiment. (J) Electrophysiological characterization of eHGT_140h+ neurons in motor cortex. Compared to unlabeled pyramidal neurons, eHGT_140h+ neurons display more and narrower APs and greater fast AHP amplitude, confirming their fast-spiking neuron identity. Data represent 14 recorded eHGT_140h+ neurons in one experiment and six recorded pyramidal neurons from a second experiment provided for contrast.
Figure 6.
Figure 6.. Enhancer-AAV testing in NHP ex vivo neocortical slices
(A) Workflow for acquiring fresh NHP neocortical tissue for AAV vector testing ex vivo. (B–D) Transduction of ex vivo NHP neocortical tissue with various AAV2/PHP.eB enhancer-reporter vectors, resulting in diverse expression patterns. eHGT_078m labels excitatory neurons throughout all layers (B), eHGT_058h labels excitatory neurons primarily in L3–L5 (C), and DLX2.0 labels inhibitory neurons (D). (E–K) NHP neocortical cell subclass specificity of AAV-vector labeling confirmed by mFISH. eHGT_078m, 058h, and DLX2.0 demonstrate high specificity similar to that seen in mouse retro-orbital assay, but eHGT_079h, 082h, 128h, and 140h show reduced specificity compared to that seen in mouse retro-orbital assay and NHP in vivo assay. Arrows highlight specifically labeled on-target cell types, and asterisks mark off-target labeled cells. Text represents mean for labeling specificity across one or two independent transduction experiments (>100 cells counted per vector per experiment).
Figure 7.
Figure 7.. Enhancer-AAV specificity of hDLXI56i and DLX2.0 vectors in ex vivo human neocortical slices
(A) Workflow for acquiring fresh human neurosurgical tissue for AAV vector testing. (B) AAV-DLX2.0-minBG-SYFP2 transduction of human ex vivo brain slice. Reporter fluorescence labels scattered neurons with diverse non-pyramidal cellular morphologies spanning all neocortical layers. (C and D) Molecular identity of AAV-hDLXI56i-minBG-SYFP2+ (C) or AAV-DLX2.0-minBG-SYFP2+ (D) singly sorted human cells by scRNA-seq. The majority of human cells labeled by these vectors are inhibitory neurons of multiple transcriptomic types. Dendrogram represents human MTG taxonomy (Hodge et al., 2019), leaves represent 75 transcriptomic cell types, and circles represent labeled and sorted cells mapped onto the taxonomy. Circle size represents cell numbers. Circles on intermediate nodes of the dendrogram represent incomplete mapping to cell type. Data from eight independent experiments are shown (four in C and four in D).

References

    1. Andersson M, Avaliani N, Svensson A, Wickham J, Pinborg LH, Jespersen B, Christiansen SH, Bengzon J, Woldbye DPD, and Kokaia M (2016). Optogenetic control of human neurons in organotypic brain cultures. Sci. Rep 6, 24818. - PMC - PubMed
    1. Anney RJL, Ripke S, Anttila V, Grove J, Holmans P, Huang H, Klei L, Lee PH, Medland SE, Neale B, et al.; Autism Spectrum Disorders Working Group of The Psychiatric Genomics Consortium (2017). Meta-analysis of GWAS of over 16,000 individuals with autism spectrum disorder highlights a novel locus at 10q24.32 and a significant overlap with schizophrenia. Mol. Autism 8, 21. - PMC - PubMed
    1. Autism Spectrum Disorder Working Group of the Psychiatry Genomics Consortium (2015). Dataset: PGC-ASD summary statistics from a meta-analysis of 5,305 ASD-diagnosed cases and 5,305 pseudocontrols of European descent (based on similarity to CEPH reference genotypes). http://www.med.unc.edu/pgc/results-and-downloads.
    1. Bailey TL, Boden M, Buske FA, Frith M, Grant CE, Clementi L, Ren J, Li WW, and Noble WS (2009). MEME SUITE: tools for motif discovery and searching. Nucleic Acids Res. 37, W202–8. - PMC - PubMed
    1. Bakken TE, Jorstad NL, Hu Q, Lake BB, Tian W, Kalmbach BE, Crow M, Hodge RD, Krienen FM, Sorensen SA, et al. (2020). Evolution of cellular diversity in primary motor cortex of human, marmoset monkey, and mouse. BioRxiv, 2020.03.31.016972.

Publication types