. 2021 Jul 15:235:117997.
doi: 10.1016/j.neuroimage.2021.117997. Epub 2021 Mar 28.

A comprehensive macaque fMRI pipeline and hierarchical atlas

Affiliations

A comprehensive macaque fMRI pipeline and hierarchical atlas

Benjamin Jung et al. Neuroimage. .

Abstract

Functional neuroimaging research in the non-human primate (NHP) has been advancing at a remarkable rate. The increase in available data establishes a need for robust analysis pipelines designed for NHP neuroimaging and accompanying template spaces to standardize the localization of neuroimaging results. Our group recently developed the NIMH Macaque Template (NMT), a high-resolution population average anatomical template and associated neuroimaging resources, providing researchers with a standard space for macaque neuroimaging . Here, we release NMT v2, which includes both symmetric and asymmetric templates in stereotaxic orientation, with improvements in spatial contrast, processing efficiency, and segmentation. We also introduce the Cortical Hierarchy Atlas of the Rhesus Macaque (CHARM), a hierarchical parcellation of the macaque cerebral cortex with varying degrees of detail. These tools have been integrated into the neuroimaging analysis software AFNI to provide a comprehensive and robust pipeline for fMRI processing, visualization and analysis of NHP data. AFNI's new @animal_warper program can be used to efficiently align anatomical scans to the NMT v2 space, and afni_proc.py integrates these results with full fMRI processing using macaque-specific parameters: from motion correction through regression modeling. Taken together, the NMT v2 and AFNI represent an all-in-one package for macaque functional neuroimaging analysis, as demonstrated with available demos for both task and resting state fMRI.

Keywords: Alignment; Monkey; Nonhuman primate; Stereotaxic; Template; fMRI analysis.


Conflict of interest statement

Declaration of Competing Interest The authors report no conflicts of interest.

Figures
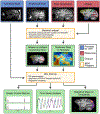
Fig. 1.
Fig. 1.. An example overview of task-based fMRI analysis in AFNI.
Unprocessed functional and anatomical scans are collected by researchers in a native subject space (top row, blue). For voxel-wise analyses, the fMRI datasets are typically aligned to a common space. AFNI’s @animal_warper program estimates nonlinear alignment between a subject’s anatomical and any target template (e.g., the symmetric NMT v2; top row, red). The calculated warp field (middle row, right, green) is applied to align atlases, segmentations, and other maps in the template space (here the CHARM level 5; top row, red) to the subject (middle row, left, green) and to align native space volumes to the template. The nonlinear warps are saved for future applications. Images and tables of ROI information are automatically created for efficient QC purposes. The native space anatomical and functional datasets, in combination with @animal_warper’s nonlinear transforms, and any supplementary files of experimental design, such as stimulus timings for task fMRI, may then be supplied to afni_proc.py. afni_proc.py generates complete single subject processing streams that perform motion correction and other preprocessing steps, apply the nonlinear warps to bring all functional data to the NMT v2, and perform regression modeling. QC metrics and images are created for rapid exploration of all steps and final outputs (bottom row, green), including motion and outlier profiles, models of hemodynamic response for task fMRI, and volumetric statistical maps.
Fig. 2.
Fig. 2.. The NMT v2 has improved spatial contrast and structural delineation.
The delineation of brain structures is directly compared in the NMT v1.2 (left) and the symmetric NMT v2 (right). Hyperintensities driven by sinus cavities previously resulted in blurred boundaries of the frontal surface of the NMT v1.2 (red box; top left). These hyperintensities in GM have been largely eliminated in the NMT v2 (red box; top right). In the temporal lobe (bottom), hyperintensities were also present in GM in the NMT v1.2 (red box; bottom left) and removed in the NMT v2 (red box; bottom right). We also observe improved delineation of “brain” tissues from “non-brain” tissues (such as blood vasculature and cranial nerves; bottom, on the ventromedial surface and dorsally in the lateral sulcus). Red arrows identify regions of improved delineation or removal of artifacts in the NMT v2. As displayed in the full coronal and axial images, we observe a more consistent intensity across the WM in the NMT v2. Note that in this figure the NMT v2 was rotated to match the AC-PC alignment of the NMT v1.2 to facilitate comparison between the two templates.
Fig. 3.
Fig. 3.. The orientation and coordinate system of the NMT v2.
The orientation of the NMT v2 (top) is that of the Horsley-Clarke stereotaxic apparatus, which is commonly used to report coordinates in macaque research. The origin, denoted by a red dot, is at the midpoint of the interaural line, referred to as ear bar zero (EBZ). In contrast, the NMT v1.2 (bottom) is oriented so the horizontal plane passes through two internal brain landmarks, namely the anterior commissure (AC) and the posterior commissure (PC), or AC-PC alignment. The origin of the NMT v1.2 lies at the midpoint of the anterior commissure. Abbreviations: AP = Anterior-Posterior axis, SI = Superior-Inferior axis, LR = Left-Right axis.
Fig. 4.
Fig. 4.. The symmetric NMT v2 and associated datasets.
Axial slices through the symmetric NMT v2 are shown as an underlay, with various masks distributed with the template overlaid translucently. A) The symmetric NMT v2 brain mask (red) captures the brain and associated vasculature. B) The brain mask is further divided into a 5-class segmentation of the following types: cerebrospinal fluid (CSF; green), subcortical gray matter (scGM; purple), cortical gray matter (GM; dark blue), white matter (WM; light blue) and large blood vasculature (BV; red). C) Multiple atlases are provided with the NMT v2, including the CHARM. Level 1 of the CHARM hierarchy is displayed here, which consists of the frontal (yellow), temporal (purple), parietal (green) and occipital (pink) cortical lobes. Distances are superior to the interaural meatus. The asymmetric segmentation is shown in Fig.S2.
Fig. 5.
Fig. 5.. The Cortical Hierarchy Atlas of the Rhesus Macaque (CHARM).
The CHARM parcellates the macaque cortical sheet at multiple spatial scales. Level 1 of the CHARM (left) contains the four cortical lobes. As the CHARM level increases, the cortical lobes are increasingly subdivided based on anatomical landmarks, functional relationships and cytoarchitectonics. The final level (level 6; right) consists of regions derived from the D99 macaque atlas, with exceptionally small D99 areas merged into neighboring regions to create ROIs robust to regridding of the atlas to individual scans. Each of the six levels of the CHARM are shown (along with the number “n” of regions per level) both projected onto the right hemisphere of the symmetric NMT v2 mid-cortical surface (top) and in an axial slice (24.5 mm superior to the origin) of the symmetric NMT v2 template (bottom). The color scale shows hierarchical relationships between levels, with each ROI sharing a similar hue to its related ROI in the level above. As the CHARM level increases, the saturation of the ROI color increases in kind. The mid-cortical surfaces were generated using CIVET-macaque (Lepage et al., 2021) and displayed using SUMA (Saad et al., 2004).
Fig. 6.
Fig. 6.. Example of the CHARM hierarchical structure.
A) Tree diagram showing successively finer parcellation of the inferior temporal cortex (ITC) within the temporal lobe. Other portions of the temporal lobe are not depicted. B) Lateral views of the symmetric NMT v2 surface with CHARM regions displayed in color. The ITC (Level 2, orange) is a visual region within the temporal lobe (Level 1, red). After level 1, only ITC regions are shown. Levels 3–6 show the ITC subdivided into progressively smaller subdivisions. In level 3 (green), the ITC is subdivided into areas TE, TEO, and the fundus of the superior temporal sulcus (STSf). In level 4 (cyan), area TE is split into its portions on the ventral bank of the superior temporal sulcus (STSv) and its lateral and ventral portion on the middle and inferior temporal gyri (gyral TE). In level 5 (blue), both the gyral portion of area TE and the fundus of the STS are split along the anterior-posterior axis. Level 6 (purple) preserves the D99 parcellation. Area TE is comprised of 8 parts, with both anterior and posterior area TE further splitting into dorsal and ventral subdivisions and the STSv splitting into its cytoarchitectonic subdivisions (TEa and TEm). At this level, the STSf is divided into areas IPa and PGa and the floor of the superior temporal area (FST). The mid-cortical surfaces were generated using CIVET-macaque (Lepage et al., 2021) and displayed using SUMA (Saad et al., 2004).
Fig. 7.
Fig. 7.. Results of alignment with @animal_warper for all subjects in the AFNI macaque demos.
For each subject, the left image shows the edges of the NMT v2 template overlaid on the input anatomical, and the right image shows the warped CHARM level 5 ROIs overlaid on the skull stripped anatomical (after spatial normalization of brightness). Each image shows a middle axial slice, but each is in native space, so locations and scale vary due to size, shape, and angle of the subject’s head. Subject F shows a bit of frontal misalignment, but typically @animal_warper’s alignment, skull stripping, and atlas-mapping appear to have performed well. These anatomical scans are from the MACAQUE_DEMO_REST (awake/anesthetized resting state fMRI) demo and available from PRIME-DE: subjects in subjects A - C are from NIMH (Messinger et al.); subjects D - E are from NIN (Klink and Roelfsema); and subject F is from SBRI (Procyk, Wilson and Amiez); data from subject A is also used in the MACAQUE_DEMO_2.0 (task-based fMRI, with the same anatomical volume).
Fig. 8.
Fig. 8.. Examples of output datasets from @animal_warper.
Outputs from @animal_warper for a single macaque subject in AFNI’s MACAQUE_DEMO_2.0 are shown. The first three columns show a subset of the automatic quality control (QC) output images created by the program, from left to right: alignment quality of the NMT v2 reference template (white edges of tissue boundaries underlay) to the original input dataset (translucent color overlay); skull stripping (warped brain mask overlaid on the input dataset); and atlas ROIs from the template space transformed to the input dataset (here, the CHARM, level 3). The fourth and fifth columns show surface views of the mapped CHARM Level 2 and Level 5 ROIs, respectively, with select slices of the subject’s anatomical scan using SUMA; these individual area surface files are automatically generated by @animal_warper, and can be viewed in different orientations, transparency levels and ROI combinations.
Fig. 9.
Fig. 9.. Some quality control (QC) steps provided by the afnI_proc.py fMRI analysis pipeline.
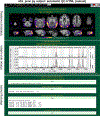
Output is automatically generated in HTML format for efficient review in a browser. This example is from the task fMRI MACAQUE_DEMO_2.0 in AFNI. In the top block, the F-stat overlaid on the NMT v2 symmetric template shows brain regions where the modeled variance is much greater than residual variance, i.e., where the model specification is highest; in this case, visual areas involved in face, object, and scrambled stimulus perception. The next displayed block shows the motion (Euclidean norm of rigid body motion estimates) and the fraction of outlier voxels in the volume at each time point (x-axis), with censoring threshold levels for each (cyan line) and the resulting censored time points (red vertical line). The alternating gray/white background shows where EPI runs were concatenated (here, 15 runs), and the histograms at the right show the time-averaged parameter estimates before and after censoring (BC and AC, respectively). In the bottom block, warnings that afni_proc.py checks for while processing are presented, such as collinearity in the design matrix, total fraction of censored time points, fraction of each stimulus censored and pre-steady state volumes; warning levels are shown with a word and color above, and the level of greatest severity is also shown in the ’warns’ tab in the HTML. Additional QC steps provided in the afni_proc.py output, but not shown here, include images of the raw data, alignments, local correlation structure and quantitative summaries.
Fig. 10.
Fig. 10.. Example of a task-based fMRI contrast map automatically generated using the afni_proc.py analysis pipeline.
The contrast is of blocks where the monkey fixated centrally-presented intact monkey faces versus scrambled monkey faces (i.e., “ intact faces vs scrambled faces"). The overlay shows the effect estimates or beta weights (hot colors, intact > scrambled; cold colors, intact < scrambled) superimposed on axial and sagittal slices through the NMT v2 symmetric template. The t-statistic (DF=1406) is used for thresholding, applied in a way to show all relevant results from modeling: suprathreshold regions (two-sided p < 0.001) are opaque and outlined in black, while values of lower significance are shown with increasing transparency. Because these data are from a single session of one subject, the brain region is not masked (to allow checking for artifacts, ghosting, motion effects, etc.). These images are automatically generated for review as part of afni_proc.py’s quality control HTML.
Fig. 11.
Fig. 11.. Resting state processing outputs for 2 of the subjects in the MACAQUE_DEMO_REST.
For each subject, part of the automatic QC HTML created by afni_proc.py is shown: a seed-based correlation map (seed in the left auditory cortex at 20.1L, 5.0A, 21.0S in the symmetric NMT v2), with translucent thresholding and no brain masking applied; and the motion summary plots over the duration of the concatenated fMRI scans (“enorm,” the “Euclidean norm” of motion parameters; and “outlier frac,” the fraction of voxels in the brain mask that are outliers), with horizontal cyan lines showing censor limits and red regions showing censored time points. For sub-01, a fairly large fraction of time points have been censored (22%), producing a “medium” warning message in the HTML (not shown), but the seed correlation patterns have high left-right symmetry and have large values in physiologically reasonable locations. For sub-02, a very large fraction of time points has been censored (54%), producing a “severe” warning message (not shown), and indeed the correlation patterns appear to still be heavily influenced by motion (extremely high correlation throughout the brain, including non-GM tissues).
Fig. 12.
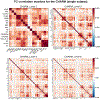
Fig. 12.. Resting state correlation matrices generated from a single subject using the CHARM.
After the processing and regression modeling specified with afni_proc.py, one can combine the main output (i.e., the residual time series, in this case without spatial blurring) with an atlas (here, the bilateral CHARM regions) to conduct ROI-based analyses. We display the middle four CHARM levels as a demonstration of how spatial scale impacts resting state correlations. The hierarchical nature of the CHARM allows correlations to be evaluated at multiple spatial scales, allowing one to “zoom in” on details. For example, notice the clusters of correlation both within the visual regions (areas V1,V2-V4, and MT) and the somatomotor regions (motor, SI-SII), which are observable throughout all of the CHARM levels at various degrees of detail.

References

    1. Ainsworth M, Sallet J, Joly O, Kyriazis D, Kriegeskorte N, Duncan J, Schüffelgen U, Rushworth MF, Bell AH, 2020. Perceived Ambiguity of Social Interactions Increases Coupling Between Frontal and Temporal Nodes of the Social Brain bioRxiv 2020.03.11.987792. doi: 10.1101/2020.03.11.987792. - DOI - PMC - PubMed
    1. Arcaro MJ, Schade PF, Livingstone MS, 2019. Body map proto-organization in newborn macaques. Proc. Natl. Acad. Sci 116, 24861–24871. doi: 10.1073/pnas.1912636116. - DOI - PMC - PubMed
    1. Autio JA, Glasser MF, Ose T, Donahue CJ, Bastiani M, Ohno M, Kawabata Y, Urushibata Y, Murata K, Nishigori K, Yamaguchi M, Hori Y, Yoshida A, Go Y, Coalson TS, Jbabdi S, Sotiropoulos SN, Kennedy H, Smith S, Van Essen DC, Hayashi T, 2020. Towards HCP-Style macaque connectomes: 24-Channel 3T multi-array coil, MRI sequences and preprocessing. NeuroImage 215, 116800. doi: 10.1016/j.neuroimage.2020.116800. - DOI - PMC - PubMed
    1. Bailey P, von Bonin G, 1947. The neocortex of Macaca mulatta.
    1. Ball G, Seal ML, 2019. Individual variation in longitudinal postnatal development of the primate brain. Brain Struct. Funct. 224, 1185–1201. doi: 10.1007/s00429-019-01829-5. - DOI - PubMed

Publication types