. 2021 Mar 31;22(1):94.
doi: 10.1186/s13059-021-02273-7.

MTSplice predicts effects of genetic variants on tissue-specific splicing

Affiliations

MTSplice predicts effects of genetic variants on tissue-specific splicing

Jun Cheng et al. Genome Biol. .

Erratum in

Abstract

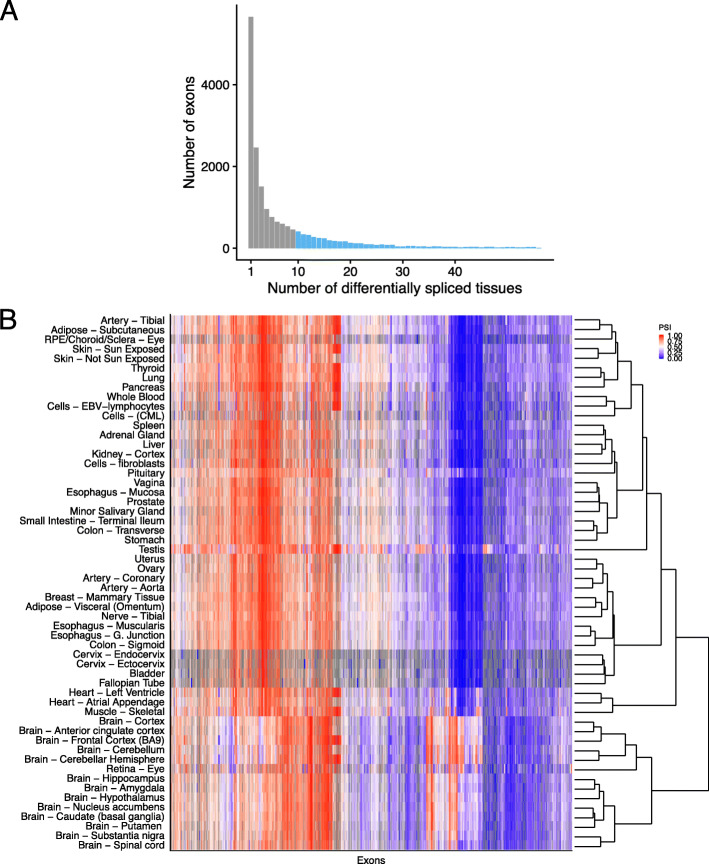
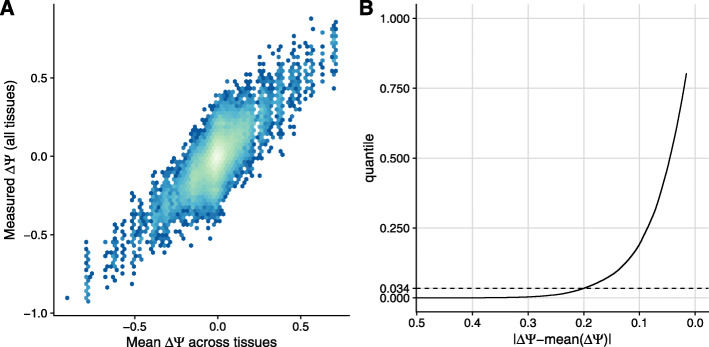
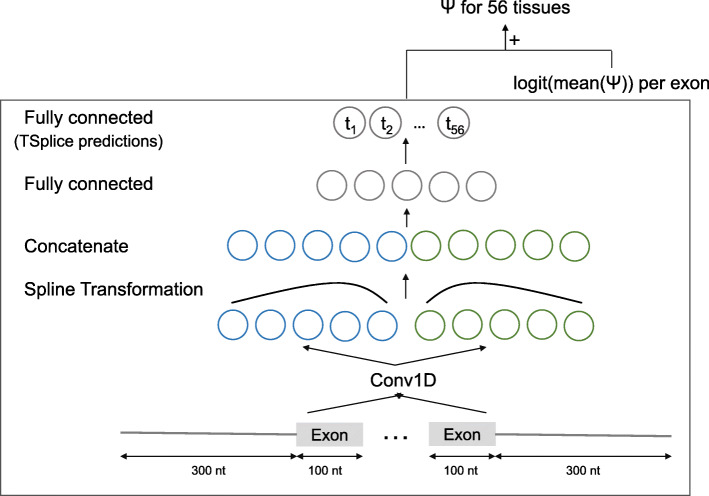
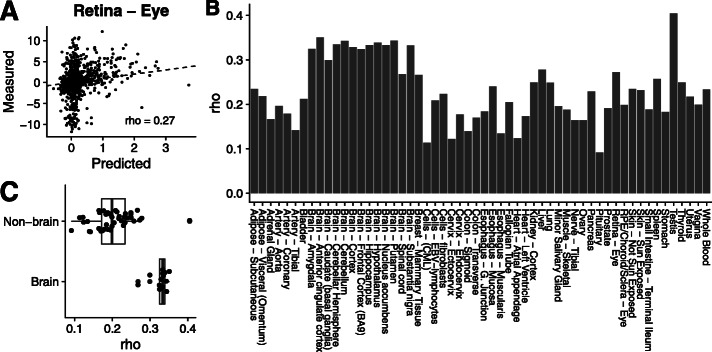
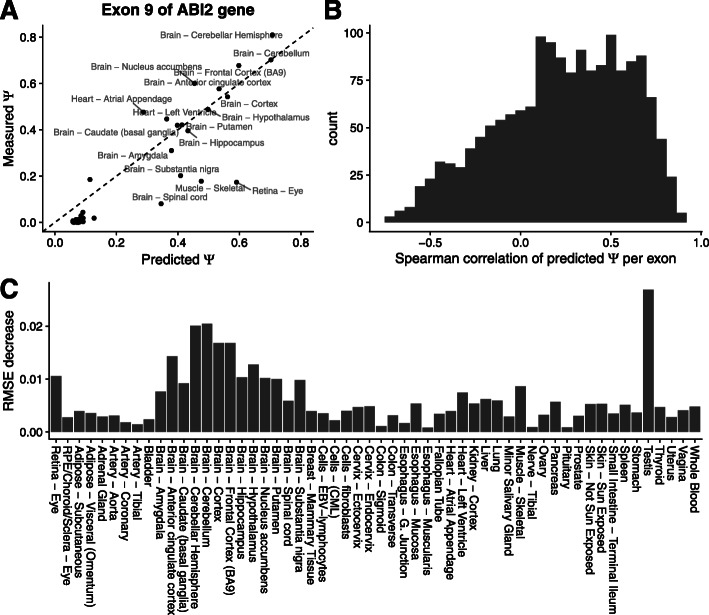
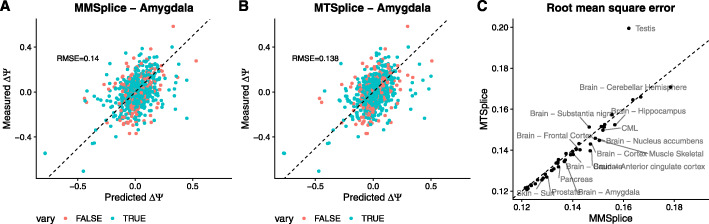
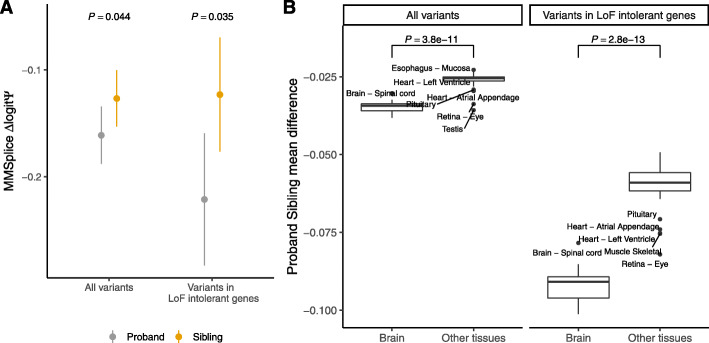
We develop the free and open-source model Multi-tissue Splicing (MTSplice) to predict the effects of genetic variants on splicing of cassette exons in 56 human tissues. MTSplice combines MMSplice, which models constitutive regulatory sequences, with a new neural network that models tissue-specific regulatory sequences. MTSplice outperforms MMSplice on predicting tissue-specific variations associated with genetic variants in most tissues of the GTEx dataset, with largest improvements on brain tissues. Furthermore, MTSplice predicts that autism-associated de novo mutations are enriched for variants affecting splicing specifically in the brain. We foresee that MTSplice will aid interpreting variants associated with tissue-specific disorders.


Conflict of interest statement

The authors declare that they have no competing interests.

Figures

Fig. 1
Fig. 1
Differential splicing of alternatively spliced exons across tissues. a Histogram of the number of tissues with differential splicing (Ψ deviating by at least 10% from the exon-average Ψ). Overall, 4398 exons (light blue) are differentially spliced in at least 10 tissues. b. Heatmap of Ψ for the 4398 exons that are differentially spliced in at least 10 tissues with exons (columns) and tissues (rows) sorted by hierarchical clustering. Ψ is color-coded by a gradient from blue (0) to red (1) via white (0.5). Gray entries are missing values and occur in tissues for which the corresponding gene is not expressed. Hierarchical clustering was applied after imputing missing values with row means
Fig. 2
Fig. 2
Tissue-specific variations of differential splicing associated with genetic variants in the GTEx dataset. a Tissue-specific differential Ψ associated with a genetic variant (y-axis) against differential Ψ associated with a genetic variant averaged across tissues (x-axis). Effects were estimated using homozygous donors (b). Proportion of data points shown in a (y-axis) for every cutoff on the deviation from the averaged Ψ across tissues (x-axis, decreasing)
Fig. 3
Fig. 3
Model architecture to predict tissue-specific percent spliced-in. The model TSplice consists of one convolution layer with 64 length-9 filters capturing sequence elements from one-hot encoded input sequences. This is followed by two spline transformation layers modulating the effect of sequence elements depending on their position relative to the acceptor splice sites (leftmost layer) and the donor (rightmost layer). The outputs of the two spline transformation layers are concatenated, and global average pooling is applied along the sequence dimension. This is then followed by feeding two consecutive fully connected layers. The last fully connected layer outputs a 56-dimension vector which are the predicted log odds ratios of tissue-specific Ψ versus tissue-averaged Ψ for the 56 tissues of the ASCOT dataset. Natural scale tissue-specific Ψ are obtained by adding predicted odds ratios with measured tissue-averaged Ψ on the logit scale. Batch normalization was used after all layers with trainable parameters except the last fully connected layer. In total, the model has 8024 trainable parameters
Fig. 4
Fig. 4
Evaluating TSplice on predicting tissue-associated differential splicing. a Predicted versus measured tissue-associated differential splicing for the retina eye tissue, representative of the typical performance of our model. b Spearman correlation between predicted and measured tissue-associated differential splicing for all tissues. c Distribution of Spearman correlations between predicted and measured tissue-associated differential splicing for brain tissues and non-brain tissues
Fig. 5
Fig. 5
Evaluating TSplice on predicting tissue-specific Ψ. a. Predicted (x-axis) versus measured (y-axis) Ψ for the 9th exon of gene ABI2 across 56 tissues. b. Histogram of the Spearman correlation of the predicted versus measured Ψ for 1621 test exons across 56 tissues. c Root-mean-square error decreases between the TSplice model and the baseline model (predicted with the mean Ψ across tissues)
Fig. 6
Fig. 6
Comparing MMSplice and MTSplice on predicting variant-associated differential splicing. a, b Predicted (x-axis) versus measured (y-axis) ΔΨ in amygdala between alternative and reference alleles for variants with between-tissue splicing variation (orange) and other variants (cyan) for MMSplice (a) and MTSplice (b). c Root-mean-square error of MTSplice predictions (y-axis) against MMSplice predictions (x-axis) for exons with between-tissue splicing variations (the cyan dots in a). Each dot represents one of the 51 GTEx tissues with at least 10 measured variant effects. MTSplice improves for 39 tissues, yet mildly, over MMSplice. Tissues for which the RMSE differences larger than 0.002 are labeled with text
Fig. 7
Fig. 7
Brain-specific mutational burden on splicing in ASD. a Tissue-agnostic variant effect prediction with MMSplice. Splice-region de novo mutations (n = 3884, “Materials and methods” section) of the proband group (gray) have significantly lower predicted ΔlogitΨ according to MMSplice compared to those of the unaffected sibling group (orange). The effect size is larger for variants in LoF-intolerant genes (n = 1081). Shown are the means and standard 95% confidence intervals. P values from one-sided Wilcoxon test. b. Tissue-specific variant effect prediction with MTSplice. Distribution of effect size (difference of average ΔlogitΨ for proband versus control siblings de novo mutations) for brain tissues (right boxes) and other tissues (left boxes), and for all de novo mutations (left panel) or de novo mutations in LoF-intolerant genes (right panel) with MTSplice. Individual tissue plots are shown Additional file 1: Fig. S8. The predicted effect sizes are more pronounced for brain tissues

Similar articles

Cited by

References

    1. Pan Q, Shai O, Lee LJ, Frey BJ, Blencowe BJ. Deep surveying of alternative splicing complexity in the human transcriptome by high-throughput sequencing. Nat Genet. 2008;40(12):1413–5. doi: 10.1038/ng.259. - DOI - PubMed
    1. Castle JC, Zhang C, Shah JK, Kulkarni AV, Kalsotra A, Cooper TA, Johnson JM. Expression of 24,426 human alternative splicing events and predicted cis regulation in 48 tissues and cell lines. Nat Genet. 2008;40(12):1416–25. doi: 10.1038/ng.264. - DOI - PMC - PubMed
    1. Wang ET, Sandberg R, Luo S, Khrebtukova I, Zhang L, Mayr C, Kingsmore SF, Schroth GP, Burge CB. Alternative isoform regulation in human tissue transcriptomes. 2008. 10.1038/nature07509. - PMC - PubMed
    1. Matera AG, Wang Z. A day in the life of the spliceosome. Nat Rev Mol Cell Biol. 2014;15(2):108–21. doi: 10.1038/nrm3742. - DOI - PMC - PubMed
    1. Ule J, Blencowe BJ. Alternative splicing regulatory networks: functions, mechanisms, and evolution. Mol Cell. 2019;76(2):329–45. doi: 10.1016/j.molcel.2019.09.017. - DOI - PubMed

Publication types

LinkOut - more resources