. 2021 Mar 31;7(14):eabb0799.
doi: 10.1126/sciadv.abb0799. Print 2021 Mar.

Increasing brain palmitoylation rescues behavior and neuropathology in Huntington disease mice

Affiliations

Increasing brain palmitoylation rescues behavior and neuropathology in Huntington disease mice

Amandine Virlogeux et al. Sci Adv. .

Abstract

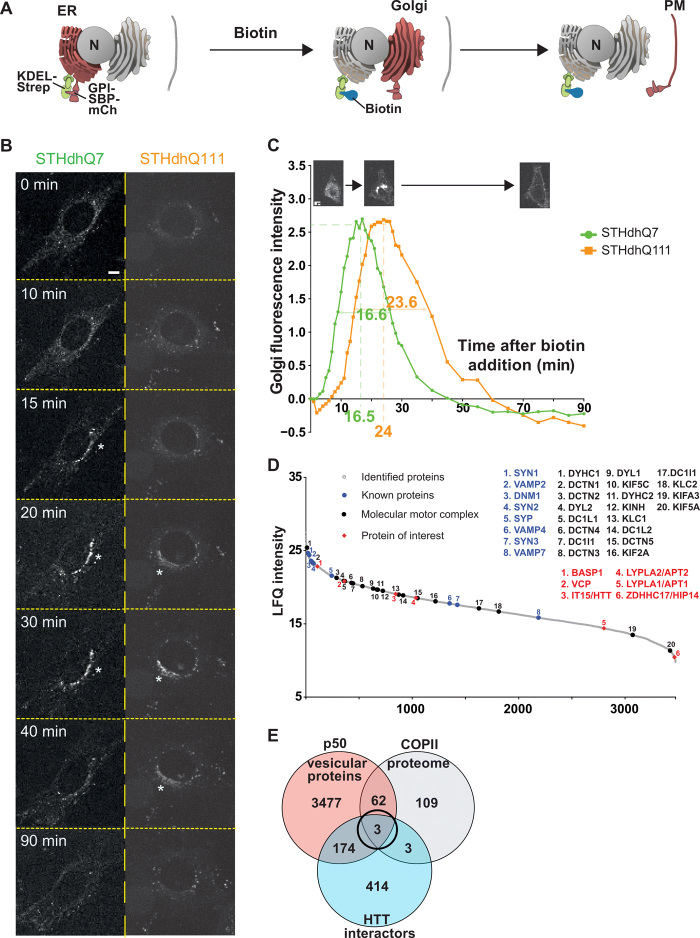
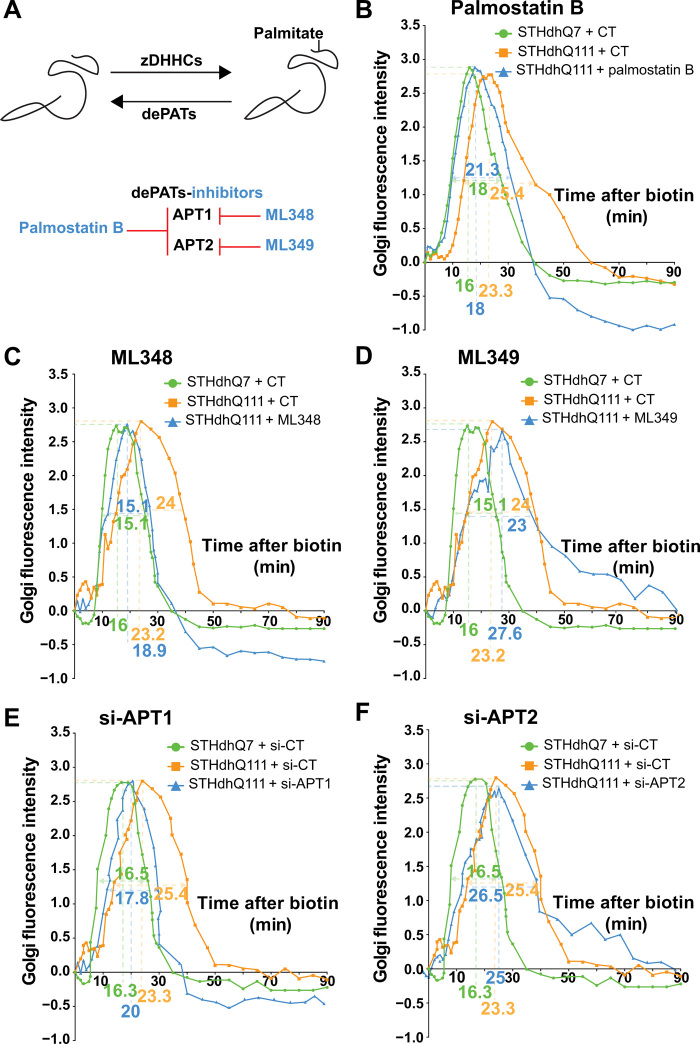
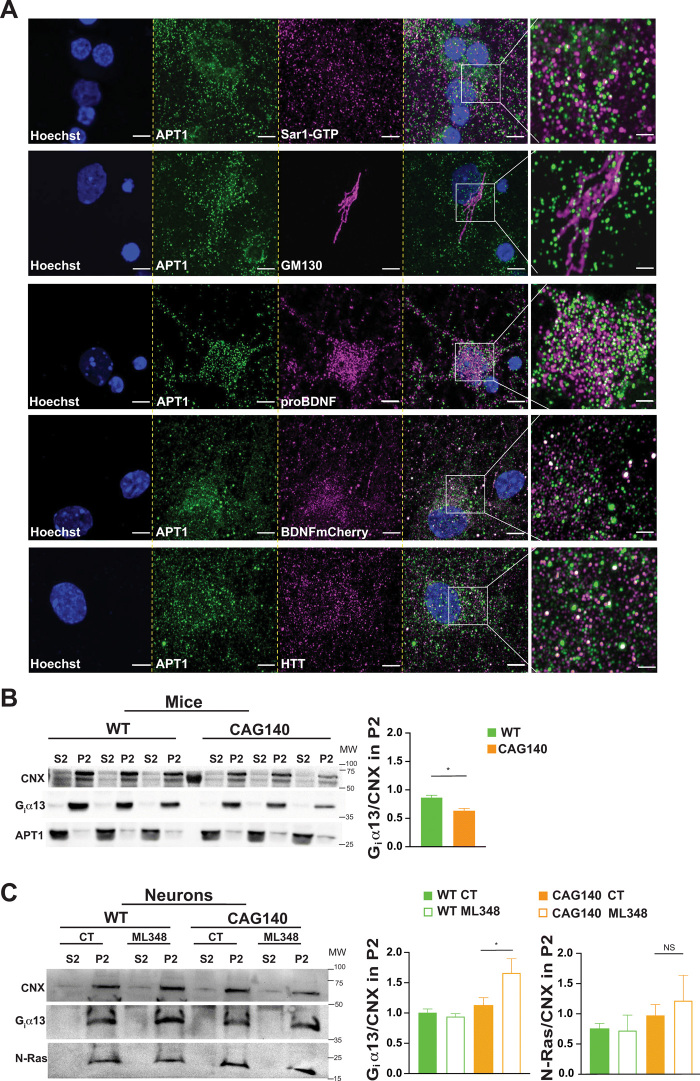
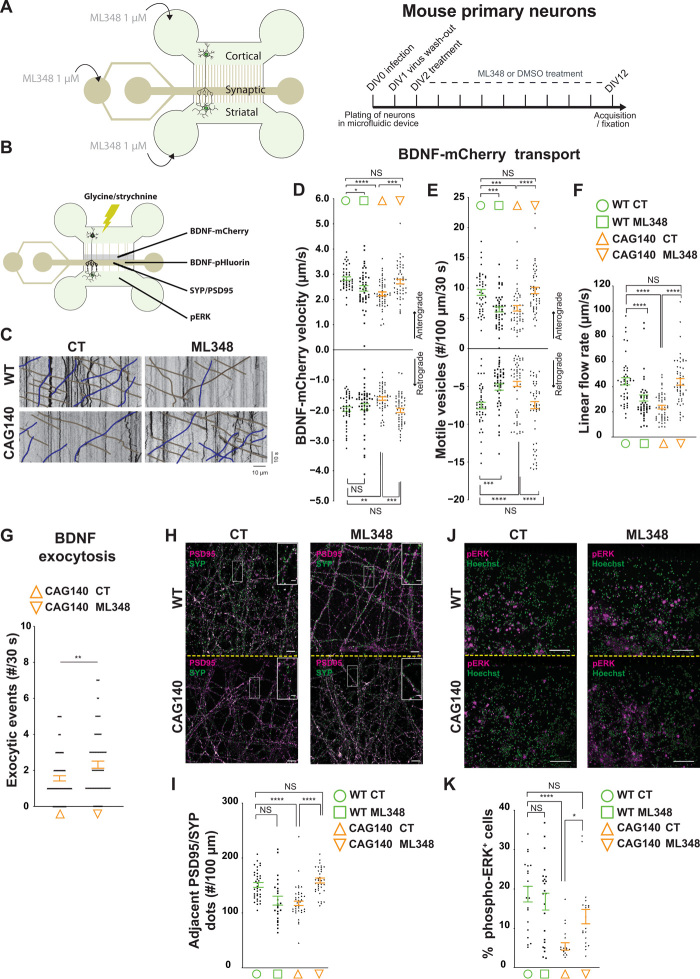
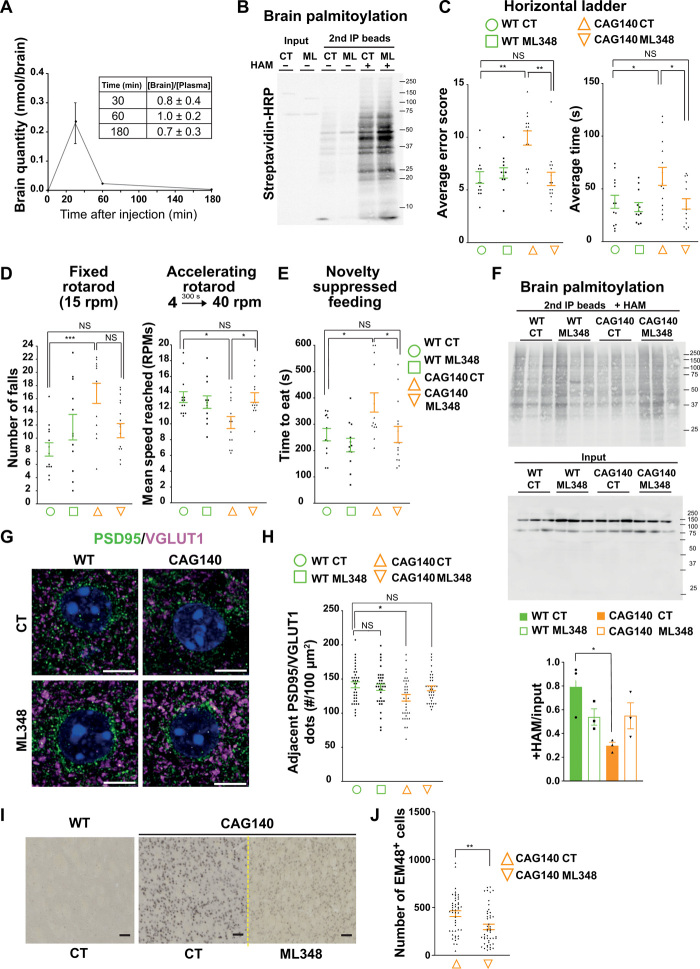
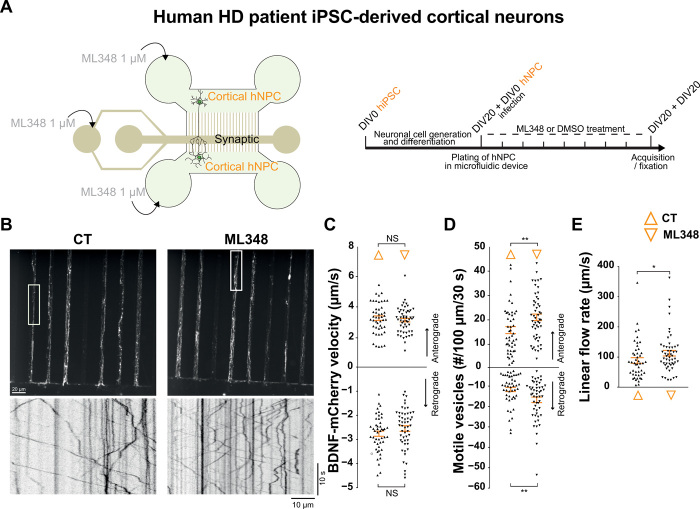
Huntington disease (HD) damages the corticostriatal circuitry in large part by impairing transport of brain-derived neurotrophic factor (BDNF). We hypothesized that improving vesicular transport of BDNF could slow or prevent disease progression. We therefore performed selective proteomic analysis of vesicles transported within corticostriatal projecting neurons followed by in silico screening and identified palmitoylation as a pathway that could restore defective huntingtin-dependent trafficking. Using a synchronized trafficking assay and an HD network-on-a-chip, we found that increasing brain palmitoylation via ML348, which inhibits the palmitate-removing enzyme acyl-protein thioesterase 1 (APT1), restores axonal transport, synapse homeostasis, and survival signaling to wild-type levels without toxicity. In human HD induced pluripotent stem cell-derived cortical neurons, ML348 increased BDNF trafficking. In HD knock-in mice, it efficiently crossed the blood-brain barrier to restore palmitoylation levels and reverse neuropathology, locomotor deficits, and anxio-depressive behaviors. APT1 and its inhibitor ML348 thus hold therapeutic interest for HD.


Figures

Fig. 1
Fig. 1. Screening for modifiers of intracellular trafficking in Huntington disease.
(A) Schematic of the RUSH system KDEL-GPI-mCherry. GPI is fused with SBP and a fluorescent tag m-Cherry (mCh) (Reporter, red). The reporter is retained in the ER thanks to the Hook part (KDEL fused to streptavidin, green). The addition of biotin (blue) releases the reporter and allows trafficking of GPI-SBP-mCherry through the secretory pathway (Golgi and plasma membrane). (B) Localization of GPI-KDEL-mCherry at different time points after addition of biotin to STHdhQ7 and STHdhQ111 cells (scale bar, 10 μm). (C) Quantification of Golgi fluorescence in STHdhQ7 cells (green) and STHdhQ111 cells (orange). The green and orange numbers beneath the x axis and within the curves represent, respectively, the peak of Golgi fluorescence and the time to cross the Golgi in STHdhQ7 (N = 46) and STHdhQ111 cells (N = 54). (D) Proteins identified in the motile vesicle protein fraction were ranked by intensity and plotted according to their relative abundance (gray dots). Molecular motors and associated proteins (back dots) as well as previously identified vesicular proteins (blue dots) are among the most abundant proteins. HTT, HTT-interacting proteins present in the COPII proteome [brain abundant membrane attached signal protein 1 (BASP1), valosin-containing protein (VCP), and ZDHHC17], and APTs were identified as vesicular residents (red diamonds). (E) Venn diagram showing the overlap of proteomic (orange) and in silico screening of the HTT interactome (blue) and the COPII secretory pathway (gray) that identified three vesicular residents.
Fig. 2
Fig. 2. Inhibiting APT1 restores intracellular dynamics in Huntington disease cells.
(A) Schematic representation of substrate palmitoylation and depalmitoylation induced by zDHHCs and dePATs, respectively (top). Main dePATs and their inhibitors (bottom). (B to F) Effect of pharmacological or genetic inhibition of acyl-protein thioesterases on intracellular dynamics in HD striatal cells. (B) Quantification of Golgi fluorescence in STHdhQ7 cells (green, N = 46), STHdhQ111 cells (orange, N = 46), and STHdhQ111 cells treated for 1 hour with palmostatin B at 10 μM (blue, N = 39). (C) as in (B) with STHdhQ111 cells treated for 1 hour with ML348 at 10 μM (blue, N = 27) (N = 22 STHdhQ7 CT, N = 27 STHdhQ111 CT). (D) as in (B) with STHdhQ111 cells treated for 1 hour with ML349 at 10 μM (blue, N = 23) (N = 22 STHdhQ7 CT and N = 27 STHdhQ111 CT). (E) Quantification of Golgi fluorescence in STHdhQ7 cells si-CT (green, N = 25), STHdhQ111 cells si-CT (orange, N = 26), and STHdhQ111 cells si-APT1 (blue, N = 26). (F) as in (E) with STHdhQ111 cells treated with si-APT2 (blue, N = 27) (N = 25 STHdhQ7 si-CT and N = 26 STHdhQ111 si-CT). The numbers beneath the x axis and under the curves represent, respectively, the peak of Golgi fluorescence and the time to cross the Golgi in the different conditions (represented by green, orange, and blue) N = 3 independent cultures per treatment or condition.
Fig. 3
Fig. 3. APT1 is expressed in the neuronal secretory pathway.
(A) Confocal images of endogenous APT1 in cortical neurons showing colocalization of the enzyme with proteins related to COPII (Sar1-GTP), Golgi apparatus (GM130), secreted dense core vesicles (proBDNF and BDNF-mCherry), and HTT (4C8 mAb). Nuclei were counterstained with Hoechst (scale bars, 5 μm). For each staining, the images were zoomed five times in a specific region of interest and processed by an Airyscan detector (inset scale bar, 2 μm). (B) Subcellular fractionation of three independent WT and CAG140 mouse brains showing the decrease in ER/Golgi (P2) fractions of the APT1 substrate (Giα13) (graph shows the mean of three brains per condition; *P < 0.05). (C) Primary cortical neurons from WT and CAG140 mice were treated with dimethyl sulfoxide (DMSO) or 1 μM ML348 for 4 hours and then the cytosolic (S2) and ER/Golgi (P2) were analyzed by SDS-PAGE. ML348 treatment increases Giα13 in the P2 fractions while having no effect on N-Ras (N = 3 independent cultures, *P < 0.05; one representative experiment is shown; NS, not significant).
Fig. 4
Fig. 4. Pharmacological inhibition of APT1 restores HD corticostriatal network.
(A) Schematic representation of the microfluidic device with indications of drug treatment. (B) Indications of the video-recording zone for BDNF-mCherry–containing vesicles and BDNF exocytosis and the acquisition zone for SYP/PSD95 and phospho–extracellular signal–regulated kinase (pERK) stainings. (C) Representative kymographs showing BDNF-mCherry axonal trafficking. (D) Anterograde and retrograde velocities of BDNF-mCherry vesicles (anterograde: F3,184 = 2.574, *P < 0.05, ***P < 0.001, ****P < 0.0001; retrograde: H3 = 18.94 P = 0.0003 **P < 0.01, ***P < 0.001). (E) Number of anterograde and retrograde vesicles trafficking along 100 μm of axon (anterograde: H3 = 35.57, P < 0.0001, ***P < 0.001, ****P < 0.0001; retrograde: H3 = 41.27, P < 0.0001, ***P < 0.001, ****P < 0.0001). (F) Linear flow rate (H3 = 57.61, P < 0.0001, ****P < 0.0001). (G) ML348 treatment increases BDNF exocytosis at the synapse (**P < 0.01). (H) Airyscan confocal images of PSD95 (magenta) and SYP (green) within the synaptic compartment (scale bar, 5 μm; inset scale bar, 1 μm). (I) Quantification of the number of adjacent PSD95 and SYP punctates along 100-μm neuritis (F3,128 = 2.327, ****P < 0.0001). (J) pERK (magenta) and Hoechst (green) staining within the striatal chamber (scale bar, 50 μm). (K) Quantification of pERK immunopositive cells (H3 = 26.97, P < 0.0001, *P < 0.05, ****P < 0.0001). Error bars indicate SEM.
Fig. 5
Fig. 5. APT1 inhibition via ML348 rescues behavioral symptoms, brain palmitoylation, and neuropathology in HD mice.
(A) Pharmacokinetic analysis of brains (N = 3). (B) ABE assay for palmitoylated proteins. (C to E) Motor coordination and nonmotor behavior in HD mice. (C) Mean error score and time to cross the ladder from three trials (error score: H3 = 17.07, P = 0.0007, *P < 0.01; time: F3,50 = 4.478, *P < 0.05). (D) Mean number of falls from the fixed rotarod (F3,50 = 2.020, ***P < 0.001) and mean speed reached from the accelerating one (F3,50 = 0.4539, *P < 0.05). (E) Latency to eat in a 10-min test (F3,49 = 0.7710, *P < 0.05). (F) Immunoprecipitation of palmitoylated proteins in CAG140 treated mice (upper blot). Quantification of palmitoylated proteins relative to input (lower blot). (G) Airyscan confocal images of PSD95 (green), VGLUT1 (magenta), and Hoechst (blue) (scale bars, 5 μm). (H) Quantification of PSD95/VGLUT1 adjacent dots (F3,140 = 3.65, *P < 0.05). (I) Mutant HTT nuclear accumulation in CAG140-treated mice. EM48 immunostaining of striata from WT and CAG140 mice after ML348 or DMSO injection (scale bars, 50 μm). (J) Quantification of EM48-positive cells (t test, **P < 0.01). Error bars indicate SEM.
Fig. 6
Fig. 6. ML348 increases BDNF trafficking in hiPSC-derived cortical neurons from patients with HD.
(A) Schematic representation of the microfluidic device used to reconstruct corticocortical network with indications of drug treatment. Human HD iPSC-derived cortical neuron precursors were plated in the pre- and postsynaptic compartments. ML348 (1 μM) or DMSO was perfused within the three compartments from DIV13 to DIV20 (right). (B) z-projection and the associated kymographs showing BDNF-mCherry axonal trafficking in hiPSC-derived cortical neurons treated with DMSO (CT) or ML348 (scale bar, 20 μm). (C) Anterograde and retrograde velocities of BDNF-mCherry vesicles (N indicates the number of axons per condition in at least two independent experiments; N = 47 CT and N = 52 ML348; anterograde: P = 0.4892, retrograde: P = 0.1776 t test). (D) Number of anterograde and retrograde vesicles trafficking along 100 μm of axon (anterograde: P = 0.0068, retrograde: P = 0.0026, Mann-Whitney; **P < 0.01). (E) Linear flow rate (P = 0.0313, Mann-Whitney; *P < 0.05). Error bars indicate SEM.

References

    1. Ross C. A., Tabrizi S. J., Huntington’s disease: From molecular pathogenesis to clinical treatment. Lancet Neurol. 10, 83–98 (2011). - PubMed
    1. Saudou F., Humbert S., The biology of huntingtin. Neuron 89, 910–926 (2016). - PubMed
    1. Langfelder P., Cantle J. P., Chatzopoulou D., Wang N., Gao F., Al-Ramahi I., Lu X. H., Ramos E. M., El-Zein K., Zhao Y., Deverasetty S., Tebbe A., Schaab C., Lavery D. J., Howland D., Kwak S., Botas J., Aaronson J. S., Rosinski J., Coppola G., Horvath S., Yang X. W., Integrated genomics and proteomics define huntingtin CAG length-dependent networks in mice. Nat. Neurosci. 19, 623–633 (2016). - PMC - PubMed
    1. Al-Ramahi I., Lu B., Di Paola S., Pang K., de Haro M., Peluso I., Gallego-Flores T., Malik N. T., Erikson K., Bleiberg B. A., Avalos M., Fan G., Rivers L. E., Laitman A. M., Diaz-Garcia J. R., Hild M., Palacino J., Liu Z., Medina D. L., Botas J., High-throughput functional analysis distinguishes pathogenic, nonpathogenic, and compensatory transcriptional changes in neurodegeneration. Cell Syst. 7, 28–40.e4 (2018). - PMC - PubMed
    1. Becanovic K., Norremolle A., Neal S. J., Kay C., Collins J. A., Arenillas D., Lilja T., Gaudenzi G., Manoharan S., Doty C. N., Beck J., Lahiri N., Portales-Casamar E., Warby S. C., Connolly C., De Souza R. A.; REGISTRY Investigators of the European Huntington’s Disease Network, Tabrizi S. J., Hermanson O., Langbehn D. R., Hayden M. R., Wasserman W. W., Leavitt B. R., A SNP in the HTT promoter alters NF-κB binding and is a bidirectional genetic modifier of Huntington disease. Nat. Neurosci. 18, 807–816 (2015). - PubMed

Publication types

Substances