. 2021 Jul;70(7):1253-1265.
doi: 10.1136/gutjnl-2020-323826. Epub 2021 Mar 31.

Alterations in the human oral and gut microbiomes and lipidomics in COVID-19

Affiliations

Alterations in the human oral and gut microbiomes and lipidomics in COVID-19

Zhigang Ren et al. Gut. 2021 Jul.

Abstract

Objective: To characterise the oral microbiome, gut microbiome and serum lipid profiles in patients with active COVID-19 and recovered patients; evaluate the potential of the microbiome as a non-invasive biomarker for COVID-19; and explore correlations between the microbiome and lipid profile.

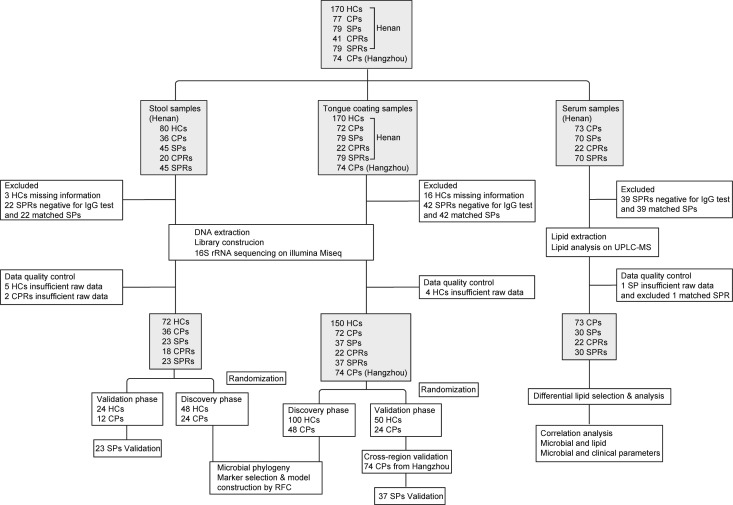
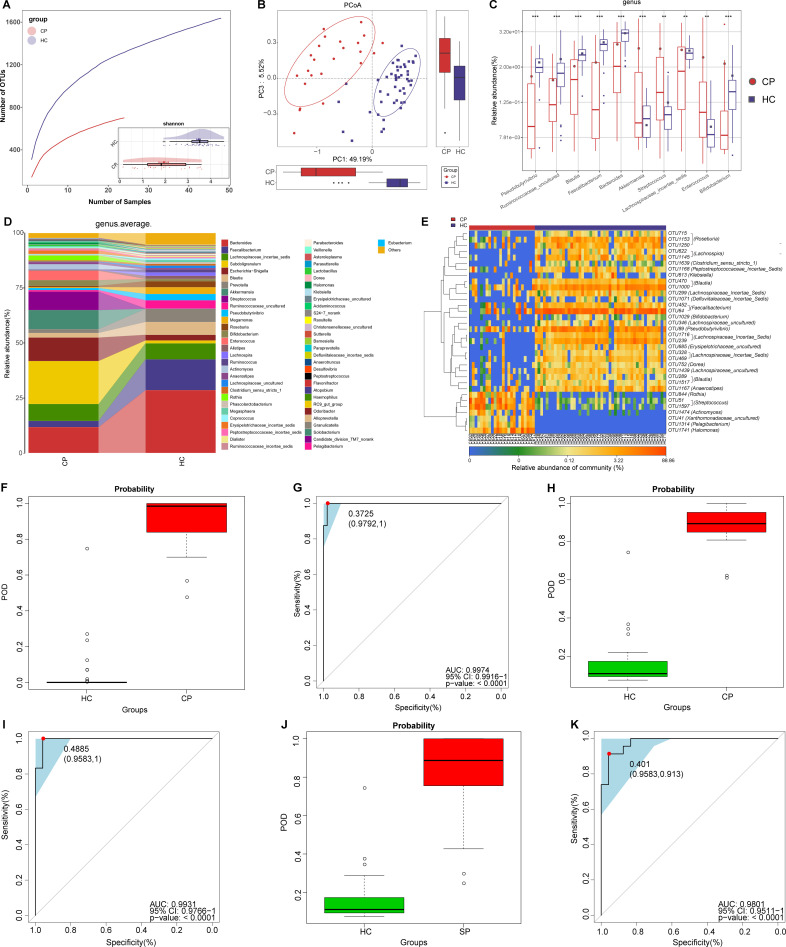
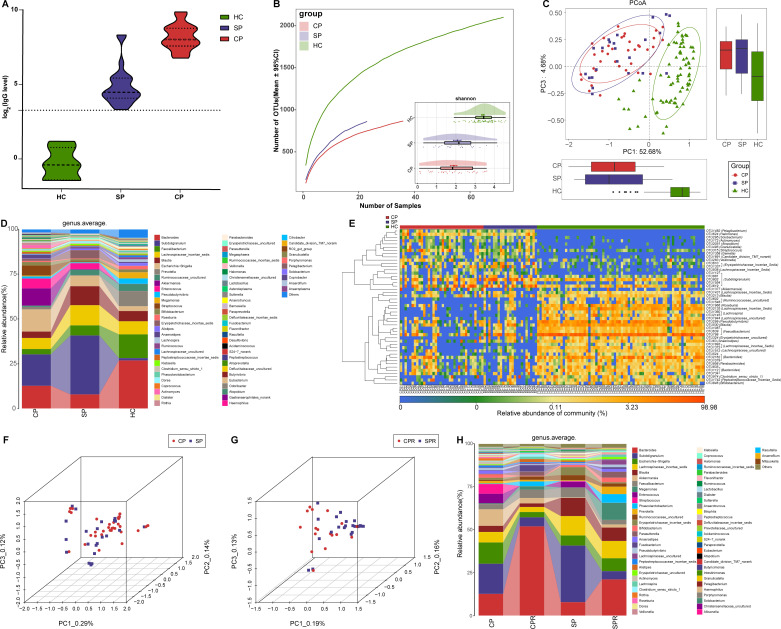
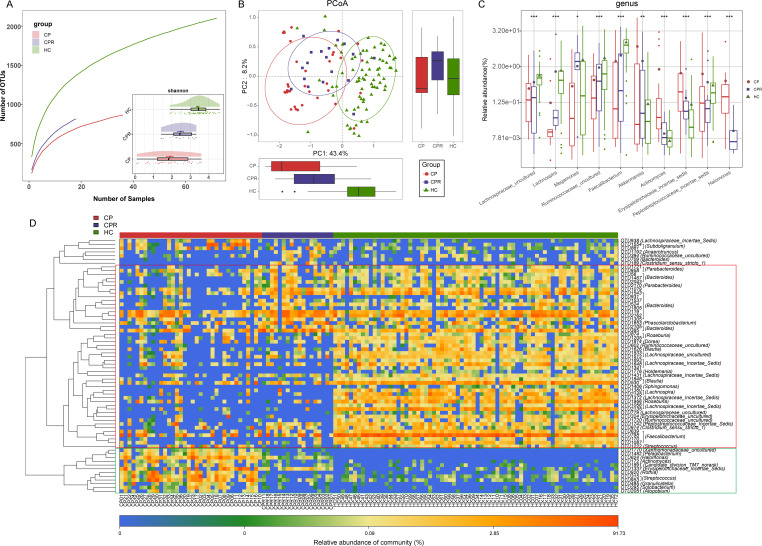
Design: We collected and sequenced 392 tongue-coating samples, 172 faecal samples and 155 serum samples from Central China and East China. We characterised microbiome and lipid molecules, constructed microbial classifiers in discovery cohort and verified their diagnostic potential in 74 confirmed patients (CPs) from East China and 37 suspected patients (SPs) with IgG positivity.

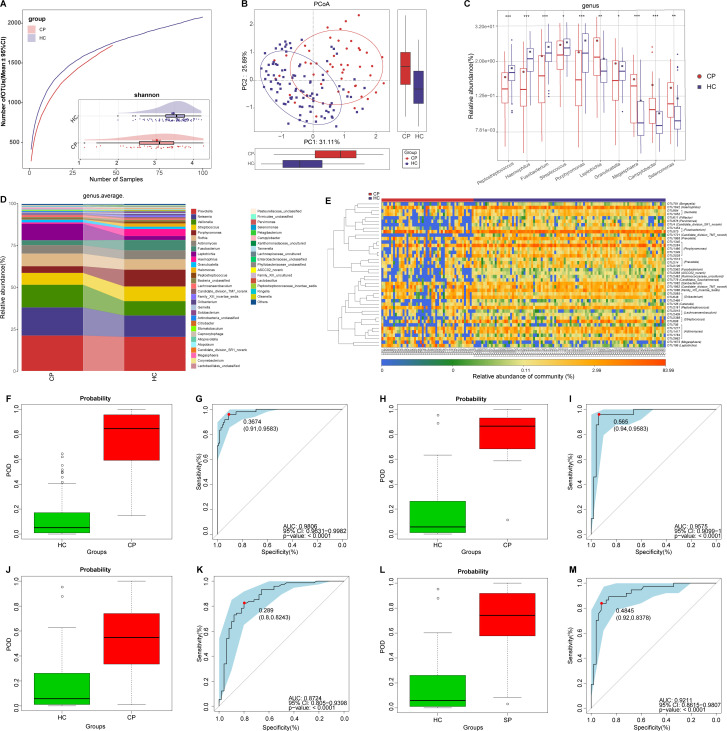
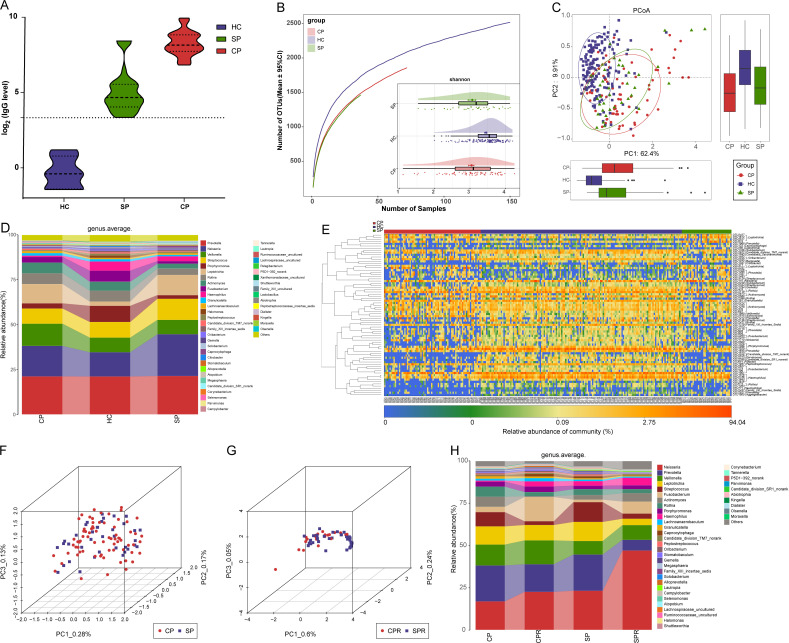
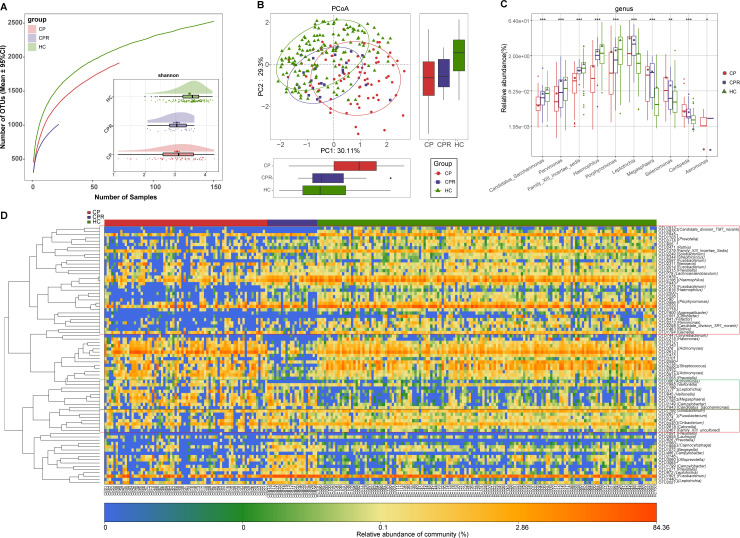
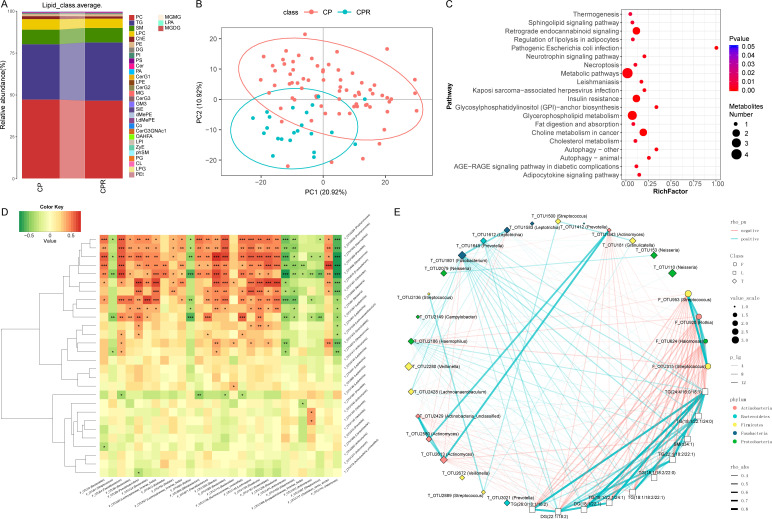
Results: Oral and faecal microbial diversity was significantly decreased in CPs versus healthy controls (HCs). Compared with HCs, butyric acid-producing bacteria were decreased and lipopolysaccharide-producing bacteria were increased in CPs in oral cavity. The classifiers based on 8 optimal oral microbial markers (7 faecal microbial markers) achieved good diagnostic efficiency in different cohorts. Importantly, diagnostic efficacy reached 87.24% in the cross-regional cohort. Moreover, the classifiers successfully diagnosed SPs with IgG antibody positivity as CPs, and diagnostic efficacy reached 92.11% (98.01% of faecal microbiome). Compared with CPs, 47 lipid molecules, including sphingomyelin (SM)(d40:4), SM(d38:5) and monoglyceride(33:5), were depleted, and 122 lipid molecules, including phosphatidylcholine(36:4p), phosphatidylethanolamine (PE)(16:0p/20:5) and diglyceride(20:1/18:2), were enriched in confirmed patients recovery.

Conclusion: This study is the first to characterise the oral microbiome in COVID-19, and oral microbiomes and lipid alterations in recovered patients, to explore their correlations and to report the successful establishment and validation of a diagnostic model for COVID-19.

Keywords: COVID-19; intestinal microbiology; lipid metabolism.


Conflict of interest statement

Competing interests: None declared.

Figures

Figure 1
Figure 1
Study design and flow diagram. A total of 957 samples of 3 types from Central China and East China were collected prospectively, including 496 tongue-coating samples, 226 faecal samples and 235 serum samples. After rigorous inclusion and exclusion criteria, 719 samples were included for further analysis, including 392 tongue-coating samples (72 CPs, 37 SPs, 22 CPRs, 37 paired SPRs and 150 HCs from Henan and 74 CPs from Hangzhou), 172 faecal samples (36 CPs, 23 SPs, 18 CPRs, 23 SPRs and 72 HCs from Henan) and 155 serum samples (73 CPs, 30 SPs, 22 CPRs and 30 SPRs). Oral and faecal samples were sequenced using 16S rRNA MiSeq to characterise the microbiome and construct diagnostic model, and serum samples were detected using UPLC-MS to characterise lipid molecules. HCs, healthy controls; CPs, confirmed patients; SPs, suspected patients; CPRs, confirmed patients who recovered; RFC, random forest classifier; SPRs, suspected patients who recovered; UPLC-MS, ultra-performance liquid chromatography-mass spectrometry.
Figure 2
Figure 2
Non-invasive diagnostic model for COVID-19 based on the oral microbiome. (A) Rarefaction analysis between the number of samples and the number of OTUs. As the number of samples increased, the number of OTUs approached saturation in CPs (n=48) and HCs (n=100). Compared with the HCs, the number of OTUs in CPs was decreased. As estimated by the Shannon index, oral microbial diversity was significantly decreased in CPs compared with HCs. (B) The PCoA based on OTU distribution showed that the oral taxonomic composition was significantly different between both groups. (C) Compared with HCs, five genera were significantly enriched, while five genera were significantly reduced in CPs. (D) Average compositions and relative abundance of the bacterial community in both groups at the genus level. (E) Heatmap of the relative abundances of differential OTUs for each sample in both groups. The POD value was significantly increased in CPs compared with HCs, and achieved good diagnostic efficacy in the discovery cohort (F and G), the validation cohort (H and I) and the independent cohort (J and K). Compared with HCs, the POD value was significantly increased in SPs (L), achieving an AUC value of 0.9211 (M). *P<0.05, **p<0.01, ***p<0.001. AUC, area under the curve; CPs, confirmed patients; HCs, healthy controls; OTUs, operational taxonomy units; PCoA, principal coordinate analysis; POD, probability of disease; SPs, suspected patients. Centerline, median; box limits, upper and lower quartiles; circle or square symbol, mean; error bars, 95% CI.
Figure 3
Figure 3
Oral microbial characterisation among CPs, SPs and HCs. (A) Levels of antibodies against SARS-CoV-2 in CPs (n=22), SPs (n=37) and HCs (n=6) during recovery. The positive judgement value of the kit was 10 U/mL (value >10 U/mL was defined as positive, and value <10 U/mL was defined as negative). The antibody levels in the figure were calculated as log2(value). (B) Rarefaction analysis between the number of samples and the number of OTUs. As the number of samples increased, the number of OTUs approached saturation in CPs (n=72), SPs (37) and HCs (n=150). Compared with the HCs, the number of OTUs in CPs and SPs was decreased. As estimated by the Shannon index, the oral microbial diversity of CPs and SPs was similar but significantly decreased compared with that of the HCs. (C) The PCoA based on OTU distribution showed that the oral microbial communities in the CPs and SPs were similar but significantly different from those in the HCs. (D) Average compositions and relative abundances of the bacterial communities in the three groups at the genus level. (E) Heatmap for the relative abundances of differential OTUs for each sample in the three groups. The PCoA showed that there was no significant difference in the oral microbiome distribution between CPs and SPs (F) or between CPRs and SPRs (G). (H) Average compositions and relative abundance of the bacterial community in the four groups at the genus level. CPs, confirmed patients; CPRs, confirmed patients who recovered; HCs, healthy controls; OTUs, operational taxonomic units; PCoA, principal coordinate analysis; SPs, suspected patients; SPRs suspected patients who recovered. Centerline, median; box limits or upper and lower lines, upper and lower quartiles; circle or square symbol, mean; error bars, 95% CI.
Figure 4
Figure 4
Oral microbial restoration along with recovery of patient with COVID-19. (A) Rarefaction analysis between the number of samples and the number of OTUs. As the number of samples increased, the number of OTUs approached saturation in CPs (n=72), CPRs (22) and HCs (n=150). Compared with the HCs, the number of OTUs in CPs and CPRs was decreased. As estimated by the Shannon index, oral microbial diversity in the CPRs was similar to that in the CPs but significantly decreased compared with that in the HCs. (B) The PCoA based on OTU distribution showed that the oral microbial communities in the CPRs were different from those in the CPs and HCs. (C) Along with the recovery of COVID-19, the relative abundances of five genera gradually increased and were significantly different among the three groups, while the abundances of five genera gradually decreased and were significantly different among the three groups. (D) Heatmap for the relative abundances of differential OTUs for each sample in the three groups. The red box represents a gradual increase in abundance of OTUs from left to right and the green box represents a gradual decrease in abundance of OTUs from left to right. *P<0.05, **p<0.01, ***p<0.001. CPs, confirmed patients; CPRs, confirmed patients who recovered; HCs, healthy controls; OTUs, operational taxonomic units; PCoA, principal coordinate analysis. Centerline, median; box limits, upper and lower quartiles; circle or square symbol, mean; error bars, 95% CI.
Figure 5
Figure 5
Gut microbiome as non-invasive diagnostic model for COVID-19. (A) Rarefaction analysis between the number of samples and the number of OTUs. As the number of samples increased, the number of OTUs approached saturation in CPs (n=24) and HCs (n=48). Compared with the HCs, the number of OTUs in CPs was decreased. As estimated by the Shannon index, gut microbial diversity was significantly decreased in CPs compared with HCs. (B) The PCoA based on OTU distribution showed that the gut taxonomic composition was significantly different between both groups. (C) Average compositions and relative abundances of the bacterial communities in both groups at the genus level. (D) Compared with HCs, five genera were significantly enriched, while five genera were significantly reduced in CPs. (E) Heatmap for the relative abundances of differential OTUs for each sample in both groups. The POD value was significantly increased in CPs compared with HCs, achieving good diagnostic efficacy in the discovery cohort (F and G), validation cohort (H and I). Compared with HCs, the POD value was significantly increased in SPs (J), achieving an AUC value of 0.9801 (K). **P<0.01, ***p<0.001. AUC, area under the curve; CPs, confirmed patients; HCs, healthy controls; OTUs, operational taxonomy units; PCoA, principal coordinate analysis; POD, probability of disease; SPs, suspected patients. Centerline, median; box limits, upper and lower quartiles; circle or square symbol, mean; error bars, 95% CI.
Figure 6
Figure 6
Gut microbial alterations among CPs, SPs and HCs. (A) Levels of antibodies against SARS-CoV-2 in CPs (n=18), SPs (n=23) and HCs (n=6) during recovery. The positive judgement value of the kit was 10 U/mL (a value >10 U/mL was defined as positive, and a value <10 U/mL was defined as negative). The antibody levels in the figure were calculated as log2(value). (B) Rarefaction analysis between the number of samples and the number of OTUs. As the number of samples increased, the number of OTUs approached saturation in CPs (n=36), SPs (n=23) and HCs (n=72). Compared with the HCs, the number of OTUs in CPs and SPs was decreased. As estimated by the Shannon index, the faecal microbial diversity of CPs and SPs was similar but significantly decreased compared with that of the HCs. (C) The PCoA based on OTU distribution showed that the gut microbial communities in the CPs and SPs were similar but significantly different from those in the HCs. (D) Average compositions and relative abundances of the bacterial communities in the three groups at the genus level. (E) Heatmap of the relative abundances of differential OTUs for each sample in the three groups. The PCoA showed that there was no significant difference in the faecal microbiome distribution between CPs and SPs (F) or between CPRs and SPRs (G). (H) Average compositions and relative abundances of the bacterial communities in the four groups at the genus level. HCs, healthy controls; CPs, confirmed patients; SPs, suspected patients; OTUs, operational taxonomy units; PCoA, principal coordinate analysis; CPRs, confirmed patients who recovered; SPRs, suspected patients who recovered. Centerline, median; box limits or upper and lower lines, upper and lower quartiles; circle or square symbol, mean; error bars, 95% CI.
Figure 7
Figure 7
Gut microbial restoration along with recovery of patients with COVID-19. (A) Rarefaction analysis between the number of samples and the number of OTUs. As the number of samples increased, the number of OTUs approached saturation in CPs (n=36), CPRs (n=18) and HCs (n=72). Compared with the HCs, the number of OTUs in CPs and CPRs was decreased. As estimated by the Shannon index, faecal microbial diversity in CPRs was increased versus CPs but significantly decreased versus HCs. (B) The PCoA based on OTU distribution showed that the faecal microbial communities in the CPRs were different from those in the CPs and HCs. (C) Along with the recovery of COVID-19, the relative abundances of five genera gradually increased and were significantly different among the three groups, while the abundances of five genera gradually decreased and were significantly different among the three groups. (D) Heatmap of the relative abundances of differential OTUs for each sample in the three groups. The red box represents a gradual increase in abundance of OTUs from left to right and the green box represents a gradual decrease in abundance of OTUs from left to right. *P<0.05, **p<0.01, ***p<0.001. HCs, healthy controls; CPs, confirmed patients; OTUs, operational taxonomy units; PCoA, principal coordinate analysis; CPRs, confirmed patients who recovered. Centerline, median; box limits, upper and lower quartiles; circle or square symbol, mean; error bars, 95% CI.
Figure 8
Figure 8
Linkages between the microbiome and lipidomics contribute to CPs recovery. (A) Average compositions and relative abundance of lipids in the CPs (n=73) and CPRs (n=22) at the subclass level. (B) The PCA showed that the lipid distribution in the CPRs (n=22) was different from that in the CPs (n=73). (C) Twenty enriched pathways with the most significant differences between the CPs (n=73) and CPRs (n=22) were identified based on KEGG. The size of the points represents the metabolite number. (D) Heatmap showing the partial Spearman’s correlation coefficients among 28 distinctive oral OTUs and 28 distinctive gut OTUs between CPs (n=11) and HCs (n=18). Red colour represents positive correlations and green colour represents negative correlations. (E) The relationship among the 22 discriminative oral microbial OTUs, 4 discriminative faecal microbial OTUs and 10 discriminative lipid molecules in CPs (n=36) and CPRs (n=18). The colours of points show the different phyla of the genera. The size of the points of each genus shows the mean relative abundance. The circle points represent the faecal microbiome, square points represent the lipid molecule and diamond points represent the tongue-coating microbiome. The transparency of the lines represents the negative logarithm (base 10) of the p value of correlation (Spearman’s), red lines represent negative correlations, blue lines represent positive correlations and the width of the lines represents the size of the correlation (Spearman’s). HCs, healthy controls; CPs, confirmed patients; OTUs, operational taxonomy units; CPRs, confirmed patients who recovered.

References

    1. WHO . Coronavirus disease (COVID-19) Weekly epidemiological update and Weekly operational update, 2020. Available: https://www.who.int/emergencies/diseases/novel-coronavirus-2019/situatio...
    1. Wiersinga WJ, Rhodes A, Cheng AC, et al. . Pathophysiology, transmission, diagnosis, and treatment of coronavirus disease 2019 (COVID-19). JAMA 2020;324:782. 10.1001/jama.2020.12839 - DOI - PubMed
    1. Kucirka LM, Lauer SA, Laeyendecker O, et al. . Variation in false-negative rate of reverse transcriptase polymerase chain reaction-based SARS-CoV-2 tests by time since exposure. Ann Intern Med 2020;173:262–7. 10.7326/M20-1495 - DOI - PMC - PubMed
    1. Hoffmann M, Kleine-Weber H, Schroeder S, et al. . SARS-CoV-2 cell entry depends on ACE2 and TMPRSS2 and is blocked by a clinically proven protease inhibitor. Cell 2020;181:271–80. 10.1016/j.cell.2020.02.052 - DOI - PMC - PubMed
    1. Villapol S. Gastrointestinal symptoms associated with COVID-19: impact on the gut microbiome. Transl Res 2020;226:57–69. 10.1016/j.trsl.2020.08.004 - DOI - PMC - PubMed

Publication types