. 2022 Apr;71(4):665-675.
doi: 10.1136/gutjnl-2020-323276. Epub 2021 Mar 31.

Pan-ERBB kinase inhibition augments CDK4/6 inhibitor efficacy in oesophageal squamous cell carcinoma

Affiliations

Pan-ERBB kinase inhibition augments CDK4/6 inhibitor efficacy in oesophageal squamous cell carcinoma

Jin Zhou et al. Gut. 2022 Apr.

Erratum in

Abstract

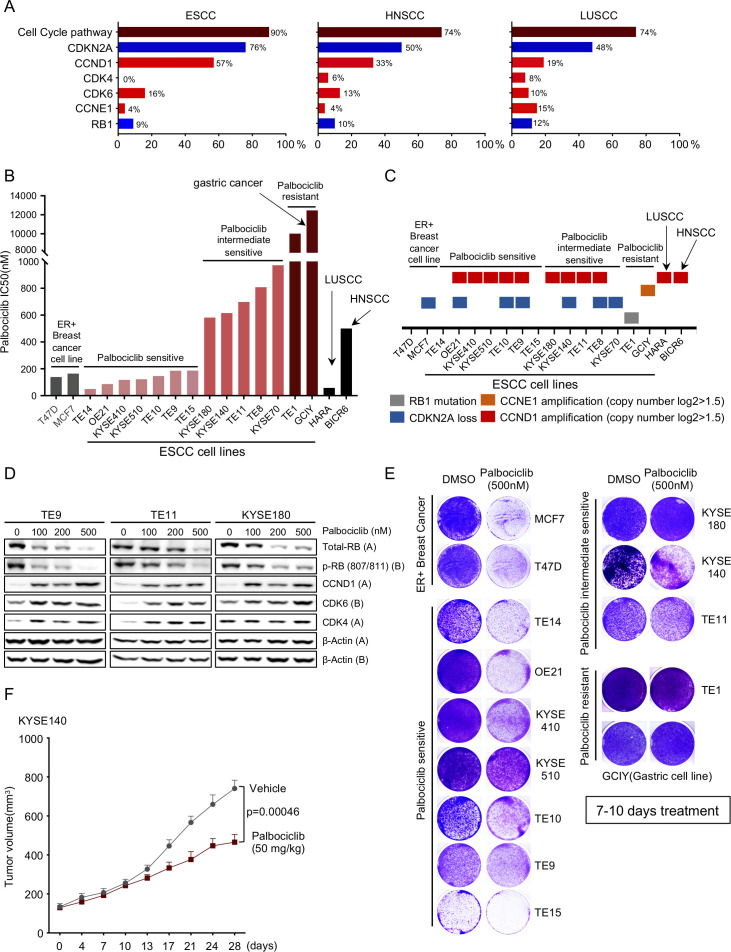
Objective: Oesophageal squamous cell carcinoma (OSCC), like other squamous carcinomas, harbour highly recurrent cell cycle pathway alterations, especially hyperactivation of the CCND1/CDK4/6 axis, raising the potential for use of existing CDK4/6 inhibitors in these cancers. Although CDK4/6 inhibition has shown striking success when combined with endocrine therapy in oestrogen receptor positive breast cancer, CDK4/6 inhibitor palbociclib monotherapy has not revealed evidence of efficacy to date in OSCC clinical studies. Herein, we sought to elucidate the identification of key dependencies in OSCC as a foundation for the selection of targets whose blockade could be combined with CDK4/6 inhibition.

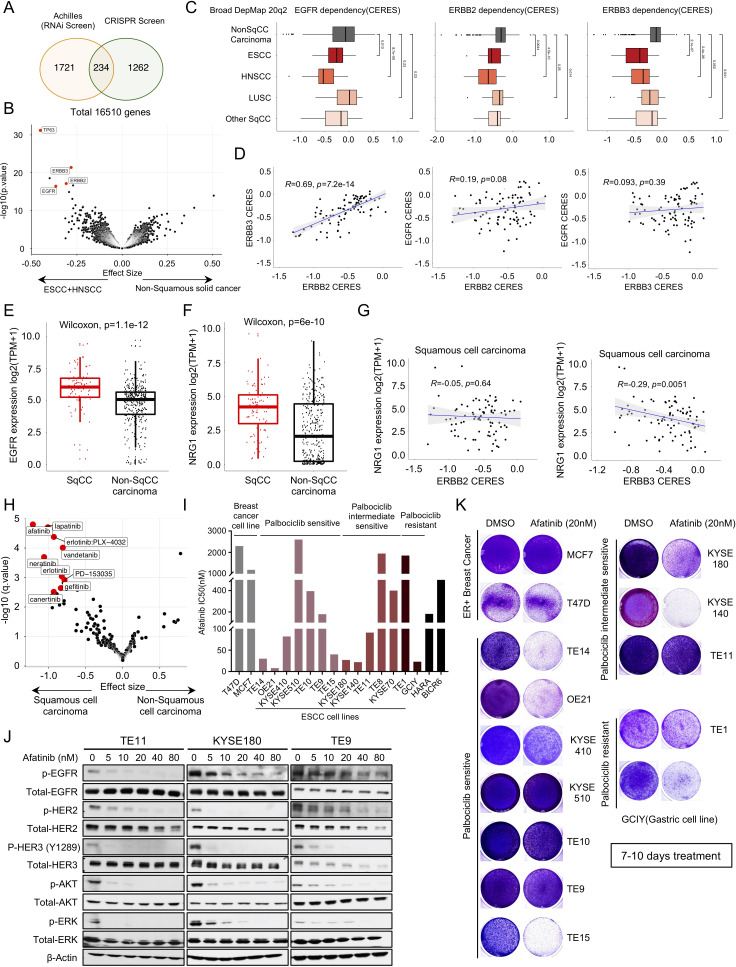
Design: We combined large-scale genomic dependency and pharmaceutical screening datasets with preclinical cell line models, to identified potential combination therapies in squamous cell cancer.

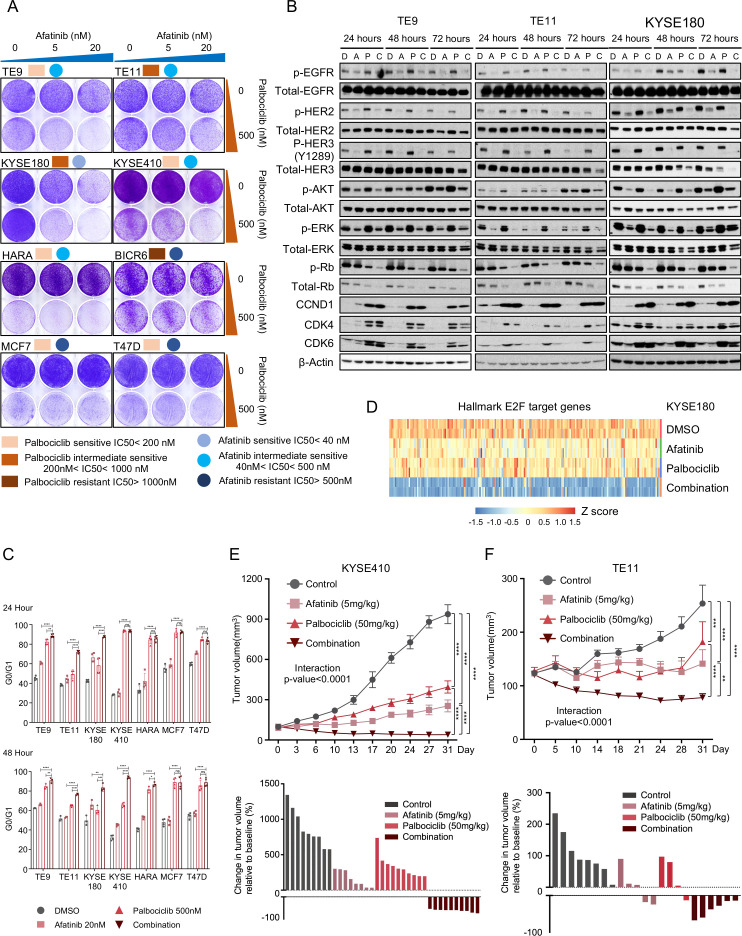
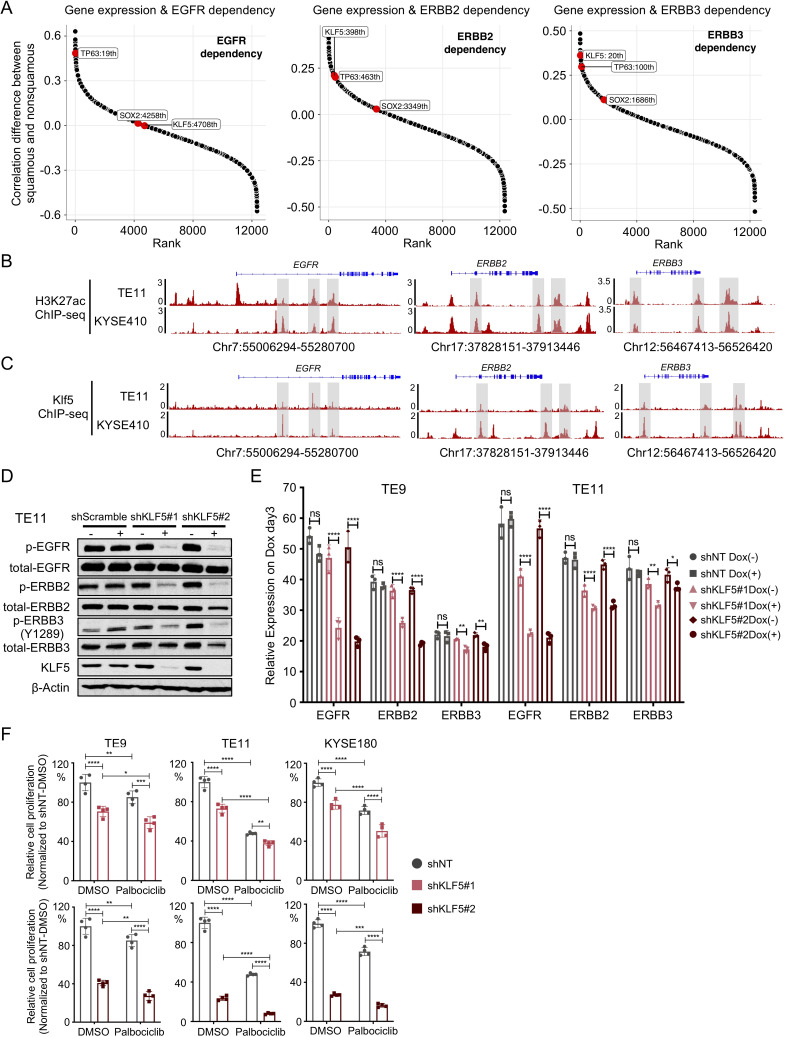
Results: We identified sensitivity to inhibitors to the ERBB family of receptor kinases, results clearly extending beyond the previously described minority of tumours with EGFR amplification/dependence, specifically finding a subset of OSCCs with dual dependence on ERBB3 and ERBB2. Subsequently. we demonstrated marked efficacy of combined pan-ERBB and CDK4/6 inhibition in vitro and in vivo. Furthermore, we demonstrated that squamous lineage transcription factor KLF5 facilitated activation of ERBBs in OSCC.

Conclusion: These results provide clear rationale for development of combined ERBB and CDK4/6 inhibition in these cancers and raises the potential for KLF5 expression as a candidate biomarker to guide the use of these agents. These data suggested that by combining existing Food and Drug Administration (FDA)-approved agents, we have the capacity to improve therapy for OSCC and other squamous cancer.

Keywords: cell cycle control; oesophageal cancer; pharmacogenomics; pharmacotherapy.


Conflict of interest statement

Competing interests: AB receives research funding from Bayer, Merck and Novartis and is a consultant to Earli, and HelixNano and a cofounder of Signet Therapeutics. K-KW is a founder and equity holder of G1 Therapeutics, and he has consulting/sponsored research agreements with MedImmune, Takeda, TargImmune, BMS, AstraZeneca, Janssen, Pfizer, Novartis, Merck, Ono and Array.

Figures

Figure 1
Figure 1
CDK4/6 inhibitors as a putative target for oesophageal squamous cell carcinoma (OSCC). (A) Frequencies of cell-cycle gene alterations (CDKN2A, CCND1, CDK4, CDK6, CCNE1 and RB1) in OSCC/HNSCC/LUSCC from The Cancer Genome Atlas. Deletion is depicted in blue and amplification is depicted in red. (B) Palbociclib drug sensitivity half maximal inhibitory concentration (IC50) values (nm). Cell lines are coloured as follows: grey: OR positive breast cancer; light red: palbociclib sensitive OSCC; red: palbociclib intermediate sensitive OSCC; dark red: palbociclib resistant OSC line TE1 and gastric line GCIY; black: LUSCC line HARA and HNSCC line BICR6. (C) Annotations of cell-cycle gene alterations in cell lines shown in figure 1B. (D) Immunoblot analysis of genes involved in cell-cycle pathway in OSCC cell lines TE9, TE11 and KYSE180 cells treated with palbociclib (100 nM, 200 nM and 500 nM), or with water control. Protein lysates were collected after drug treatment for 24 hours. Immunoblots from one representative experiment (n=2) are shown. (E) Images showing crystal violet staining of cell lines listed in figure 1B, after 500 nM palbociclib treatment for 7–10 days. Data from one representative experiment are presented (n=3). (F) Growth curve for KYSE140 xenograft tumours (n=6–10) treated with palbociclib (50 mg/kg) by daily gavage. Data are mean±SEM, and p value was calculated by t–tests at 28 days. OR, oestrogen receptor.
Figure 2
Figure 2
ERBB family of kinases emerge as strong dependencies across OSCC. (A) Venn diagram showing the overlap of genes that are significantly more essential in OSCC and HNSCC cell lines than other non-squamous solid tumour cell lines from Broad Institute Achilles RNAi screen and Broad Institute Achilles CRISPR screen datasets. (B) Broad Institute Achilles CRISPR screen data (DepMap 20q2 public) analysis showing selective dependency genes in OSCC and HNSCC versus non-squamous carcinoma cell lines, as illustrated in volcano plot. Each dot represents a gene, and the effect size explains the mean difference of gene dependency score between the two groups. (C) The dependency score (CERES) of EGFR, ERBB2 and ERBB3 in different squamous cell carcinomas subtypes and non-squamous carcinoma cells. Wilcoxon test was performed to compare CERES values in two groups. (D) Pearson correlation of EGFR, ERBB2 and ERBB3 gene dependency score in squamous cell carcinoma cell lines based on Broad Institute Achilles CRISPR screen data (DepMap 20Q2 public). (E) mRNA expression of EGFR in squamous carcinoma cell lines and non-squamous carcinoma cell lines based on Broad Institute Cancer Cell Line Encyclopedia data (DepMap 20Q2 public). Wilcoxon test was performed for two group comparison. (F) mRNA expression of NRG1 in squamous carcinoma cell lines and non-squamous carcinoma cell lines based on Broad Institute Cancer Cell Line Encyclopedia data (DepMap 20Q2 public). Wilcoxon test was performed for two group comparison. (G) Pearson correlation of NRG1 expression and ERBB2 (left) or ERBB3 (right) gene dependency score in squamous cell carcinoma cell lines. (H) CTRP CTD2drug sensitivity area under the curve (AUC) data mining showing selective drug sensitivity in genes in squamous carcinoma cell lines and non-squamous carcinoma cell lines. Each dot represents a drug, and the effect size explains the mean difference of drug sensitivity AUC between the two groups. (I) Afatinib drug sensitivity half maximal inhibitory concentration (IC50) values (nM). Cell lines are colour coded as shown in figure 1B. (J) Immunoblot analysis of genes involved in ERBBs and downstream pathway in TE9, TE11 and KYSE180 cells treated with afatinib (5 nM, 10 nM, 20 nM, 40 nM and 80 nM) or with DMSO control. Protein lysates were collected after drug treatment for 24 hours. Immunoblots from one representative experiment (n=2) are shown. (K) Images showing crystal violet staining of cell lines are listed in figure 2I, after 20 nM afatinib treatment for 7–10 days. Data from one representative experiment are presented (n=3). OSCC, oesophageal squamous cell carcinoma.
Figure 3
Figure 3
Pan ERBB and CDK4/6 pathway dual inhibition demonstrated efficacy in OSCC. (A) Images showing crystal violet staining of representative squamous carcinoma cell lines on treatment with afatinib (20 nM), palbociclib (500 nM), the combination or with DMSO control for 7–10 days. Data from one representative experiment are presented (n=2). (B) Immunoblot analysis of genes involved in ERBB signalling pathway and cell-cycle pathway in TE9, TE11 and KYSE180 cells treated with afatinib (20 nM), palbociclib (500 nM), the combination or with DMSO control. Protein lysates were collected after drug treatment for 24 hours, 48 hours and 72 hours. Immunoblots from one representative experiment (n=2) are shown. (C) The frequency of G0/G1 cells of squamous carcinoma cell lines on treatment with afatinib (20 nM), palbociclib (500 nM), the combination or with DMSO control for 24 hours (top) and 48 hours (bottom). Following treatment, the cells were harvested, stained with propidium iodide and assayed with flow cytometry. Data are shown as mean±SD and NS, *p<0.05, **p<0.01, ***p<0.001 and ****p<0.0001 as calculated by the two-way analysis of variance (ANOVA) test followed by post hoc test with Benjamini-Hochberg correction. (D) Heatmap showing the expression of common E2F target genes in KYSE180 on treatment of DMSO, 20 nM afatinib, 500 nM palbocilib or combination. (E) Top: growth curve for KYS410 xenograft tumours (n=6–10) treated with vehicle, afatinib (5 mg/kg), palbociclib (50 mg/kg) or the combination. Data are shown as mean±SEM and ****p<0.0001 as calculated by the two-way ANOVA test followed by post hoc test with Benjamini-Hochberg correction on day 31. Bottom: waterfall plot showing the tumour volume change (at day 31) relative to baseline volume (at day 1). Each bar represents one xenograft tumour. (F) Top: growth curve for TE11 xenograft tumours (n=6–10) treated with vehicle, afatinib (5 mg/kg), palbociclib (50 mg/kg) or the combination. Data are shown as mean±SEM and **p<0.01, ***p<0.001 and ****p<0.0001 as calculated by the two-way ANOVA test followed by post hoc test with Benjamini-Hochberg correction on day 31. Bottom: waterfall plot showing the tumour volume change (at day 31) relative to baseline volume (at day 1). Each bar represents one xenograft tumour. NS, not significant; OSCC, oesophageal squamous cell carcinoma.
Figure 4
Figure 4
KLF5 facilitated ERBBs activation and promoted ERBBs dependency. (A) Modified hockey-stick plot representing the rank of Pearson correlation coefficient difference between EGFR (left), ERBB2 (middle), ERBB3 (right) gene dependencies and gene expression in squamous carcinoma cell lines (n=89) and non-squamous carcinoma cell lines (n=367). Pearson correlation was performed between target gene dependency score and gene expression. Correlation coefficient difference was calculated by subtracting Pearson R of squamous carcinoma group from Pearson R of non-squamous carcinoma group. Bigger value represents that a gene whose expression level correlates with gene dependency more strongly in squamous cell carcinoma than non-squamous cell carcinoma. Smaller value represents that a gene whose expression level correlates with gene dependency more strongly in non-squamous cell carcinoma than squamous cell carcinoma. (B) Representative H3K27ac ChIP-Seq tracks showing enhancer elements at EGFR, ERBB2 and ERBB3 locus in OSCC cell lines TE11 and KYSE410. (C) Representative KLF5 ChIP-Seq tracks showing KLF5 binding sites at EGFR, ERBB2 and ERBB3 locus in OSCC cell lines TE11 and KYSE410. (D) Immunoblot analysis of protein levels of phospho-EGFR, total-EGFR, phospho-ERBB2, total-ERBB2, phospho-ERBB3, total-ERBB3 and KLF5 in OSCC cell line TE11 on shRNA-mediated KLF5 knockdown. Immunoblots from one representative experiment (n=2) are shown. (E) mRNA expression of EGFR, ERBB2 and ERBB3 in OSCC cell lines TE9, TE11 and KYSE180 on shRNA-mediated KLF5 knockdown. Data are presented as mean±SD of three technical replicates per group. *P<0.05, **p<0.01, ***p<0.001 and ****p<0.0001 as calculated by the one-way analysis of variance followed by post hoc test with Benjamini-Hochberg correction. NS indicates non-significant. (F) Cell viability of OSCC cell lines TE9, TE11 and KYSE180 was assessed by ATP bioluminescence 5 days after control or KLF5 knockdown with shRNA with/without palbociclib (500 nM) treatment. Two independent biological replicates were performed for each cell line. ATP bioluminescence values were normalised to the value of day 0 and shNT. Data are shown as mean±SD and *p<0.05, **p<0.01, ***p<0.001 and ****p<0.0001 as calculated by the two-way analysis of variance followed by post hoc test with Benjamini-Hochberg correction. NS, not significant; OSCC, oesophageal squamous cell carcinoma.

References

    1. Bray F, Ferlay J, Soerjomataram I, et al. Global cancer statistics 2018: GLOBOCAN estimates of incidence and mortality worldwide for 36 cancers in 185 countries. CA Cancer J Clin 2018;68:394–424. 10.3322/caac.21492 - DOI - PubMed
    1. Kelly RJ. Emerging multimodality approaches to treat localized esophageal cancer. J Natl Compr Canc Netw 2019;17:1009–14. 10.6004/jnccn.2019.7337 - DOI - PubMed
    1. Kato K, Cho BC, Takahashi M, et al. Nivolumab versus chemotherapy in patients with advanced oesophageal squamous cell carcinoma refractory or intolerant to previous chemotherapy (ATTRACTION-3): a multicentre, randomised, open-label, phase 3 trial. Lancet Oncol 2019;20:1506–17. 10.1016/S1470-2045(19)30626-6 - DOI - PubMed
    1. Shah MA, Kojima T, Hochhauser D, et al. Efficacy and safety of pembrolizumab for heavily pretreated patients with advanced, metastatic adenocarcinoma or squamous cell carcinoma of the esophagus: the phase 2 KEYNOTE-180 study. JAMA Oncol 2019;5:546–50. 10.1001/jamaoncol.2018.5441 - DOI - PMC - PubMed
    1. Cancer Genome Atlas Research Network, Analysis Working Group: Asan University, BC Cancer Agency, et al. Integrated genomic characterization of oesophageal carcinoma. Nature 2017;541:169–75. 10.1038/nature20805 - DOI - PMC - PubMed

Publication types

MeSH terms