

Structural relaxation and crystallization in supercooled water from 170 to 260 K
- PMID: 33790015
- PMCID: PMC8040667
- DOI: 10.1073/pnas.2022884118
Structural relaxation and crystallization in supercooled water from 170 to 260 K
Abstract
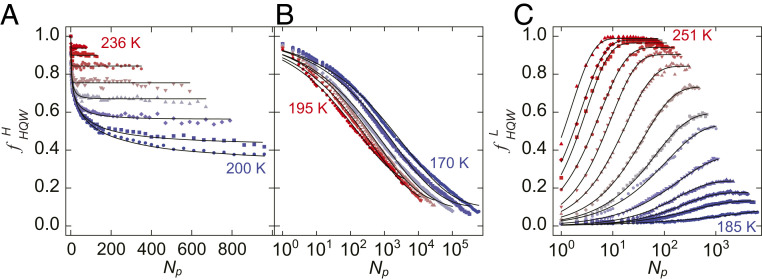
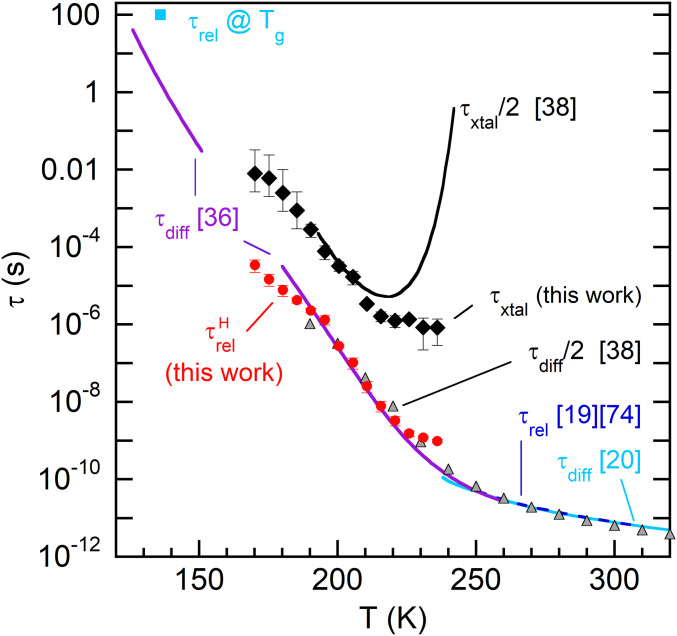
The origin of water's anomalous properties has been debated for decades. Resolution of the problem is hindered by a lack of experimental data in a crucial region of temperatures, T, and pressures where supercooled water rapidly crystallizes-a region often referred to as "no man's land." A recently developed technique where water is heated and cooled at rates greater than 109 K/s now enables experiments in this region. Here, it is used to investigate the structural relaxation and crystallization of deeply supercooled water for 170 K < T < 260 K. Water's relaxation toward a new equilibrium structure depends on its initial structure with hyperquenched glassy water (HQW) typically relaxing more quickly than low-density amorphous solid water (LDA). For HQW and T > 230 K, simple exponential relaxation kinetics is observed. For HQW at lower temperatures, increasingly nonexponential relaxation is observed, which is consistent with the dynamics expected on a rough potential energy landscape. For LDA, approximately exponential relaxation is observed for T > 230 K and T < 200 K, with nonexponential relaxation only at intermediate temperatures. At all temperatures, water's structure can be reproduced by a linear combination of two, local structural motifs, and we show that a simple model accounts for the complex kinetics within this context. The relaxation time, τ rel , is always shorter than the crystallization time, τ xtal For HQW, the ratio, τ xtal /τ rel , goes through a minimum at ∼198 K where the ratio is about 60.
Keywords: metastable states; nonexponentialkinetics; supercooled water.
Conflict of interest statement
The authors declare no competing interest.
Figures


References
-
- Ediger M. D., Spatially heterogeneous dynamics in supercooled liquids. Annu. Rev. Phys. Chem. 51, 99–128 (2000). - PubMed
-
- Debenedetti P. G., Stillinger F. H., Supercooled liquids and the glass transition. Nature 410, 259–267 (2001). - PubMed
-
- Richert R., Heterogeneous dynamics in liquids: Fluctuations in space and time. J. Phys. Condens. Matter 14, R703–R738 (2002).
-
- Lubchenko V., Wolynes P. G., Theory of structural glasses and supercooled liquids. Annu. Rev. Phys. Chem. 58, 235–266 (2007). - PubMed
-
- Chandler D., Garrahan J. P., Dynamics on the way to forming glass: Bubbles in space-time. Annu. Rev. Phys. Chem. 61, 191–217 (2010). - PubMed
LinkOut - more resources
Full Text Sources
Other Literature Sources
