. 2021 Mar 31;13(587):eabg1168.
doi: 10.1126/scitranslmed.abg1168.

Targeting acute myeloid leukemia dependency on VCP-mediated DNA repair through a selective second-generation small-molecule inhibitor

Affiliations

Targeting acute myeloid leukemia dependency on VCP-mediated DNA repair through a selective second-generation small-molecule inhibitor

Blandine Roux et al. Sci Transl Med. .

Abstract

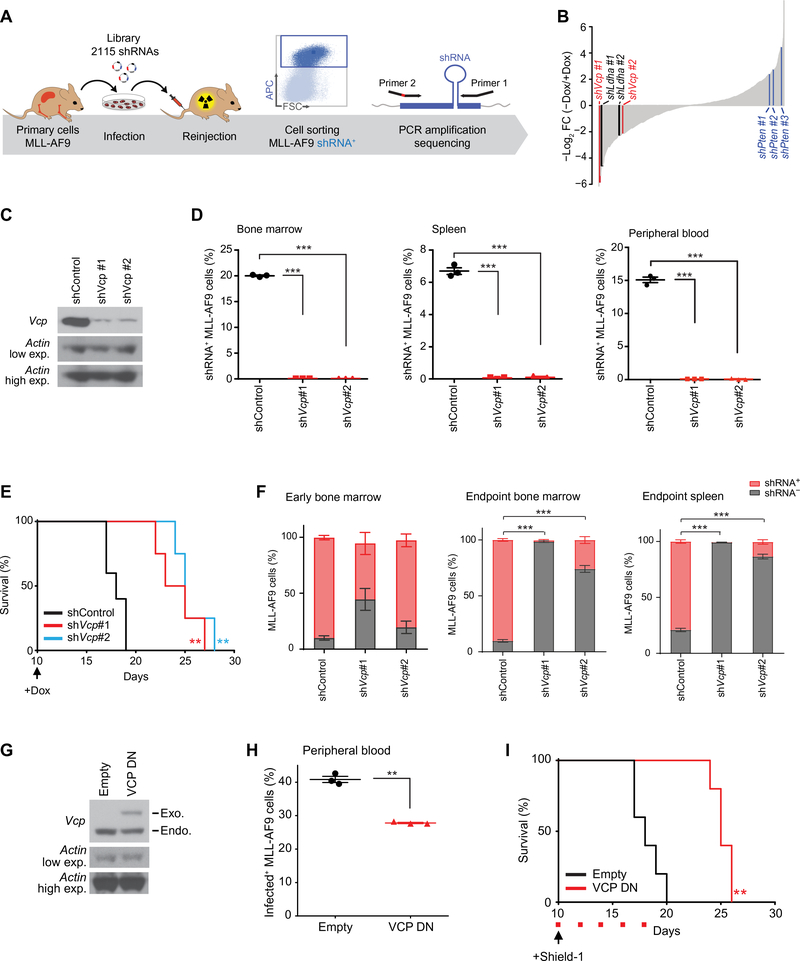
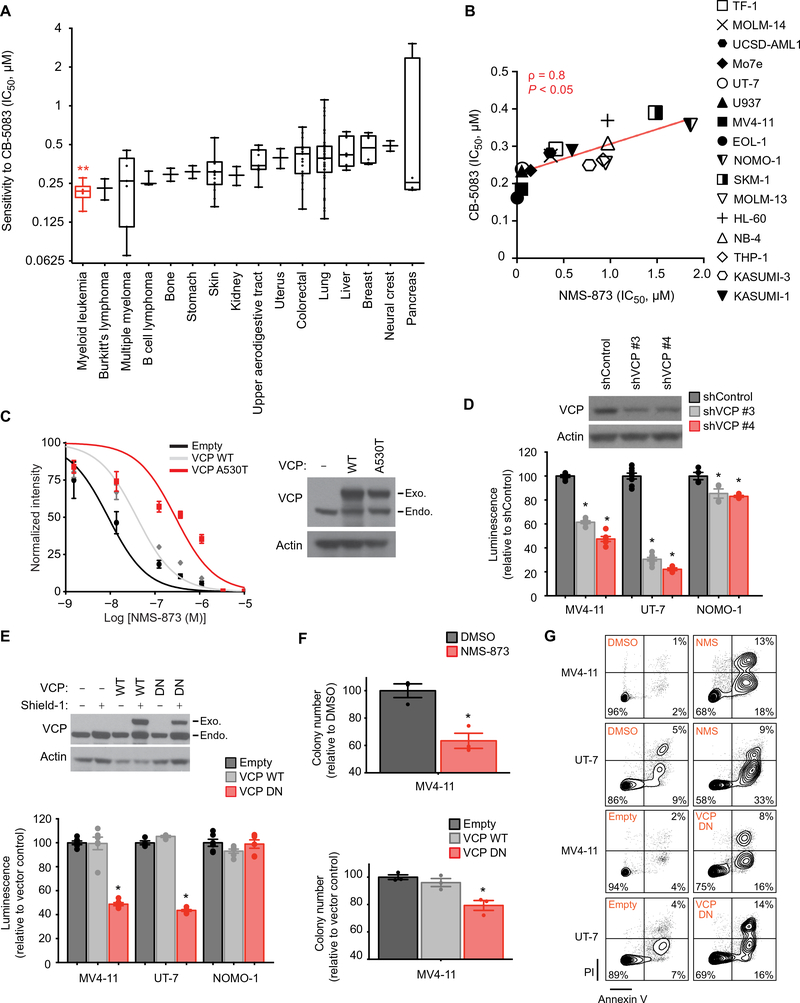
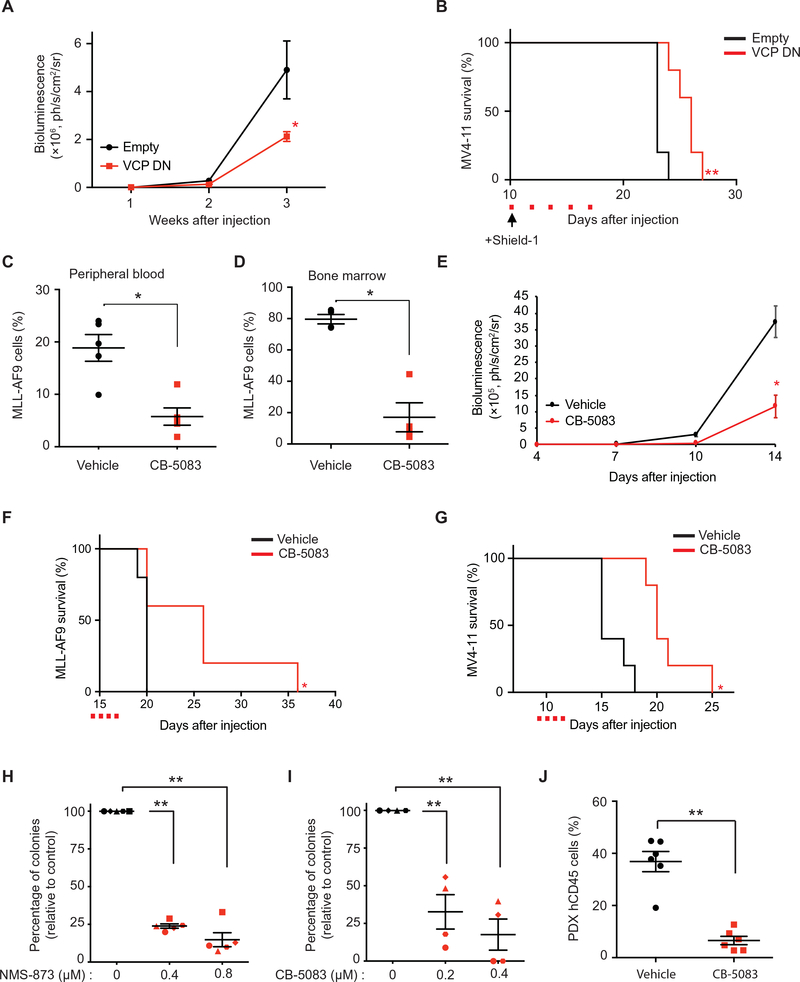
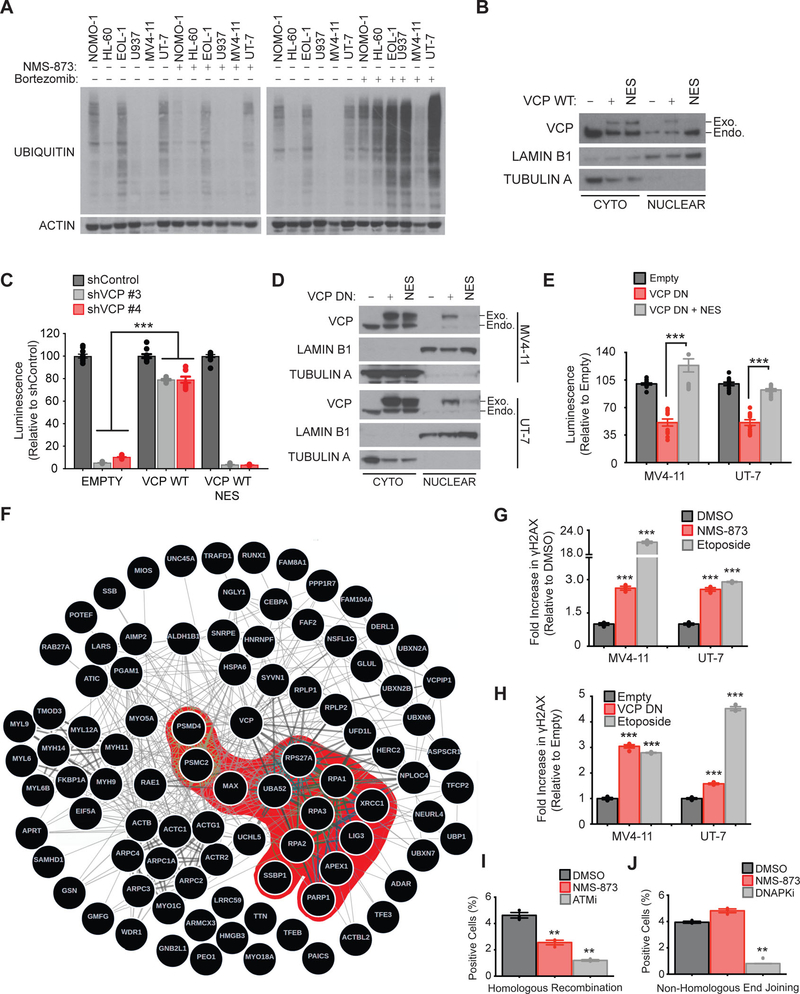
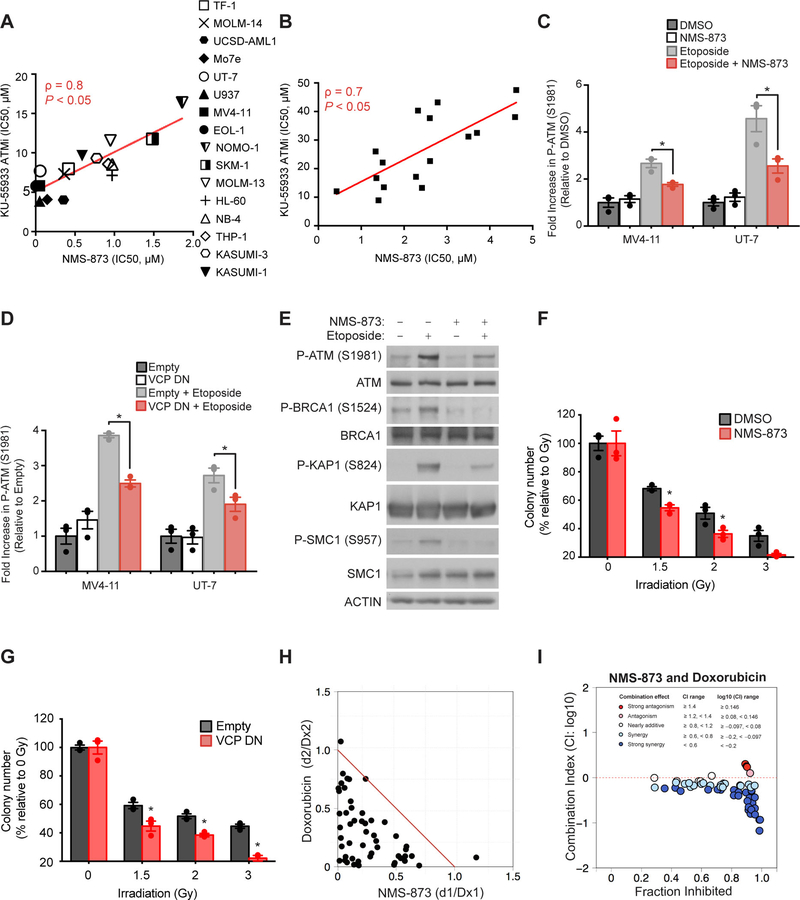
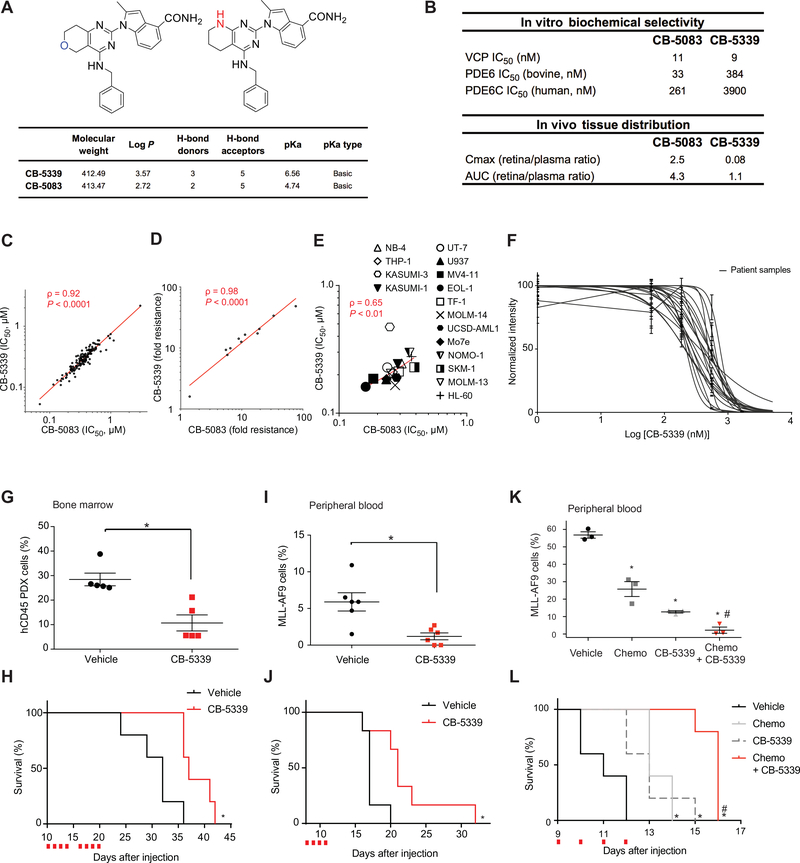
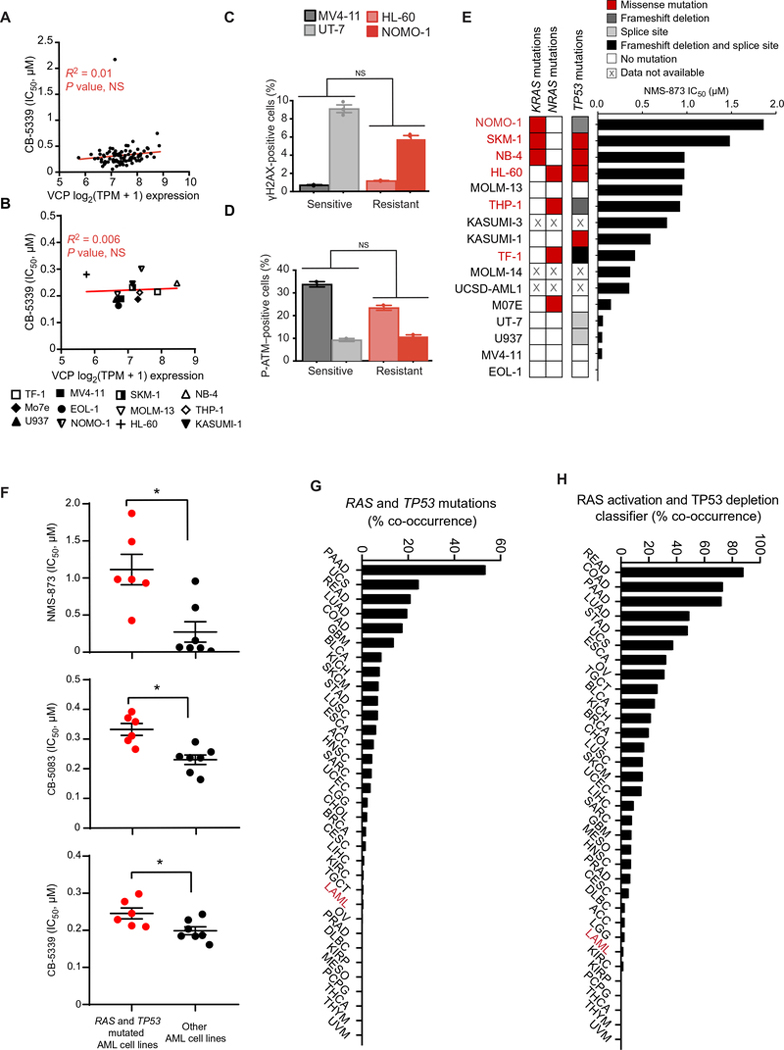
The development and survival of cancer cells require adaptive mechanisms to stress. Such adaptations can confer intrinsic vulnerabilities, enabling the selective targeting of cancer cells. Through a pooled in vivo short hairpin RNA (shRNA) screen, we identified the adenosine triphosphatase associated with diverse cellular activities (AAA-ATPase) valosin-containing protein (VCP) as a top stress-related vulnerability in acute myeloid leukemia (AML). We established that AML was the most responsive disease to chemical inhibition of VCP across a panel of 16 cancer types. The sensitivity to VCP inhibition of human AML cell lines, primary patient samples, and syngeneic and xenograft mouse models of AML was validated using VCP-directed shRNAs, overexpression of a dominant-negative VCP mutant, and chemical inhibition. By combining mass spectrometry-based analysis of the VCP interactome and phospho-signaling studies, we determined that VCP is important for ataxia telangiectasia mutated (ATM) kinase activation and subsequent DNA repair through homologous recombination in AML. A second-generation VCP inhibitor, CB-5339, was then developed and characterized. Efficacy and safety of CB-5339 were validated in multiple AML models, including syngeneic and patient-derived xenograft murine models. We further demonstrated that combining DNA-damaging agents, such as anthracyclines, with CB-5339 treatment synergizes to impair leukemic growth in an MLL-AF9-driven AML murine model. These studies support the clinical testing of CB-5339 as a single agent or in combination with standard-of-care DNA-damaging chemotherapy for the treatment of AML.


Figures

Figure 1.
Figure 1.. An in vivo shRNA screen identifies VCP as an AML dependency.
(A) Model of the doxycycline-inducible shRNA screening. (B) Waterfall plot of all screened hairpins analyzed using the EdgeR/RIGER method. Top scoring Vcp, Ldha (positive control), and Pten (negative control) hairpins are highlighted in red, black and blue respectively. (C) Western blot for Vcp and Actin in MLL-AF9 cells expressing one control (shControl) and two Vcp-directed shRNAs (shVcp #1 and #2). (D) Proportion of shRNA+ MLL-AF9 cells in bone marrow, spleen and peripheral blood respectively 19, 19 and 16 days post-injection of MLL-AF9 cells expressing either shControl, shVcp#1 or shVcp#2 (n=3 mice per condition). Welch’s t-test in comparison with control condition. Error bars represent mean ± SEM. *** p < 0.001. (E) Kaplan-Meier curves showing overall survival of mice (n=5 for shControl and n=4 for each shVcp group) transplanted with cells expressing shControl, shVcp#1 or shVcp#2. Arrow indicates the beginning of doxycycline treatment. Log-rank (Mantel-Cox) test. ** p < 0.01 by comparison with shControl within the shVcp#1 or the shVcp#2 group. (F) Percentage of shRNA+ and shRNA MLL-AF9 cells in mice bone marrow 14 days post-injection (Early Bone Marrow) of MLL-AF9 cells expressing either shControl, shVcp#1 or shVcp#2, and in bone marrow and spleen at time of death (n=7 mice per condition). Mann-Whitney test in comparison with the shControl condition. Error bars represent mean ± SEM. *** p < 0.001. (G) Western blot for Vcp and Actin indicating exogenous (Exo) dominant negative (DN) VCP in MLL-AF9 cells treated with Shield-1 for 24 hours. (H) Percentage in peripheral blood of MLL-AF9 cells expressing either an empty or a VCP DN-encoding vector 16 days post-transplantation (n=3 mice per condition). Welch’s t-test in comparison with empty condition. Error bars represent mean ± SEM. ** p < 0.01. (I) Kaplan-Meier curves showing overall survival of mice (n=5 per condition) transplanted with MLL-AF9 cells expressing either an empty vector or VCP DN. Arrow indicates beginning of Shield-1 and red squares indicate days of Shield-1 injection. Log-rank (Mantel-Cox) test. ** p < 0.01 by comparison with empty vector.
Figure 2.
Figure 2.. AML cell lines are preferentially sensitive to VCP inhibition.
(A) Distribution of IC50 (concentrations of CB-5083 at which viability was reduced by 50%) in a panel of 131 cancer cell lines treated with CB-5083 for three days in duplicate. Cell lines derived from non-oncogenic tissues and cancer types represented by only one cell line were excluded from this analysis. Error bars represent mean ± SEM of all cell lines within each cancer subtype. Kruskal-Wallis Anova test. ** p < 0.01. (B) Linear regression analysis of the distribution of IC50 of a panel of 16 AML cell lines treated with various concentrations of NMS-873 or CB-5083 for four and five days respectively, with four replicates for each condition. Non-parametric Spearman correlation coefficients (ρ) and associated P-value. (C) Growth inhibition of UT-7 AML cells infected with the indicated Shield-1-inducible constructs and treated with increasing concentrations of NMS-873 for four days. Western blot for VCP and actin indicating VCP WT and a NMS-873-resistant mutant form of VCP (A530T) after Shield-1 treatment for 24 hours. Error bars represent mean of 4 replicates ± SEM. (D) Growth inhibition of indicated AML cell lines infected with either a control or two VCP-directed shRNAs. Western blot for VCP and actin, 6 days post-doxycycline. Data are normalized to the control shRNA and shown relative to day two of doxycycline induction (time of seeding). Welch’s t-test in comparison with control condition. Error bars represent mean of 4 to 8 replicates ± SEM. *p<0.05. (E) Growth inhibition of indicated human AML cell lines infected with a Shield-1-inducible overexpression vector either empty or encoding WT or dominant negative (DN) VCP. Western blot for VCP and actin indicating VCP WT or DN overexpression, in MV4–11 cells 24 hours post-Shield-1. Growth inhibition after four days of Shield-1 treatment is normalized to the empty vector and shown relative to non-induced conditions. Welch’s t-test in comparison with empty condition. Error bars represent mean of 4 to 6 replicates ± SEM. *p<0.05. (F) Colony-forming assay for MV4–11 AML cell line either treated with DMSO or NMS-873 (NMS) at 0.4 μM, or infected with an empty, a VCP WT or DN overexpression construct and treated with Shield-1. Welch’s t-test in comparison with control conditions (DMSO or empty). Error bars represent mean of 3 replicates ± SEM. *p<0.05. (G) Representative FACS plots for annexin V (AV) and propidium iodide (PI) staining of indicated AML cell lines either treated with DMSO or NMS-873 (NMS) at 0.2 μM for 8 days, or infected with an empty or a VCP DN overexpression construct and treated two days with Shield-1. Data representative of two independent experiments.
Figure 3.
Figure 3.. VCP is a dependency in in vivo AML models and primary AML patient samples.
(A) Bioluminescence measurements of mice transplanted with MV4–11-luc cells infected with either an empty or a VCP DN-encoding vector (n=5 mice per condition). Mann-Whitney test in comparison with empty condition. Error bars represent mean ± SEM. * p < 0.05. (B) Kaplan-Meier curves showing overall survival of mice (n=5 per condition) transplanted with MV4–11-luc cells expressing either an empty or a VCP DN-encoding vector. Arrow indicates beginning of Shield-1 and red squares indicate days of Shield-1 injection. Log-rank (Mantel-Cox) test. ** p < 0.01 by comparison with empty vector. (C-D) Proportion of MLL-AF9 cells in peripheral blood (n=5 mice per condition) (C) and bone marrow (n=4 mice per condition) (D), respectively 18 and 20 days post-injection of MLL-AF9 cells. CB-5083 treatment was started at day 14. Mann-Whitney test in comparison with vehicle. Error bars represent mean ± SEM. * p < 0.05. (E) Bioluminescence measurements of mice transplanted with MV4–11-luc cells and treated with CB-5083 or vehicle (n=5 mice per condition). CB-5083 treatment was started at day 9. Welch’s t-test in comparison with vehicle. Error bars represent mean ± SEM. * p < 0.05. (F) Kaplan-Meier curves showing overall survival of mice (n=5 per condition) transplanted with MLL-AF9 and treated with CB-5083. Red squares indicate days of CB-5083 treatment. Log-rank (Mantel-Cox) test. * p < 0.05 by comparison with vehicle. (G) Kaplan-Meier curves showing overall survival of mice (n=5 per condition) transplanted with MV4–11-luc cells and treated with CB-5083 or vehicle. Red squares indicate days of CB-5083 treatment. Log-rank (Mantel-Cox) test. * p < 0.05 by comparison with vehicle. (H-I) Colony-forming assay for primary patient AML samples treated with NMS-873 (n=5) (H) or CB-5083 (n=4) (I). Results represent mean of three replicates for each patient. Welch’s t-test in comparison with the control condition. Error bars represent mean ± SEM. ** p < 0.01. (J) Proportion of hCD45+ leukemic cells in mice peripheral blood 24 days post-injection of patient derived primary AML cells (n=6 mice per condition). CB-5083 treatment was started 20 days post-injection, after engraftment validation. Mann-Whitney test in comparison with vehicle. Error bars represent mean ± SEM. ** p < 0.01.
Figure 4.
Figure 4.. Inhibition of the nuclear function of VCP alters AML cell line viability through impairment of DNA repair.
(A) Western blot for ubiquitin and actin in the indicated AML cell lines treated with 0.4 μM NMS-873 or 10 nM bortezomib for 24 hours. (B) Western blot for VCP, lamin B1 (nucleus loading control) and tubulin A (cytoplasm loading control) after nuclear/cytoplasmic fractionation of the MV4–11 cell line expressing either a codon optimized “wild-type” VCP (WT) or a NES (nuclear export signal) flanked-WT VCP. (C) Growth inhibition of the indicated MV4–11 cell lines treated with Shield-1 for six days, and five days post-doxycycline supplementation. Data are normalized to shControl for each condition. Mann-Whitney test in comparison to empty vector condition. Error bars represent mean of 10 replicates ± SEM. *** p < 0.001. (D) Western blot for VCP, lamin B1 and tubulin A after nuclear/cytoplasmic fractionation of MV4–11 and UT-7 cell lines expressing either a DN or a NES (nuclear export signal) flanked-DN VCP. (E) Growth inhibition of indicated AML cell lines treated with Shield-1 for four days. Data are normalized to the empty vector and are shown relative to non-induced conditions. Mann-Whitney test in comparison to VCP DN condition. Error bars represent mean of two independent experiments with 6 replicates each ± SEM. *** p < 0.001. (F) Network depicting the VCP interactome established by quantitative mass spectrometry-based analysis of MV4–11 cells stably expressing V5-tagged WT VCP. Results achieving statistical significance (log2FC>0.5 and P-value<0.05) in two biological replicates are shown. VCP interactome was interrogated in a functional enrichment overlapping analysis across the MSigDB database (C2 collection). Protein partners involved in DNA repair, synthesis and cell cycle checkpoints pathways are highlighted in red. −log10FDR calculated through overlapping analysis >1 is defined as threshold of significance. (G-H) FACS analysis of the intracellular expression of γH2AX in MV4–11 and UT-7 AML cells treated for 72 hours with 0.4 μM NMS-873 (G) or expressing either an empty or a VCP DN vector and treated with Shield-1 for 48 hours (H). Etoposide treatment was used as a positive control. Error bars represent mean ± SEM of 3 to 4 replicates. 10,000 cellular events were measured for each replicate condition. Welch’s t-test in comparison with control condition. *** p<0.001. (I-J) FACS analysis of GFP and CD4 expression in RG37-DR-GFP (I) and GC92-NHEJ-CD4 (J) cells respectively at 48 hours post-transfection with I-SceI endonuclease and treated with either 0.4 μM NMS-873, 5 μM KU-55933 (ATMi), or 2.5 μM KU-57788 (DNAPKi). Error bars represent mean ± SEM of 3 replicates. 10,000 cellular events were measured for each replicate. Welch’s t-test in comparison with control condition. ** p<0.01.
Figure 5.
Figure 5.. VCP inhibition impairs ATM phosphorylation and downstream signaling resulting in increased sensitivity to DNA damaging agents.
(A-B) Linear regression analysis of the distribution of IC50 of a panel of 16 AML cell lines (A) and 16 primary patient AML samples (B) treated with various concentrations of NMS-873 or KU-55933 (ATMi) for four and three days respectively, four replicates for each condition. Non-parametric Spearman correlation coefficient (ρ) and associated P-value are calculated. (C-D) FACS analysis of the intracellular expression of P-ATM (S1981) in MV4–11 and UT-7 AML cells treated with NMS-873 for two hours (C) or with Shield-1 for 12 hours to stabilize VCP DN (D). Etoposide treatment was used to induce DNA damage in order to evaluate the DNA repair signaling response under VCP impairment. Error bars represent mean ± SEM of three replicates. 10,000 cellular events were measured for each replicate. Welch’s t-test in comparison with etoposide conditions for each cell line. * p<0.05. (E) Western blot for P-ATM (S1981), ATM, P-BRCA1 (S1524), BRCA1, P-KAP1 (S824), KAP1, P-SMC1 (S957), SMC1 and actin, from MV4–11 cells treated with NMS-873 for two hours. Etoposide treatment was used to induce DNA damage, to evaluate the DNA repair signaling response under VCP impairment. (F-G) Colony-forming assay for MV4–11 AML cell line treated with 0.2 μM NMS-873 for 24H (F) or infected with a Shield-1 inducible empty or VCP DN overexpression construct (G), and then irradiated with the indicated doses. Welch’s t-test in comparison with each control condition. Error bars represent mean of 3 replicates ± SEM. * p<0.05. (H-I) Isobologram representation (H) or Combination Index (CI) plots (I) for the combination of NMS-873 with doxorubicin in MV4–11 cell line after four days of treatment. Doxorubicin treatment was added after 24 hours of NMS-873 pre-treatment. Results represent the average of four replicates for each dose combination. Dx denotes the drug concentration required to produce x percentage effect alone, and d denotes the drug concentration required to produce the same x percentage effect in combination with the second drug.
Figure 6.
Figure 6.. Targeting VCP in AML through a second-generation VCP inhibitor: CB-5339.
(A) Chemical structure and properties of CB-5339 compared to CB-5083. (B) CB-5339 in vitro biochemical selectivity towards PDE6 and retina/plasma tissue distribution compared to CB-5083. (C) Linear regression analysis of IC50 distribution of a panel of 138 cell lines treated with CB-5339 or CB-5083 for three days in duplicates. Non-parametric Spearman correlation coefficient (ρ) and associated P-value. (D) Linear regression analysis of IC50 distribution of a panel of 11 HCT116 cell lines carrying resistance mutations to CB-5083, treated with CB-5339 or CB-5083 for three days in duplicates. Results are presented as fold resistance compared to the parental HCT116 cell line. Non-parametric Spearman correlation coefficient (ρ) and associated P-value. (E) Linear regression analysis of IC50 distribution of a panel of 16 AML cell lines treated with CB-5339 or CB-5083 (four replicates for each condition). Non-parametric Spearman correlation coefficient (ρ) and associated P-value. (F) Growth inhibition of 16 primary patient AML samples treated with increasing concentrations of CB-5339 for six days. Error bars represent mean of two replicates ± SEM. (G) Proportion of hCD45+ leukemic cells in mice bone marrow (n=5 mice per condition) 21 days post-injection of patient-derived primary AML cells. CB-5339 treatment was started 10 days post-injection, after engraftment validation. Mann-Whitney test in comparison with vehicle. Error bars represent mean ± SEM. * p<0.05. (H) Kaplan-Meier curves showing overall survival of mice (n=5 mice per condition) transplanted with patient-derived primary AML cells and treated with CB-5339 at 90 mg/kg. Red squares indicate days of CB-5339 treatment. Log-rank (Mantel-Cox) test. * p < 0.05 by comparison with vehicle. (I) Proportion of MLL-AF9 cells in peripheral blood (n=6 mice per condition) 12 days post-injection of MLL-AF9 cells. CB-5339 treatment was started at day 8. Mann-Whitney test in comparison with vehicle. Error bars represent mean ± SEM. * p<0.05. (J) Kaplan-Meier curves showing overall survival of mice (n=6 per condition) transplanted with MLL-AF9 and treated with CB-5339 at 90 mg/kg. Red squares indicate days of CB-5339 treatment. Log-rank (Mantel-Cox) test. * p < 0.05 by comparison with vehicle. (K) Proportion of MLL-AF9 cells in peripheral blood (n=3 mice per condition) 11 days post-injection of MLL-AF9 cells. Treatment was started at day 9 (CB-5339 at 50 mg/kg for 4 days, Chemo : Doxorubicin at 0.5 mg/kg for 3 days and cytarabine at 75 mg/kg for 5 days). Welch’s t-test. Error bars represent mean ± SEM. * p < 0.05 by comparison with vehicle. # p < 0.05 by comparison with CB-5339 or Chemo groups. (L) Kaplan-Meier curves showing overall survival of mice (n=5 per condition) transplanted with MLL-AF9 and treated as indicated. Red squares indicate days of CB-5339 treatment. Log-rank (Mantel-Cox) test. * p < 0.05 by comparison with vehicle. # p < 0.05 by comparison with CB-5339 or Chemo groups.
Figure 7.
Figure 7.. Co-occurrence of RAS oncogene activation and TP53 deficiency is associated with decreased response to VCP inhibition.
(A-B) Linear regression analysis of IC50 distributions of a panel of 91 cancer cell lines (A) or 12 AML cell lines (B) treated with CB-5339 for three days compared to VCP mRNA expression data extracted from the CCLE database. Cell lines with no available transcriptional data were excluded from this analysis. R-square coefficient and associated P-value. NS=not significant. TPM=Transcripts per Million. (C-D) FACS analysis of the intracellular expression of γH2AX (C) or P-ATM (S1981) (D) in the indicated AML cell lines. Error bars represent mean of 2 to 3 replicates ± SEM. 10,000 cellular events were measured for each replicate. Welch’s t-test. NS=not significant. (E) KRAS, NRAS and TP53 mutational profiles (extracted from CCLE database) of the 16 AML cell lines screened for sensitivity to NMS-873. Cell lines harboring both RAS (KRAS or NRAS) and TP53 mutations are highlighted in red. (F) Distribution of IC50 in a panel of 13 AML cell lines treated with various concentrations of NMS-873, CB-5083 or CB-5339 (four replicates for each condition). The 3 AML cell lines with no available RAS-TP53 mutational status were excluded from this analysis. Mann-Whitney test. * p<0.05. (G-H) RAS and TP53 mutational (G) or RAS activation and TP53 deficiency (H) co-occurrence frequency across pan-cancer TCGA database (10, 294 patient samples, 33 tumor lineages). Functional RAS activation and TP53 deficiency scores were determined based on two previously validated classifiers. AML subtype is highlighted in red. TCGA acronyms are detailed in Table S8.

References

    1. Stone RM, Mandrekar SJ, Sanford BL, Laumann K, Geyer S, Bloomfield CD, Thiede C, Prior TW, Dohner K, Marcucci G, Lo-Coco F, Klisovic RB, Wei A, Sierra J, Sanz MA, Brandwein JM, de Witte T, Niederwieser D, Appelbaum FR, Medeiros BC, Tallman MS, Krauter J, Schlenk RF, Ganser A, Serve H, Ehninger G, Amadori S, Larson RA, Dohner H, Midostaurin plus Chemotherapy for Acute Myeloid Leukemia with a FLT3 Mutation. N Engl J Med 377, 454–464 (2017). - PMC - PubMed
    1. DiNardo CD, Stein EM, de Botton S, Roboz GJ, Altman JK, Mims AS, Swords R, Collins RH, Mannis GN, Pollyea DA, Donnellan W, Fathi AT, Pigneux A, Erba HP, Prince GT, Stein AS, Uy GL, Foran JM, Traer E, Stuart RK, Arellano ML, Slack JL, Sekeres MA, Willekens C, Choe S, Wang H, Zhang V, Yen KE, Kapsalis SM, Yang H, Dai D, Fan B, Goldwasser M, Liu H, Agresta S, Wu B, Attar EC, Tallman MS, Stone RM, Kantarjian HM, Durable Remissions with Ivosidenib in IDH1-Mutated Relapsed or Refractory AML. N Engl J Med 378, 2386–2398 (2018). - PubMed
    1. Stein EM, DiNardo CD, Pollyea DA, Fathi AT, Roboz GJ, Altman JK, Stone RM, DeAngelo DJ, Levine RL, Flinn IW, Kantarjian HM, Collins R, Patel MR, Frankel AE, Stein A, Sekeres MA, Swords RT, Medeiros BC, Willekens C, Vyas P, Tosolini A, Xu Q, Knight RD, Yen KE, Agresta S, de Botton S, Tallman MS, Enasidenib in mutant IDH2 relapsed or refractory acute myeloid leukemia. Blood 130, 722–731 (2017). - PMC - PubMed
    1. Ellis LM, Hicklin DJ, Resistance to Targeted Therapies: Refining Anticancer Therapy in the Era of Molecular Oncology. Clin Cancer Res 15, 7471–7478 (2009). - PubMed
    1. Luo J, Solimini NL, Elledge SJ, Principles of cancer therapy: oncogene and non-oncogene addiction. Cell 136, 823–837 (2009). - PMC - PubMed

Publication types

Substances