. 2021 Mar 31;12(1):1998.
doi: 10.1038/s41467-021-22303-z.

Landscapes of cellular phenotypic diversity in breast cancer xenografts and their impact on drug response

Collaborators, Affiliations

Landscapes of cellular phenotypic diversity in breast cancer xenografts and their impact on drug response

Dimitra Georgopoulou et al. Nat Commun. .

Abstract

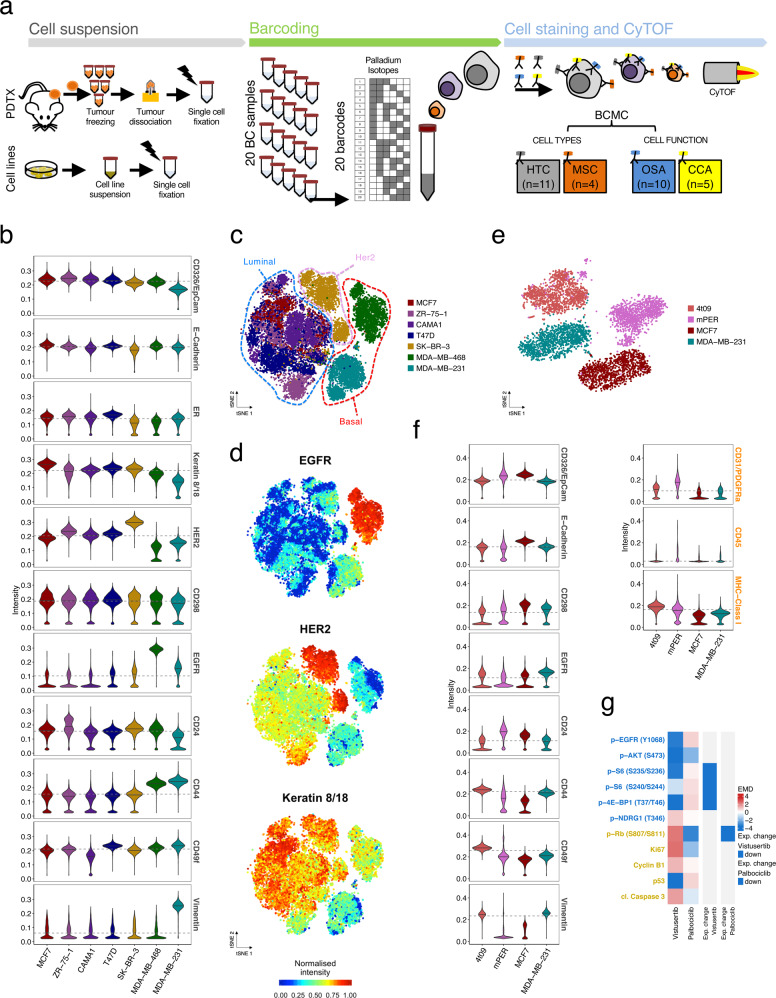
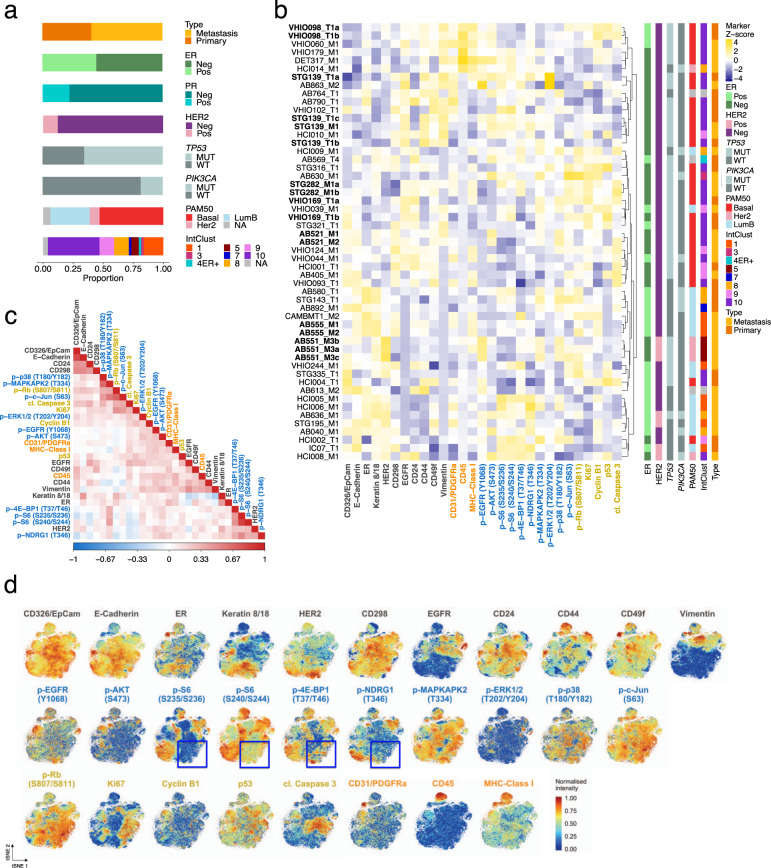
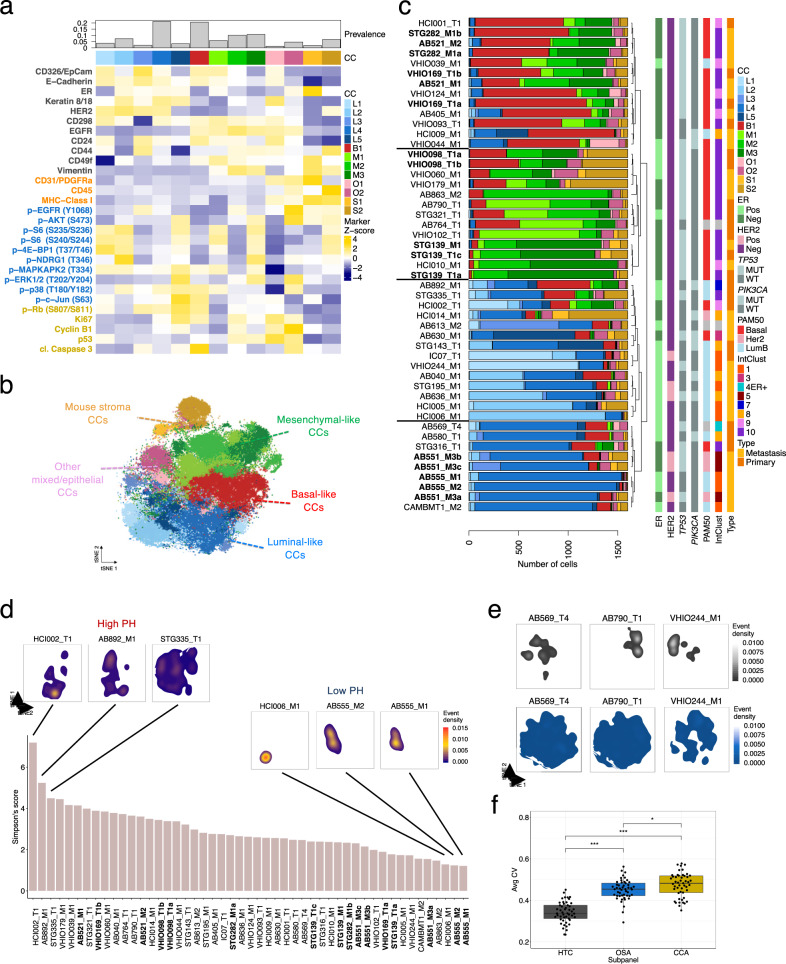
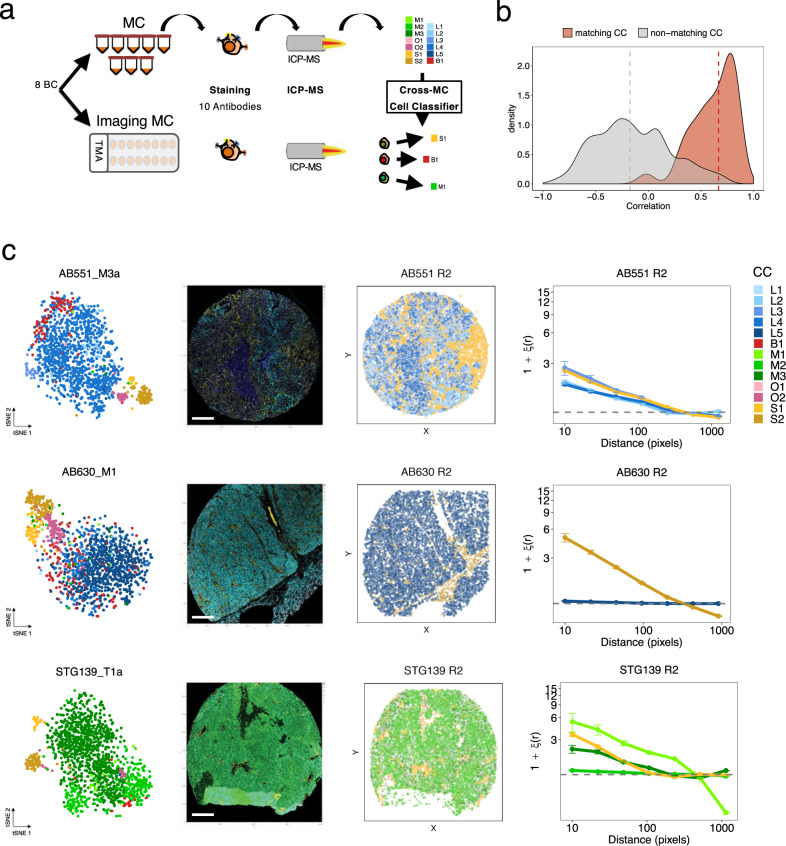
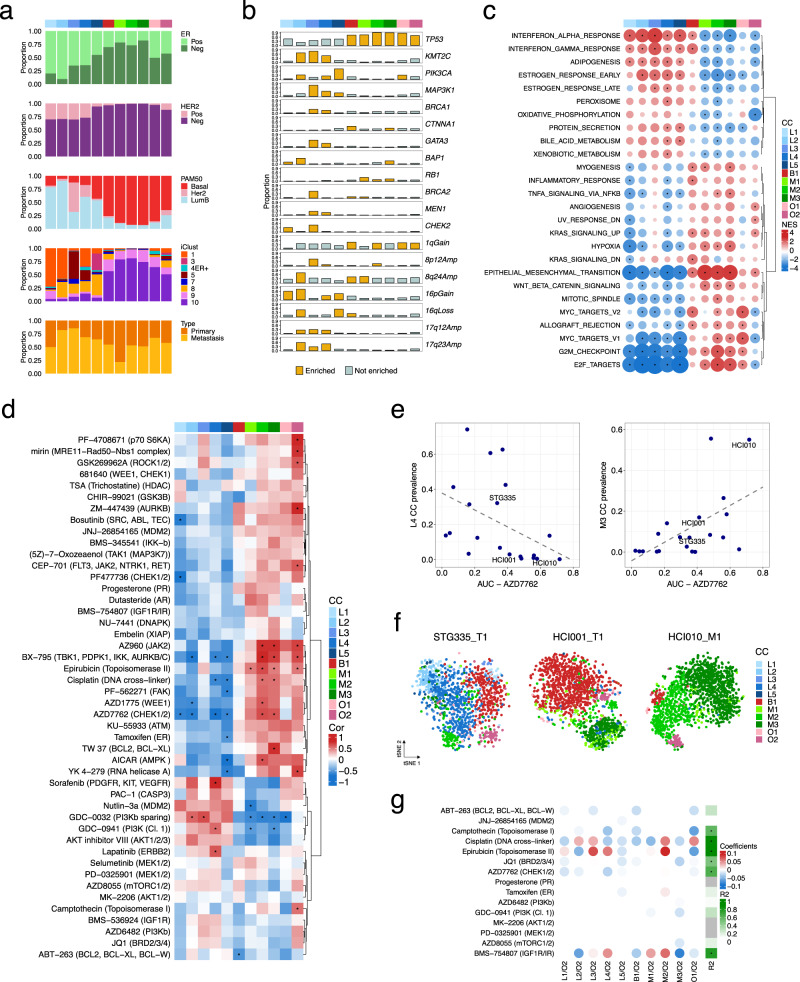
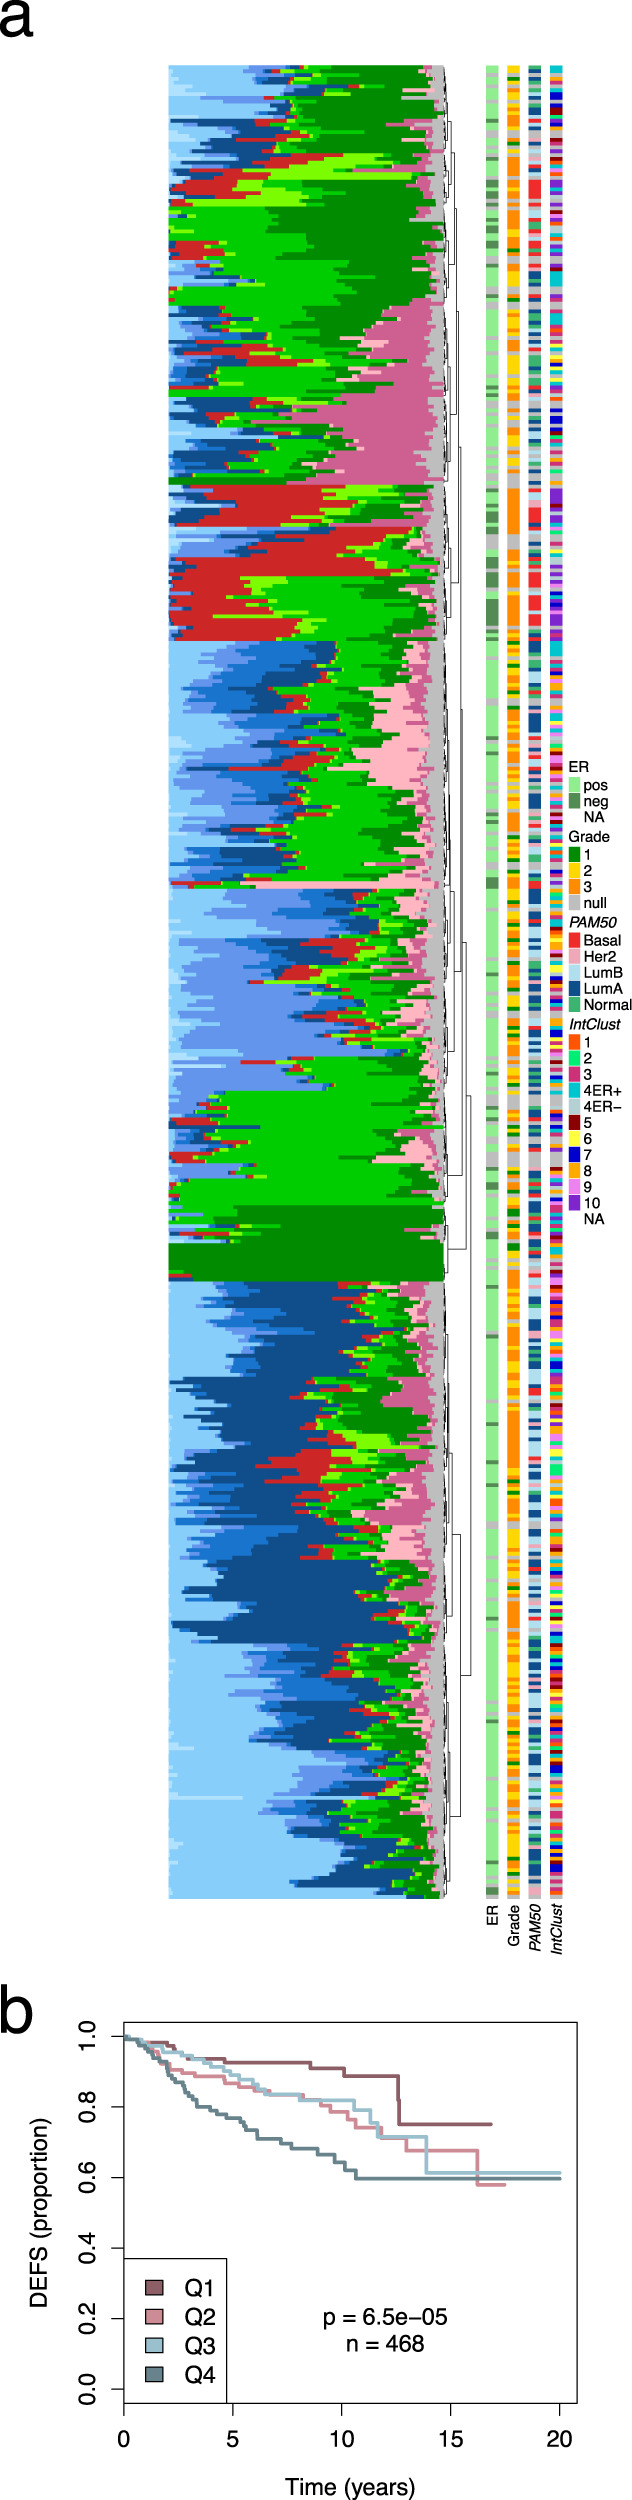
The heterogeneity of breast cancer plays a major role in drug response and resistance and has been extensively characterized at the genomic level. Here, a single-cell breast cancer mass cytometry (BCMC) panel is optimized to identify cell phenotypes and their oncogenic signalling states in a biobank of patient-derived tumour xenograft (PDTX) models representing the diversity of human breast cancer. The BCMC panel identifies 13 cellular phenotypes (11 human and 2 murine), associated with both breast cancer subtypes and specific genomic features. Pre-treatment cellular phenotypic composition is a determinant of response to anticancer therapies. Single-cell profiling also reveals drug-induced cellular phenotypic dynamics, unravelling previously unnoticed intra-tumour response diversity. The comprehensive view of the landscapes of cellular phenotypic heterogeneity in PDTXs uncovered by the BCMC panel, which is mirrored in primary human tumours, has profound implications for understanding and predicting therapy response and resistance.


Conflict of interest statement

C.C. is a member of AstraZeneca’s iMED External Science Panel, of Illumina’s Scientific Advisory Board, and is a recipient of research grants (administered by the University of Cambridge) from AstraZeneca, Genentech, Roche, and Servier. L.S.C. and S.S.C. are employees and shareholders of AstraZeneca. V.S. received research support from AstraZeneca, Novartis, Genentech and Tesaro. The remaining authors declare no competing interests.

Figures

Fig. 1
Fig. 1. Development of a mass cytometry antibody panel for breast cancer.
a Experimental workflow. Cell suspensions: Single-cell suspensions from PDTX samples or cell lines were derived as described in “Methods” and fixed in 4% PFA (in black) in batches of up to 20 samples; barcoding: individual samples were barcoded with the combination of the 6 palladium isotopes to enable multiplexing of up to 20 samples; cell staining and cytometry with time-of-flight (CyTOF): cell suspensions were stained with the breast cancer mass cytometry (BCMC) panel and then run through the Helios CyTOF platform. Protein markers were organised in 4 subpanels: HTC (human tumour compartment), MSC (mouse stroma compartment), OSA (oncogenic signalling activation) and CCA (cell cycle and apoptosis). b MC-based intensity distribution of HTC markers in a collection of 7 breast cancer cell lines (Ncells = 20,846). Horizontal lines (grey) represent overall median values across the samples. c tSNE plots of 7 breast cancer cell lines (as per panel b). Each spot represents a cell, coloured as per cell line of origin. All BCMC markers were included in the analysis. d tSNE plots as in c. Cells are coloured by the intensity of selected HTC markers, namely EGFR, HER2 and Keratin 8/18. All marker intensities are reported in Supplementary Fig. 1b. e tSNE plot of cells from 4 distinct samples: (i) 4T09, a mouse mammary tumour cell line, (ii) mPER, murine peritoneal tissue from NSG mice, (iii) the human breast cancer cell lines MCF7 and (iv) MDA-MB-231 (Ncells = 26,154). All BCMC markers were included in the analysis. f MC-based intensity distribution of selected HTC and MSC markers for cell lines in e. Horizontal lines (grey) represent overall median values across the samples. g Heatmap showing Earth Mover’s Distance (EMD) of OSA and CCA markers in MCF7 cells treated for 1 h with either vistusertib (1μM) or palbociclib (1μM) compared to the same cells in DMSO as a control (Ncells = 36,582). Expected changes in a subset of markers are indicated for each compound.
Fig. 2
Fig. 2. Characterisation of protein expression in breast cancer PDTXs using the BCMC panel.
a Histological and molecular features of the 53 PDTX models profiled by mass cytometry. Neg: IHC determined Negative, Pos: IHC determined positive, MUT: mutation present, WT: wild-type. b Heatmap of median expression of all proteins tested by BCMC panel across 53 PDTXs with their associated histological and molecular features on the right panels. PDTXs used as experimental set reference samples or originating from the same patient are represented in bold. The marker subpanel is colour coded as in Fig. 1a. c Heatmap of the pairwise Spearman’s correlation coefficient values of all markers across all PDTX cells (Ncells = 405,827). The marker subpanel is colour coded as in Fig. 1a. d tSNE plots showing single-cell level expression of all BCMC markers across 49 PDTXs (Ncells = 78,400). tSNE areas, where mutual exclusivity of 4 mTOR pathway effectors is present, are indicated by blue boxes. The marker subpanel is colour coded as in Fig. 1a.
Fig. 3
Fig. 3. Identification and distribution of major cell phenotypes in breast cancer PDTXs.
a Median expression intensity of all proteins tested by BCMC panel across 13 PhenoGraph-defined cell-clusters (CCs). Top barplot represents the prevalence of each CC across all PDTXs. The marker subpanel is colour coded as in Fig. 1a. b tSNE plot of cells from 49 PDTXs coloured based on PhenoGraph-defined CCs (Ncells = 78,400, Nmarkers = 29). Highlighted are the following cellular phenotypes or CCs: mouse stroma (orange), mesenchymal (green), luminal (blue), basal (red) and other mixed/epithelia (pink). c Barplots summarising the prevalence of each of the 13 CCs in all PDTX models ordered based on hierarchical clustering. Histological and molecular features are indicated in vertical bars to the right. PDTXs used as experimental set reference samples or originating from the same patient are represented in bold. d Simpson’s score based on 11 human CC proportions across all PDTXs. tSNE density plots of cell distribution for selected models with high and low phenotypic heterogeneity (PH) are shown. tSNE density plots for all the other models are shown in Supplementary Fig. 4d. e tSNE density plots of cell distribution for 3 PDTX models; dimensionality reduction was carried out including either HTC (upper panel; in grey) or OSA (lower panel, in blue) protein markers. See Supplementary Fig. 3e, f for the complete set of models. f Box plots of the average coefficient of variation (CV) computed per model (n = 49) for HTC (human tumour compartment), OSA (oncogenic signalling activation) or CCA (cell cycle and apoptosis) subpanel markers. Pairwise comparisons using two-sided Student’s t-test (pHTC-OSA < 2.2e−16, pHTC-CCA < 2.2e−16, pOSA-CCA = 0.035). In the box plots, the lower and upper hinges correspond to the first and third quartiles. The upper and lower whisker extends from the hinge to the largest value no further than 1.5 * IQR from the hinge. Data beyond the end of the whiskers are plotted individually.
Fig. 4
Fig. 4. Imaging mass cytometry reveals the spatial distribution of cell phenotypes in xenografts.
a Schematic representation of model-specific cross-mass cytometry cell-classifier (Nsamples = 15, Nmarkers = 10, Ncells = 99,336). From mass cytometry (MC) data, a model-specific cell-cluster (CC) classifier was trained and applied to imaging mass cytometry (IMC) from tissue microarray (TMA) segmented cells from the same model in order to classify cells into one of the CCs. b Distribution of MC-IMC centroid correlations (matching CC centroids in red; non-matching CC centroids in grey). Median values of matching and non-matching CC centroids are indicated by dashed vertical lines. c Examples of mapping of MC CCs to IMC data for AB551_M3a, AB630_M1 and STG139_T1a. From left to right: tSNE plot based on MC profiling coloured as in Fig. 3b; IMC image coloured for a subset of relevant markers representative of distinct CCs; pseudo-image with segmented cells labelled according to the classifier coloured as in Fig. 3b; two-point autocorrelation analysis results for each CC quantifying the deviation from a random cell distribution as a function of distance. Data are presented as mean values ± SD.
Fig. 5
Fig. 5. Integration of PDTX cell phenotypes with molecular features and drug-response data.
a Prevalence of different breast cancer subtypes as defined by IHC ER and HER2 status, PAM50 and IntClust subtypes across the 11 human cell-clusters (CCs) indicated in colour as in Fig. 3b. b Prevalence of somatic mutations in major breast cancer mutation-driver genes and copy number aberrations (CNAs) across the 11 human CCs. Yellow bars-significant enrichment (two-sided hypergeometric test, adjusted p < 0.01). Only aberrations with a prevalence >0.25 in at least 1 CC are shown (for a full list see Supplementary Fig. 6b). c Gene set Enrichment Analysis using the ‘Hallmark’ collection. Enrichment analysis was run for each CC after ranking all genes by their correlation with the CC prevalence. Significant enrichment (FDR < 0.01) is indicated by a black dot. Normalised enrichment score and positive/negative associations are indicated by the circle size and colour, respectively. For each CC, the top 5 gene sets with the highest positive enrichment and top 5 with negative enrichment were selected. The resulting list of unique gene sets is shown. d Heatmap of Spearman’s correlation between human CC prevalence and drug-response area under the drug-response curve (AUC) in a subset of PDTXs (10 ≤ n ≤ 22). A two-sided p-value < 0.05 is indicated by an asterisk. e Scatter plots of single CC prevalence against AZD7762 AUC (association for L4: Spearman correlation ρAZD7762 = −0.64, p = 0.003, two-sided; association for M3: Spearman correlation ρAZD7762 = 0.56, p = 0.009, two-sided). f tSNE plots of cells belonging to the 11 human CCs highlighting the proportion of M3 CC in 3 models (STG335_T1, HCI001_T1, HCI010_M1) with increased sensitivity to chemotherapy/DDR drugs (e.g. AZD7762). g Heatmap summarising the coefficient values assigned to each CC log-ratio by fitting regularised linear models to predict the response (AUC) to each compound (rows). R2 of the model score vs observed AUC are annotated on the right (asterisk indicating R2 > 0.5).
Fig. 6
Fig. 6. Intra-tumour cellular phenotypic dynamics induced by mTOR inhibition.
a Schematic representation of the experimental setting. Single-cell suspensions of 4 PDTX models were treated with vistusertib (dosed from 0.1 to 10 μM) for 2 h and analysed using the breast cancer mass cytometry (BCMC) approach. b Heatmap of Earth Mover’s distance of OSA markers in the 4 PDTX models treated with vistusertib (dosed from 0.1 to 10 μM) compared with DMSO control. c tSNE plots in untreated and vistusertib-treated (10 μM) conditions. The intensity of each oncogenic signalling activation (OSA) subpanel marker is indicated by the colour gradient. Two model-specific responses (p-ERK induction in STG143_T1 and lack of inhibition of p-S6 in STG139_M1) are indicated by blue boxes. d Cell density plots of tSNE analysis from panel c. e Average Coefficient of Variation (CV) for OSA markers in untreated and treated (10 μM) conditions in the 4 tested PDTX models. Pairwise comparisons using two-sided t-test (p = 0.016). f Cell-cluster (CC) dynamics in each PDTX model upon vistusertib treatment (dosed from 0.1 to 10 μM). The model-specific cross-MC cell-classifier was applied to classify cells into each CC. Unclassified cells are indicated in grey.
Fig. 7
Fig. 7. Xenograft cell phenotypes mapped onto primary human tumours.
a Barplots summarising the prevalence of each of the 11 human CCs in 481 METABRIC cases analysed by IMC. Samples are ordered based on hierarchical clustering of phenotypic profiles. Molecular data in vertical bars to the right. b Kaplan–Meier curves by quartile of values predicted with a regularised Cox model fitted to associate the phenotypic profile (as CC prevalence log ratios) with patients’ survival. DEFS distant event-free survival.

References

    1. Torre LA, Siegel RL, Ward EM, Jemal A. Global cancer incidence and mortality rates and trends–an update. Cancer Epidemiol. Biomark. Prev. 2016;25:16–27. doi: 10.1158/1055-9965.EPI-15-0578. - DOI - PubMed
    1. Gonzalez-Angulo AM, Morales-Vasquez F, Hortobagyi GN. Overview of resistance to systemic therapy in patients with breast cancer. Adv. Exp. Med. Biol. 2007;608:1–22. doi: 10.1007/978-0-387-74039-3_1. - DOI - PubMed
    1. Polyak K. Heterogeneity in breast cancer. J. Clin. Invest. 2011;121:3786–3788. doi: 10.1172/JCI60534. - DOI - PMC - PubMed
    1. Cancer Genome Atlas Network Comprehensive molecular portraits of human breast tumours. Nature. 2012;490:61–70. doi: 10.1038/nature11412. - DOI - PMC - PubMed
    1. Rueda OM, et al. Dynamics of breast-cancer relapse reveal late-recurring ER-positive genomic subgroups. Nature. 2019;567:399–404. doi: 10.1038/s41586-019-1007-8. - DOI - PMC - PubMed

Publication types

MeSH terms