. 2021 Jan 1;33(1):011905.
doi: 10.1063/5.0038180. Epub 2021 Jan 26.

On airborne virus transmission in elevators and confined spaces

Affiliations

On airborne virus transmission in elevators and confined spaces

Talib Dbouk et al. Phys Fluids (1994). .

Abstract

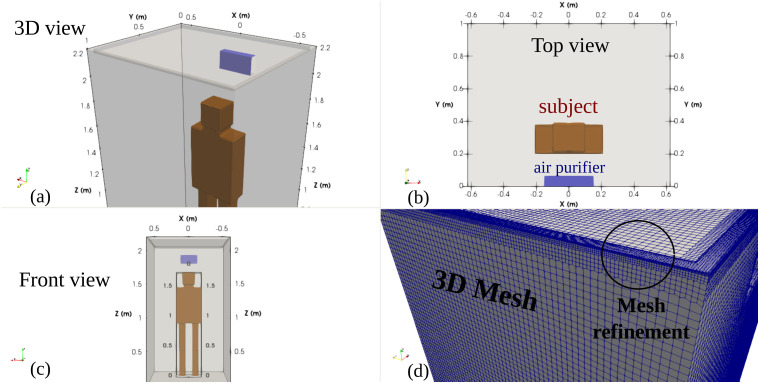
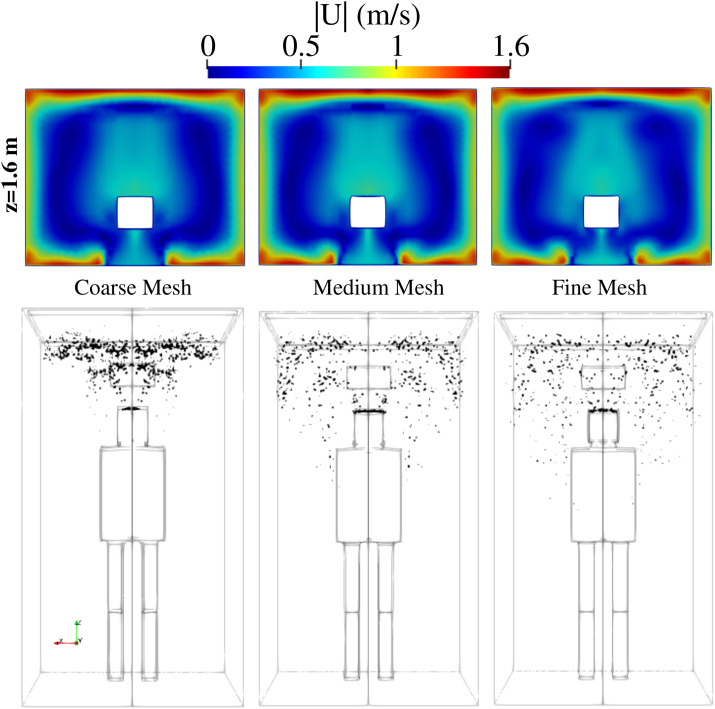
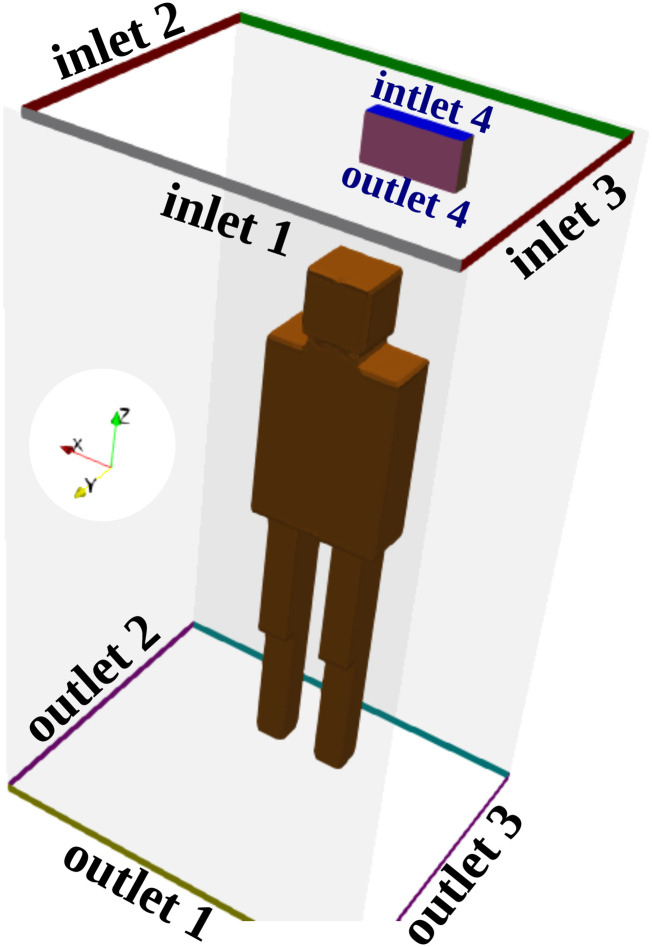
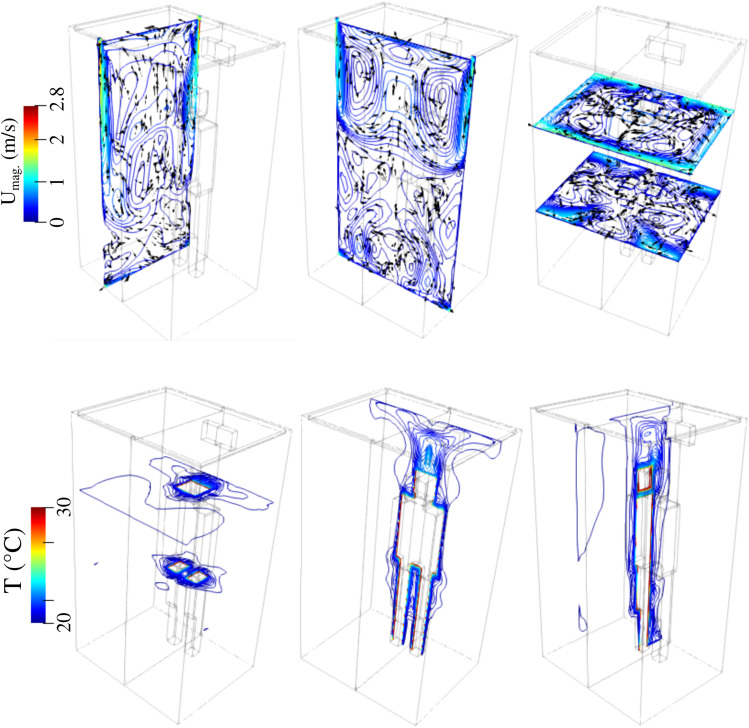
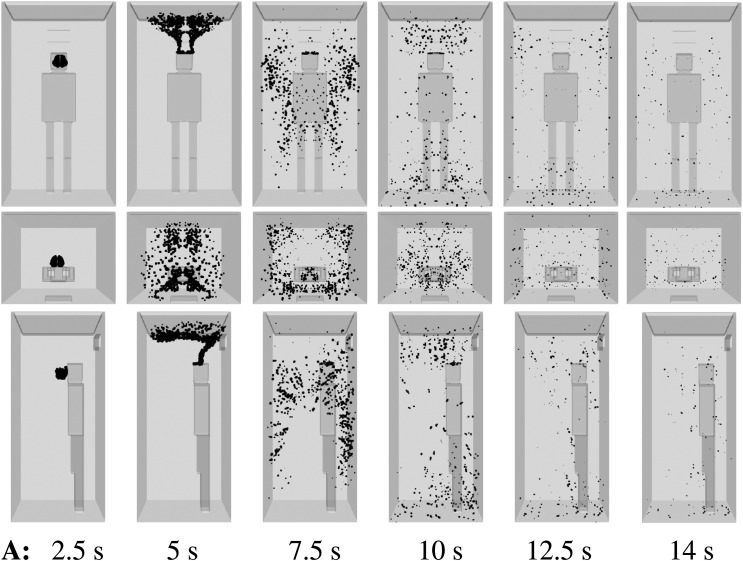
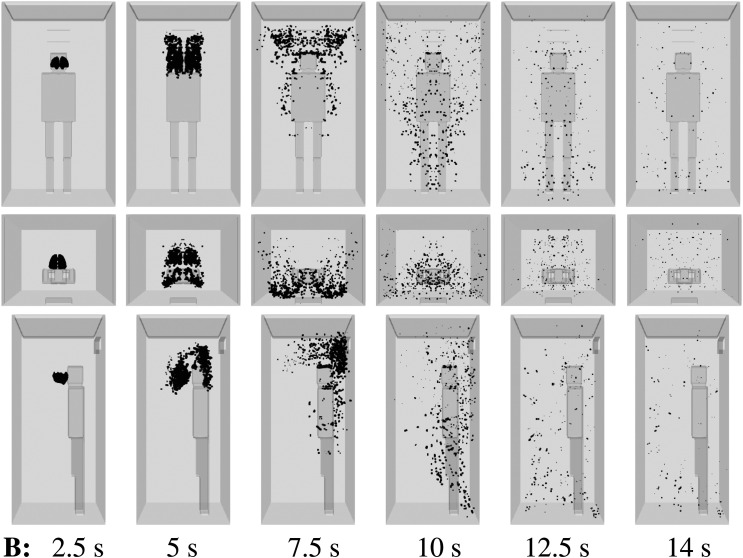
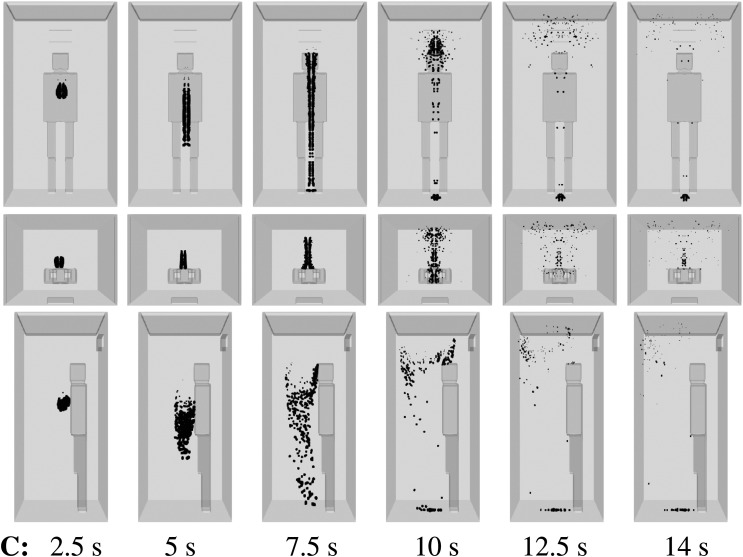
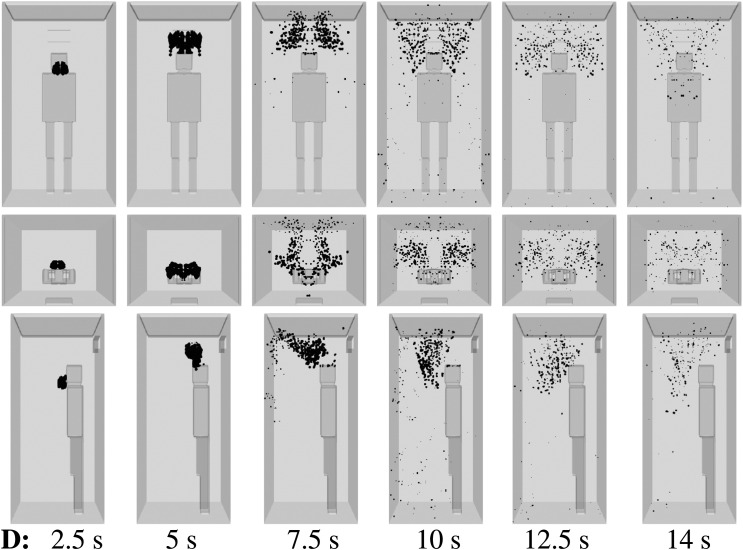
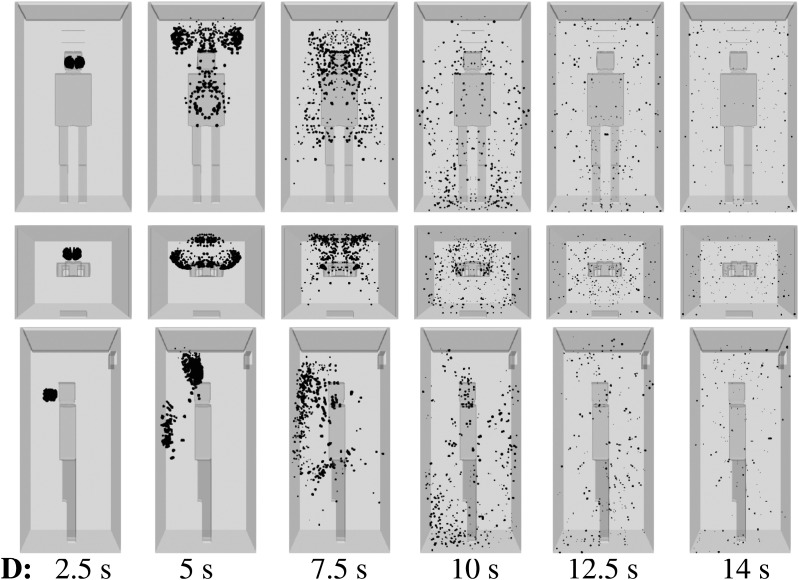
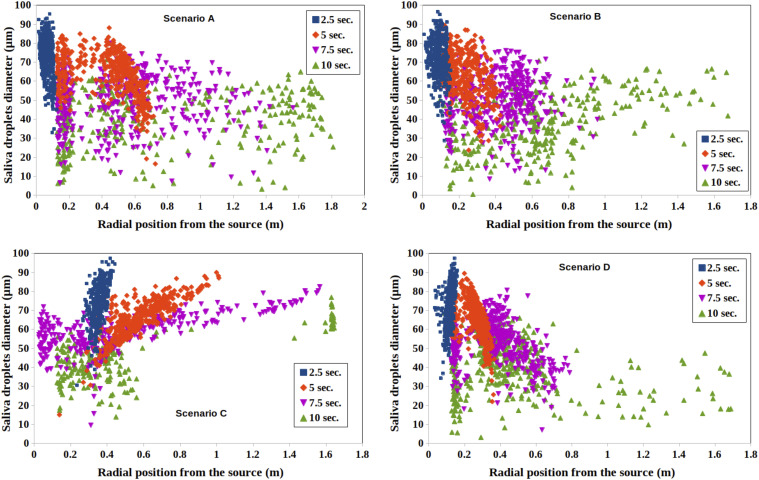
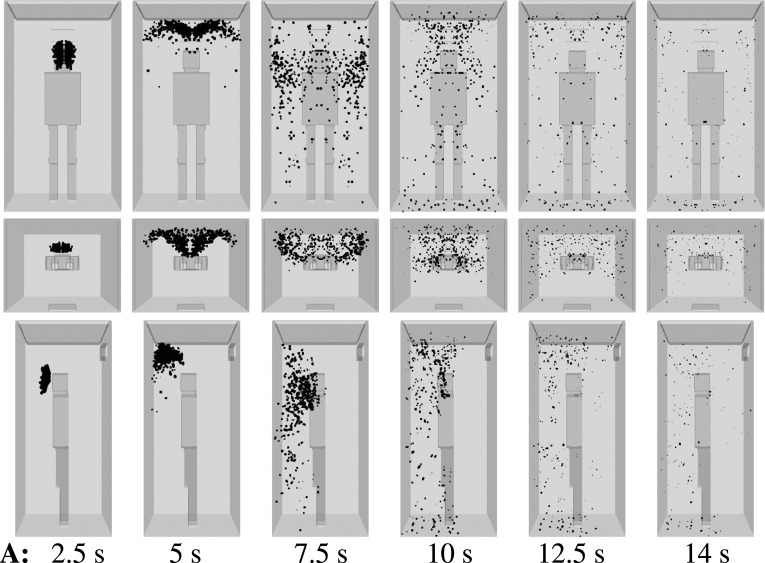
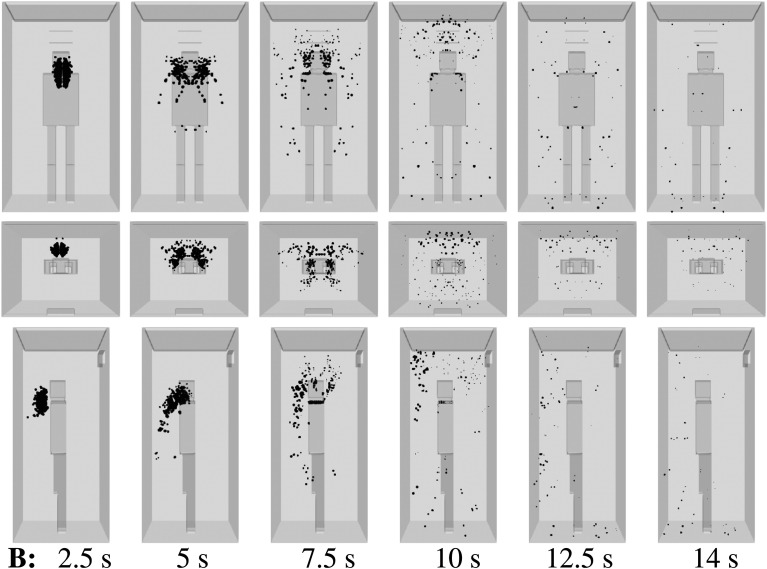
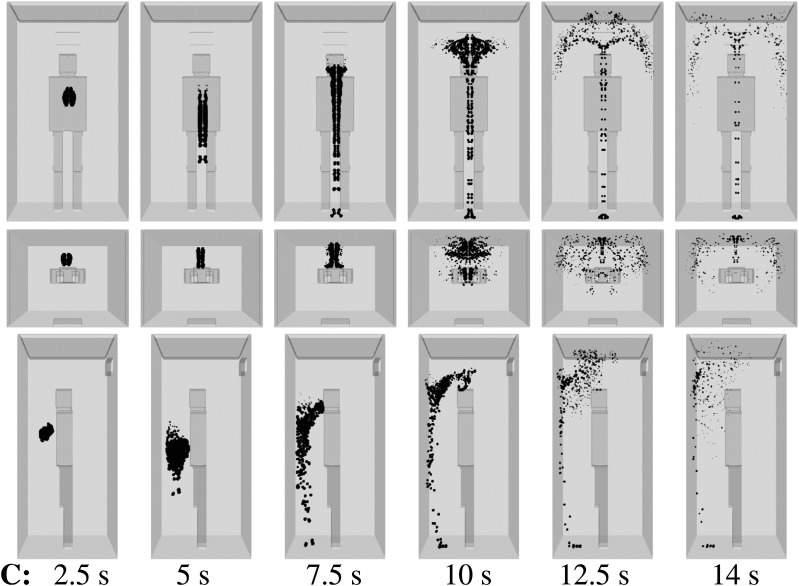
The impact of air ventilation systems on airborne virus transmission (AVT), and aerosols in general, in confined spaces is not yet understood. The recent pandemic has made it crucial to understand the limitations of ventilation systems regarding AVT. We consider an elevator as a prototypical example of a confined space and show how ventilation designs alone, regardless of cooling or heating, contribute to AVT. Air circulation effects are investigated through multiphase computational fluid dynamics, and the performance of an air purifier in an elevator for reducing AVT is assessed. We have investigated three different flow scenarios regarding the position and operation of inlets and outlets in the elevator and a fourth scenario that includes the operation of the air purifier. The position of the inlets and outlets significantly influences the flow circulation and droplet dispersion. An air purifier does not eliminate airborne transmission. The droplet dispersion is reduced when a pair of an inlet and an outlet is implemented. The overall practical conclusion is that the placement and design of the air purifier and ventilation systems significantly affect the droplet dispersion and AVT. Thus, engineering designs of such systems must take into account the flow dynamics in the confined space the systems will be installed.


Figures

FIG. 1.
FIG. 1.
Computational domain of a subject (human dummy) inside an elevator’s cabin of a maximum capacity of five persons. The subject is considered as a simple hexahedral cell geometry because the focus is on the main flow circulation inside the cabin away from the subject’s boundary. (a) 3D view showing the 2.2 m height of the cabin and an air purifier installed at z ≈ 1.9 m above the cabin’s ground (z = 0). (b) Top view illustrating the man’s position and the air purifier. (c) Front view. (d) Hexahedral 3D mesh (≈6 · 105) cells with mesh refinement near the inlets/outlets and near the subject’s boundary.
FIG. 2.
FIG. 2.
Scenario A—subject position 1. Mesh sensitivity analysis at t = 6 s. Top row: velocity magnitude in the plane z = 1.6 m. Bottom row: distribution of saliva droplets in space is illustrated in black after being scaled by a factor of about 250 with respect to their actual size. Fine mesh: 593 268 cells; medium mesh: 388 010 cells; coarse mesh: 284 850 cells. For the scenario A conditions, see Table I. Subject position 1 corresponds to a person who is standing in the elevator’s cabin such that her/his mouth as a coughing source is positioned at x = 0 m, y = 0.41 m, z = 1.6 m.
FIG. 3.
FIG. 3.
The flow curve of the fan integrated inside the sanitizer or air purifier.
FIG. 4.
FIG. 4.
Geometry showing the different inlets and outlets (δz = 3 cm opening) defined for the 3D computation domain. A subject is standing in the elevator’s cabin such that his mouth as a coughing source is positioned at x = 0 m, y = 0.41 m, z = 1.6 m. An air purifier (sanitizer) is attached to the wall at about 1.9 m above the ground of the elevator’s cabin. The air purifier has an air intake (outlet 4) and an air exhaust (inlet 4) for air circulation at ≈60 m3/h.
FIG. 5.
FIG. 5.
Scenario A–subject position 1. Top row: an example of the velocity magnitude at the planes x = 0.25 m, y = 0.6 m, z = 1.6 m and z = 0.8 m from left to right, respectively. Bottom row: an example of the temperature contour field at the planes x = 0.1 m, y = 0.25 m, z = 1.6 m and z = 0.8 m from left to right, respectively. The environment is at 20 °C and 50% relative humidity.
FIG. 6.
FIG. 6.
Scenario A—subject position 1. Top row: front view. Middle row: top view. Bottom row: side view. Contaminated saliva droplets are illustrated in black after being scaled by a factor of 250 with respect to their actual size. Subject position 1 corresponds to a person who is standing in the elevator’s cabin such that her/his mouth as a coughing source is positioned at x = 0 m, y = 0.41 m, z = 1.6 m. For the scenario A conditions, see Table I.
FIG. 7.
FIG. 7.
Scenario B—subject position 1. Top row: front view. Middle row: top view. Bottom row: side view. Contaminated saliva droplets are illustrated in black after being scaled by a factor of about 250 with respect to their actual size. Subject position 1 corresponds to a person who is standing in the elevator’s cabin such that her/his mouth as a coughing source is positioned at x = 0 m, y = 0.41 m, z = 1.6 m. For the scenario B conditions, see Table I.
FIG. 8.
FIG. 8.
Scenario C—subject position 1. Top row: front view. Middle row: top view. Bottom row: side view. Contaminated saliva droplets are illustrated in black after being scaled by a factor of about 250 with respect to their actual size. Subject position 1 corresponds to a person who is standing in the elevator’s cabin such that her/his mouth as a coughing source is positioned at x = 0 m, y = 0.41 m, z = 1.6 m. For the scenario C conditions, see Table I.
FIG. 9.
FIG. 9.
Scenario D—subject position 1. Top column: front view. Middle column: top view. Bottom column: side view. Contaminated saliva droplets are illustrated in black after being scaled by a factor of about 250 with respect to their actual size. Subject position 1 corresponds to a person who is standing in the elevator’s cabin such that her/his mouth as a coughing source is positioned at x = 0 m, y = 0.41 m, z = 1.6 m. For the scenario D conditions, see Table I.
FIG. 10.
FIG. 10.
Scenario D—subject position 2. Top column: front view. Middle column: top view. Bottom column: side view. Contaminated saliva droplets are illustrated in black after being scaled by a factor of about 250 with respect to their actual size. Subject position 2 corresponds to a person who is standing in the elevator’s cabin such that her/his mouth as a coughing source is positioned at x = 0 m, y = 0.675 m, z = 1.6 m. For the scenario D conditions, see Table I.
FIG. 11.
FIG. 11.
Quantitative analysis of dispersion of contaminated saliva droplets inside an elevator’s cabin resulting from a mild cough of an infected subject. The subject is at position 1 such that the source of the cough is positioned inside the lift at (x = 0, y = 0.41, z = 1.6) m (see Fig. 1). Four different ventilation scenarios A, B, C, and D are investigated according to Table I.
FIG. 12.
FIG. 12.
Scenario A—subject position 2. Top row: front view. Middle row: top view. Bottom row: side view. Contaminated saliva droplets are illustrated in black.
FIG. 13.
FIG. 13.
Scenario B—subject position 2. Top row: front view. Middle row: top view. Bottom row: side view. Contaminated saliva droplets are illustrated in black.
FIG. 14.
FIG. 14.
Scenario C—subject position 2. Top row: front view. Middle row: top view. Bottom row: side view. Contaminated saliva droplets are illustrated in black.

References

    1. WHO, Coronavirus Disease (COVID-19) (World Health Organization, 2020).
    1. Richard M., van den Brand J., Bestebroer T., Lexmond P., de Meulder D., Fouchier R., Lowen A., and Herfst S., “Influenza a viruses are transmitted via the air from the nasal respiratory epithelium of ferrets,” Nat. Commun. 11, 766 (2020).10.1038/s41467-020-14626-0 - DOI - PMC - PubMed
    1. Yan J., Grantham M., Pantelic J., Bueno de Mesquita P. J., Albert B., Liu F., Ehrman S., Milton D. K., and Consortium E., “Infectious virus in exhaled breath of symptomatic seasonal influenza cases from a college community,” Proc. Natl. Acad. Sci. U. S. A. 115(5), 1081–1086 (2018).10.1073/pnas.1716561115 - DOI - PMC - PubMed
    1. Xie X., Li Y., Sun H., and Liu L., “Exhaled droplets due to talking and coughing,” J. R. Soc., Interface 6, 703–714 (2009).10.1098/rsif.2009.0388.focus - DOI - PMC - PubMed
    1. Zhu S., Kato S., and Yang J.-H., “Study on transport characteristics of saliva droplets produced by coughing in a calm indoor environment,” Build. Environ. 41, 1691–1702 (2006).10.1016/j.buildenv.2005.06.024 - DOI

LinkOut - more resources