Performance Variability During Motor Learning of a New Balance Task in a Non-immersive Virtual Environment in Children With Hemiplegic Cerebral Palsy and Typically Developing Peers
- PMID: 33790848
- PMCID: PMC8005528
- DOI: 10.3389/fneur.2021.623200
Performance Variability During Motor Learning of a New Balance Task in a Non-immersive Virtual Environment in Children With Hemiplegic Cerebral Palsy and Typically Developing Peers
Abstract
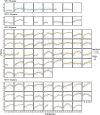
Background: Motor impairments contribute to performance variability in children with cerebral palsy (CP) during motor skill learning. Non-immersive virtual environments (VEs) are popular interventions to promote motor learning in children with hemiplegic CP. Greater understanding of performance variability as compared to typically developing (TD) peers during motor learning in VEs may inform clinical decisions about practice dose and challenge progression. Purpose: (1) To quantify within-child (i.e., across different timepoints) and between-child (i.e., between children at the same timepoint) variability in motor skill acquisition, retention and transfer in a non-immersive VE in children with CP as compared to TD children; and (2) To explore the relationship between the amount of within-child variability during skill acquisition and learning outcomes. Methods: Secondary data analysis of 2 studies in which 13 children with hemiplegic CP and 67 TD children aged 7-14 years undertook repeated trials of a novel standing postural control task in acquisition, retention and transfer sessions. Changes in performance across trials and sessions in children with CP as compared to TD children and between younger (7-10 years) and older (11-14 years) children were assessed using mixed effects models. Raw scores were converted to z-scores to meet model distributional assumptions. Performance variability was quantified as the standard deviation of z-scores. Results: TD children outperformed children with CP and older children outperformed younger children at each session. Older children with CP had the least between-child variability in acquisition and the most in retention, while older TD children demonstrated the opposite pattern. Younger children with CP had consistently high between-child variability, with no difference between sessions. Within-child variability was highest in younger children, regardless of group. Within-child variability was more pronounced in TD children as compared to children with CP. The relationship between the amount of within-child variability in performance and performance outcome at acquisition, retention and transfer sessions was task-specific, with a positive correlation for 1 study and a negative correlation in the other. Conclusions: Findings, though preliminary and limited by small sample size, can inform subsequent research to explore VE-specific causes of performance variability, including differing movement execution requirements and individual characteristics such as motivation, attention and visuospatial abilities.
Keywords: cerebral palsy; children; motor learning; variability; virtual environment; virtual reality.
Copyright © 2021 Cheng, Anderson and Levac.
Conflict of interest statement
The authors declare that the research was conducted in the absence of any commercial or financial relationships that could be construed as a potential conflict of interest.
Figures


References
Grants and funding
LinkOut - more resources
Full Text Sources
Other Literature Sources
Miscellaneous

