. 2021 Mar 15:12:637352.
doi: 10.3389/fpls.2021.637352. eCollection 2021.

An Arabidopsis Prolyl 4 Hydroxylase Is Involved in the Low Oxygen Response

Affiliations

An Arabidopsis Prolyl 4 Hydroxylase Is Involved in the Low Oxygen Response

Anna Konkina et al. Front Plant Sci. .

Abstract

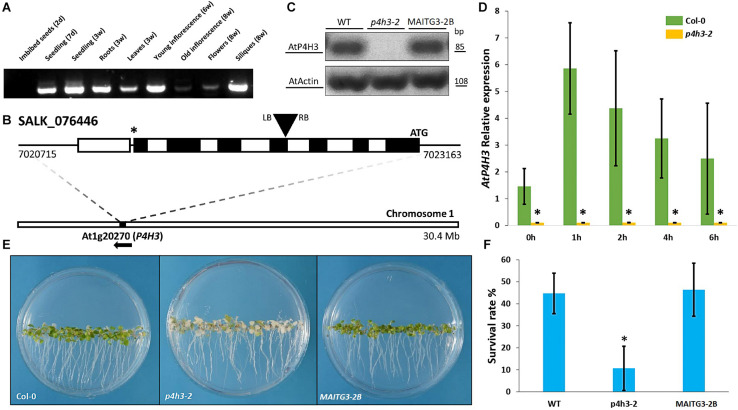
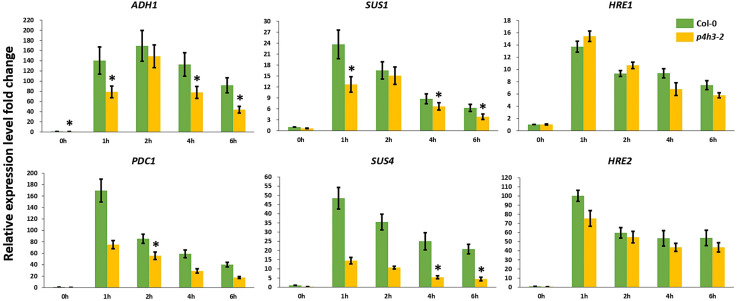
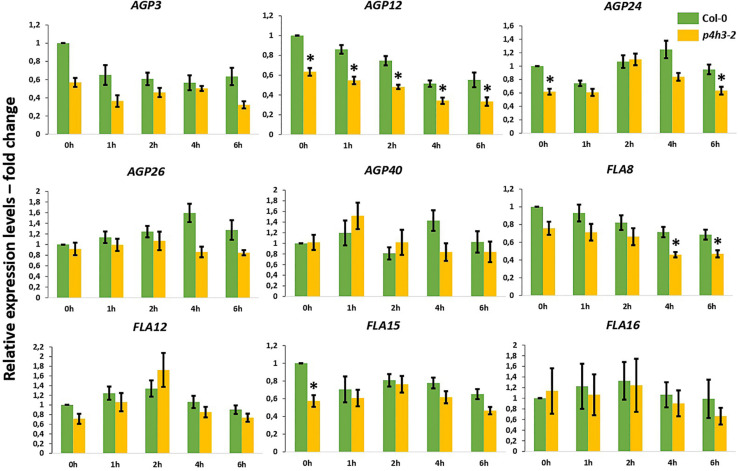
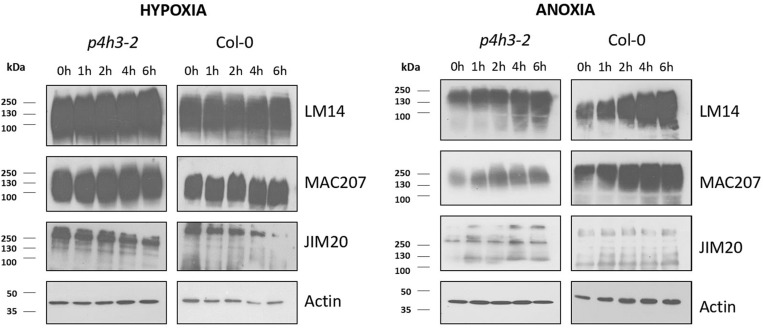
Plant responses to flooding, submergence and waterlogging are important for adaptation to climate change environments. Therefore, the characterization of the molecular mechanisms activated under hypoxic and anoxic conditions might lead to low oxygen resilient crops. Although in mammalian systems prolyl 4 hydroxylases (P4Hs) are involved in the oxygen sensing pathway, their role in plants under low oxygen has not been extensively investigated. In this report, an Arabidopsis AtP4H3 T-DNA knock out mutant line showed higher sensitivity to anoxic treatment possibly due to lower induction of the fermentation pathway genes, ADH and PDC1, and of sucrose synthases, SUS1 and SUS4. This sensitivity to anoxia was accompanied by lower protein levels of AGPs-bound epitopes such as LM14 in the mutant line and induction of extensins-bound epitopes, while the expression levels of the majority of the AGPs genes were stable throughout a low oxygen time course. The lower AGPs content might be related to altered frequency of proline hydroxylation occurrence in the p4h3 line. These results indicate active involvement of proline hydroxylation, a post-translational modification, to low oxygen response in Arabidopsis.

Keywords: ADH; AGPs; Arabidopsis thaliana; FLAs; anoxia; hypoxia; pDc; prolyl-4-hydroxylases.


Conflict of interest statement

The authors declare that the research was conducted in the absence of any commercial or financial relationships that could be construed as a potential conflict of interest.

Figures

FIGURE 1
FIGURE 1
Effects of AtP4H3 on oxygen deprivation tolerance. (A) Tissues-specific expression of AtP4H3 gene in Arabidopsis thaliana (Col-0) by using reverse transcription-PCR. (B) T-DNA mutant line insertion schematic of the genomic region corresponding to P4H3. The positions of the T-DNA insertion (black triangle), the initiating codon (ATG), and the stop codon (*) are indicated, along with the location and direction of the gene (At1g20270) on chromosome 1. Genomic AtP4H3 sequences are represented by exons (black boxes), introns (white boxes), and untranslated regions (black line). The T-DNA orientation is indicated by left (LB) and right (RB) borders. Coordinates are in bp and Mb at the gene and chromosome level, respectively. Features are drawn to scale. (C) AtP4H3 transcript levels in wild type, T-DNA mutant line (p4h3-2) and complementation (compl) line #2 in 7 day-old seedlings. The RT-PCR was performed with qPCR primers. Actin was used as internal control. (D) Relative expression of AtP4H3 in Col-0 (green bars) and p4h3-2 mutant (gold bars) plants in response to a hypoxic time course by using qPCR. Relative expression levels are shown as fold change values and the error bars represent standard errors. (E) Phenotypes of the wild type (Col-0), p4h3-2, and complementation line 2 exposed to 100% N2 for 7.5 h after a 3-day post-anoxic recovery. (F) Survival rates of 7 day-old Arabidopsis plants after 100% N2 treatment for 7.5 h. Fifty seeds were placed per 10 mm Petri dishes. Survival rates were scored as a percentage following 3 days of post-anoxic recovery under normal conditions (21% O2, air). Data are shown as mean survival rates, error bars show Standard error. The experiment was repeated at least three times.
FIGURE 2
FIGURE 2
(A) Histochemical localization of AtP4H3 promoter-GUS expression in 5 day-old transgenic Arabidopsis seedlings treated with 21% (a–e) and 1.5% O2 (f–j) for 3 h. (a,f) AtP4H3 promoter activity in columella cells and vasculature in differentiation and elongation root zones. (b,g) AtP4H3 promoter activity in columella cells in root tips. (c,h) AtP4H3 promoter activity in the stele. (d,i) AtP4H3 promoter activity in shoot apex region. (e,j) AtP4H3 promoter activity in leaf tips. The assay consisted of three biological replicates, with each biological replicate including 3–5 technical replicates. (B) Histochemical localization of AtP4H3 promoter-GUS expression in 7 day-old transgenic Arabidopsis seedlings treated with hypoxia (1.5% O2) and anoxia. (a–d) AtP4H3 promoter activity in root tips under hypoxia (1.5% O2) time-course. (e–h) AtP4H3 promoter activity in root tips under anoxia time-course.
FIGURE 3
FIGURE 3
Expression of anaerobic marker genes under hypoxia. The expression of six genes (ADH1, PDC1, SUS1, SUS4, HRE1, and HRE2) was analyzed under hypoxia (1.5% O2) in 7 days-old Arabidopsis seedlings: Col-0 (green bars) and p4h3-2 (gold bars). Relative expression levels are shown as fold change values. Asterisks represents statistical significance between Col-0 and p4h3-2 within a treatment and the error bars represent the standard error in expression values.
FIGURE 4
FIGURE 4
Expression of AGPs genes under hypoxia in the p4h3-2 line. The expression of nine AGPs – AGP3, AGP12, AGP24, AGP26, AGP40, FLA8, FLA12, FLA15, and FLA16 – was measured in hypoxic conditions (1.5% O2) in 7 day-old Arabidopsis seedlings. Col-0 (green bars) and p4h3-2 (gold bars) relative expression levels are shown as fold change values. Asterisks represent difference of significance between Col-0 and p4h3-2 within a treatment and error bars represent the standard error in expression values.
FIGURE 5
FIGURE 5
Western blot analysis of p4h3-2 and Col-0 seedlings using the LM14, MAC207, and JIM20 antibodies of AGPs. Total proteins (10 μl per lane) from Col-0 and p4h3-2 plants following hypoxia (left panel) and anoxia (right panel) treatments. Total proteins extracted from roots of 7 day-old seedlings subjected to hypoxia or anoxia for 0, 1, 2, 4, and 6 h were fractionated in SDS-PAGE in triplicate. Molecular masses are indicated on the left (kDa). At least three biological replicates were performed.

References

    1. Aguilar E. A., Turner D. W., Gibb D. J., Armstrong W., Sivasithamparam K. (2003). Oxygen distribution and movement, respiration and nutrient loading in banana roots (Musa spp. L.) subjected to aerated and oxygen-depleted environments. Plant Soil 253 91–102. 10.1023/A:1024598319404 - DOI
    1. Amano Y., Tsubouchi H., Shinohara H., Ogawa M., Matsubayashi Y. (2007). Tyrosine-sulfated glycopeptide involved in cellular proliferation and expansion in Arabidopsis. Proc. Natl. Acad. Sci. U.S.A. 104 18333–18338. 10.1073/pnas.0706403104 - DOI - PMC - PubMed
    1. Asif M. H., Trivedi P. K., Misra P., Nath P. (2009). Prolyl-4-hydroxylase (AtP4H1) mediates and mimics low oxygen response in Arabidopsis thaliana. Funct. Integr. Genomics 9 525–535. 10.1007/s10142-009-0118-y - DOI - PubMed
    1. Banti V., Loreti E., Novi G., Santaniello A., Alpi A., Perata P. (2008). Heat acclimation and cross-tolerance against anoxia in Arabidopsis. Plant Cell Environ. 31 1029–1037. 10.1111/j.1365-3040.2008.01816.x - DOI - PubMed
    1. Bieniawska Z., Paul Barratt D. H., Garlick A. P., Thole V., Kruger N. J., Martin C., et al. (2007). Analysis of the sucrose synthase gene family in Arabidopsis. Plant J. 49 810–828. 10.1111/j.1365-313X.2006.03011.x - DOI - PubMed