. 2022 Apr 7;66(Suppl 1):i111-i123.
doi: 10.1093/annweh/wxaa113.

Estimates of Inhalation Exposures to Oil-Related Components on the Supporting Vessels During the Deepwater Horizon Oil Spill

Affiliations

Estimates of Inhalation Exposures to Oil-Related Components on the Supporting Vessels During the Deepwater Horizon Oil Spill

Tran B Huynh et al. Ann Work Expo Health. .

Erratum in

Abstract

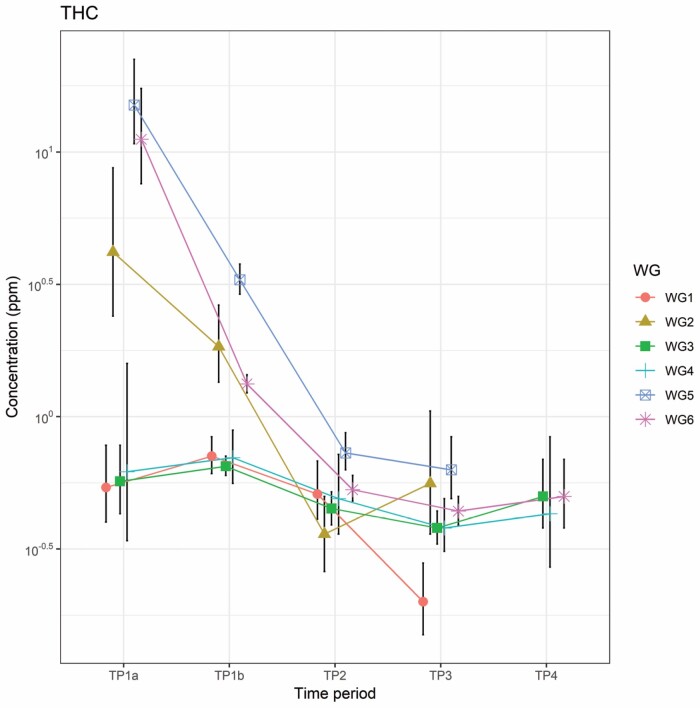
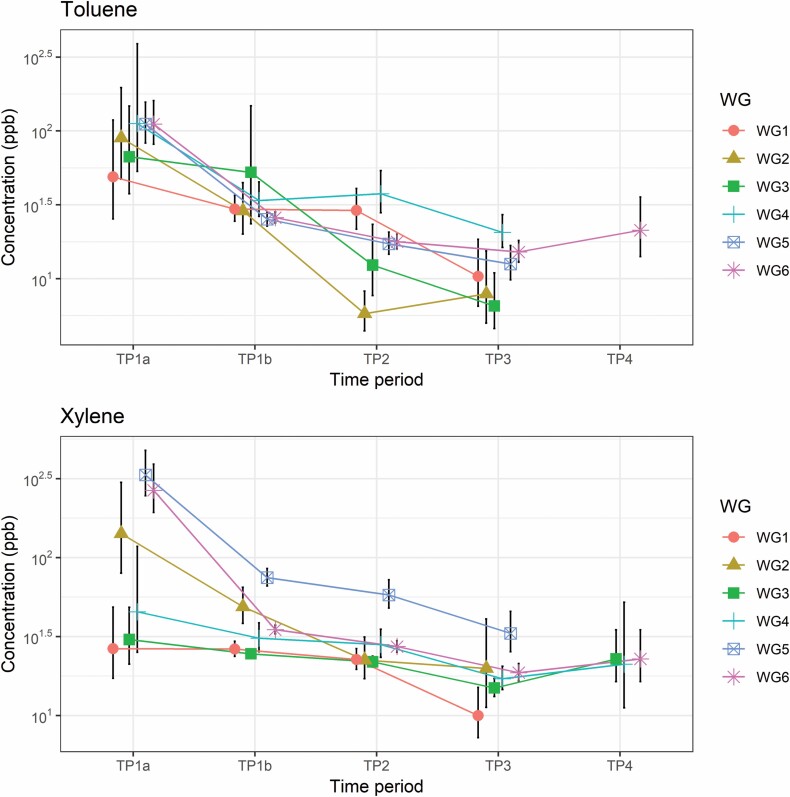
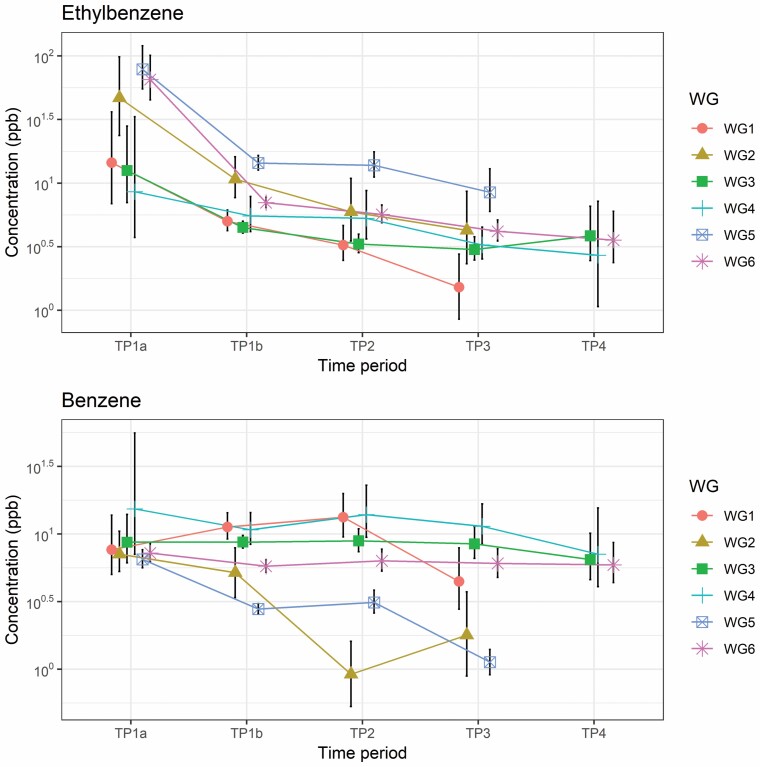
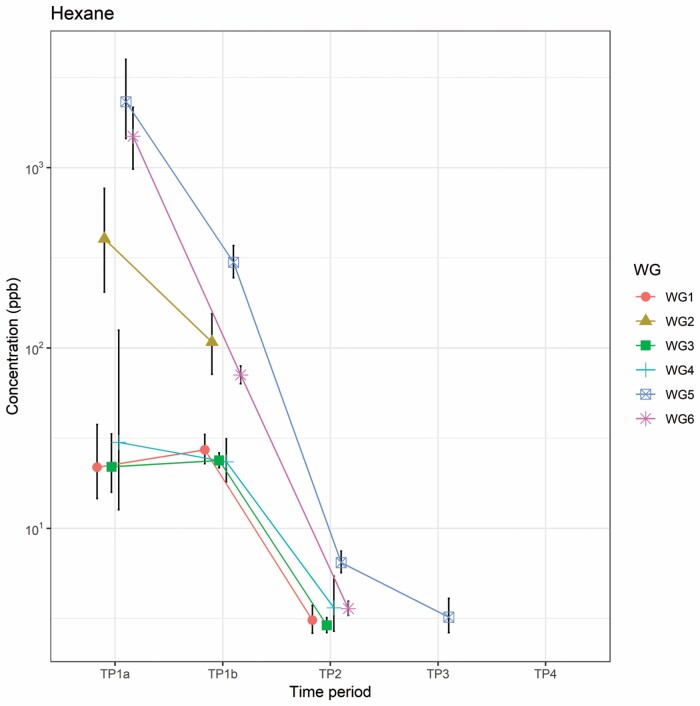
The Deepwater Horizon oil spill response and clean-up (OSRC) involved over 9000 large and small vessels deployed in waters of the Gulf of Mexico across four states (Alabama, Florida, Louisiana, and Mississippi). For the GuLF STUDY, we developed exposure estimates of oil-related components for many work groups to capture a wide range of OSRC operations on these vessels, such as supporting the four rig vessels charged with stopping the spill at the wellhead; skimming oil; in situ burning of oil; absorbing and containing oil by boom; and environmental monitoring. Work groups were developed by: (i) vessel activity; (ii) location (area of the Gulf or state); and (iii) time period. Using Bayesian methods, we computed exposure estimates for these groups for: total hydrocarbons measured as total petroleum hydrocarbons (THC), benzene, toluene, ethylbenzene, xylene, and n-hexane (BTEX-H). Estimates of the arithmetic means for THC ranged from 0.10 ppm [95% credible interval (CI) 0.04, 0.38 ppm] in time periods 2 and 3 (16 July-30 September 2010) to 15.06 ppm (95% CI 10.74, 22.41 ppm) in time period 1a (22 April-15 May 2010). BTEX-H estimates were substantially lower (in the parts per billion range). Exposure levels generally fell over time and differed statistically by activity, location, and time for some groups. These exposure estimates have been used to develop job-exposure matrices for the GuLF STUDY.

Keywords: Deepwater Horizon oil spill; Bayesian methods; exposure assessment; job exposure matrix; occupational exposures.


Figures

Figure 1.
Figure 1.
(a) Time trends of the AM estimates of selected work groups (WGs) for ‘All states’ for THC: WG1 (‘Vessel put out, inspected, moved, or collected booms or absorbents’), WG2 (‘IH/Safetywater’), WG3 (‘Vessel could see shoreline (nearshore)’), WG4 (‘Vessel handled oily boom and absorbents, and personally handled oily boom’), WG5 (‘Could see wellhead from vessel’), and WG6 (‘Worked on a boat or ship’). Note differences in the scale and measurement units of each graph. See Supplementary Material (available at Annals of Work Exposures and Health online) for definitions of time period. (b) Time trends of the AM estimates of selected WGs for ‘All states’ for toluene and xylene. (c) Time trends of the AM estimates of selected WGs for ‘All states’ for ethylbenzene and benzene. (d) Time trends of the AM estimates of selected WGs for ‘All states’ for hexane. The WGs are the same as THC.
Figure 1.
Figure 1.
(a) Time trends of the AM estimates of selected work groups (WGs) for ‘All states’ for THC: WG1 (‘Vessel put out, inspected, moved, or collected booms or absorbents’), WG2 (‘IH/Safetywater’), WG3 (‘Vessel could see shoreline (nearshore)’), WG4 (‘Vessel handled oily boom and absorbents, and personally handled oily boom’), WG5 (‘Could see wellhead from vessel’), and WG6 (‘Worked on a boat or ship’). Note differences in the scale and measurement units of each graph. See Supplementary Material (available at Annals of Work Exposures and Health online) for definitions of time period. (b) Time trends of the AM estimates of selected WGs for ‘All states’ for toluene and xylene. (c) Time trends of the AM estimates of selected WGs for ‘All states’ for ethylbenzene and benzene. (d) Time trends of the AM estimates of selected WGs for ‘All states’ for hexane. The WGs are the same as THC.

References

    1. American Conference & Governmental Industrial Hygiene (ACGIH) . (2018) TLVs® and BEIs® based on the documentation of the threshold limit values for chemical substances and physical agents & biological exposure indices. Cincinnati, OH: ACGIH.
    1. Arnold SF, Shao Y, Ramachandran G. (2017) Evaluating well-mixed room and near-field–far-field model performance under highly controlled conditions. J Occup Environ Hyg; 14: 427–37. - PMC - PubMed
    1. Arnold S, Stewart PA, Pratt GCet al. (2021) Estimation of aerosol concentrations of oil dispersants COREXIT™EC9527A and EC9500A during the Deepwater Horizon oil spill response and clean-up operations. Ann Work Expo Health; 65: i188–i201. - PMC - PubMed
    1. Avens HJ, Unice KM, Sahmel Jet al. (2011) Analysis and modeling of airborne BTEX concentrations from the Deepwater Horizon oil spill. Environ Sci Technol; 45: 7372–9. - PubMed
    1. Gorman Ng, Cherrie JW, Sleeuwenhoek Aet al. (2021) GuLF DREAM: a model to estimate dermal exposure among oil spill response and clean-up workers. Ann Work Exp Health; 65: i218–i233. - PMC - PubMed

Publication types