. 2021 Jul 5;31(8):3881-3898.
doi: 10.1093/cercor/bhab056.

Age-Related Differences in White Matter: Understanding Tensor-Based Results Using Fixel-Based Analysis

Affiliations

Age-Related Differences in White Matter: Understanding Tensor-Based Results Using Fixel-Based Analysis

Shannon Kelley et al. Cereb Cortex. .

Abstract

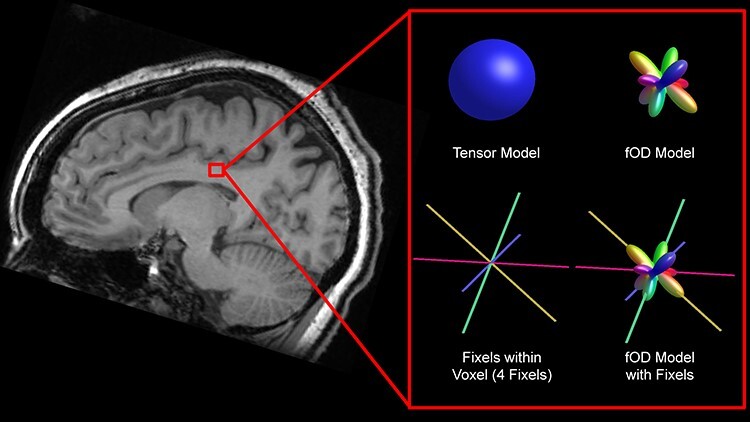
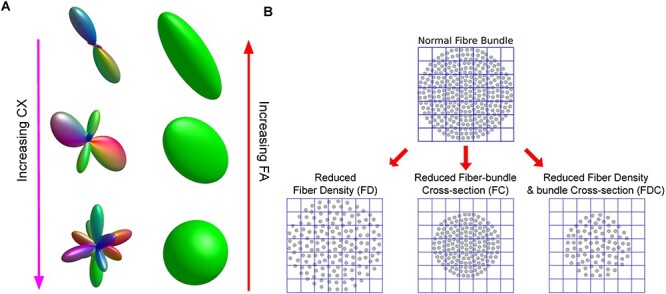
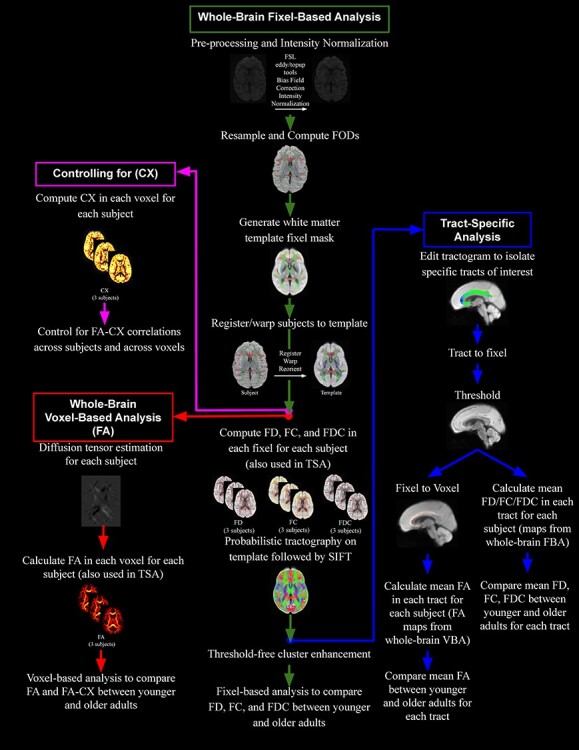
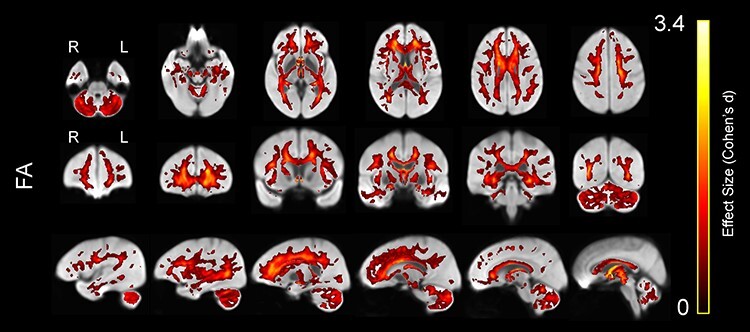
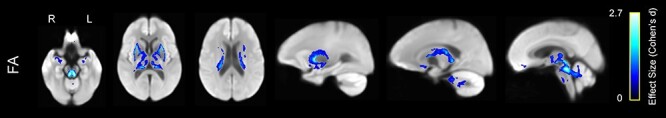
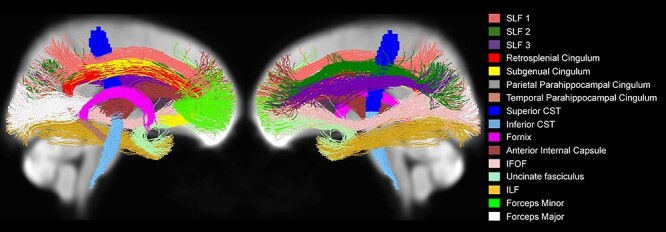
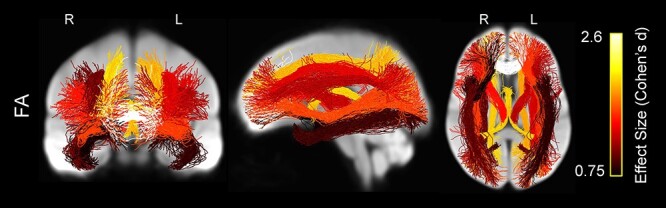
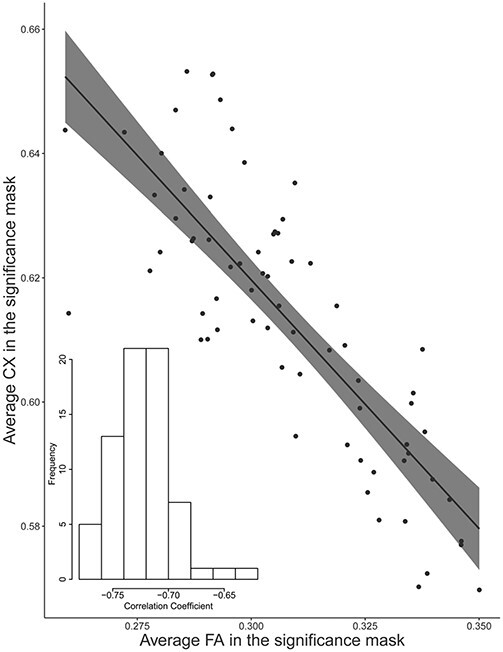
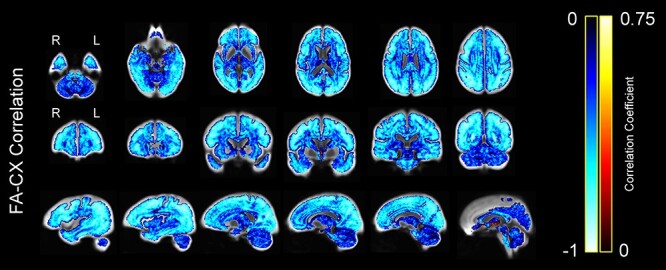
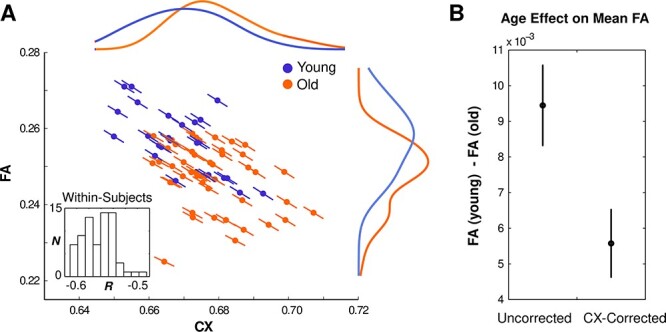
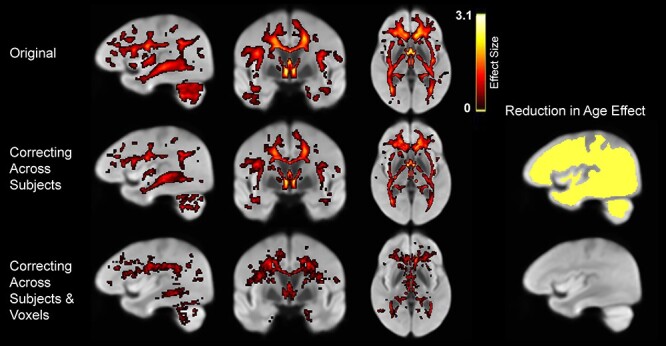
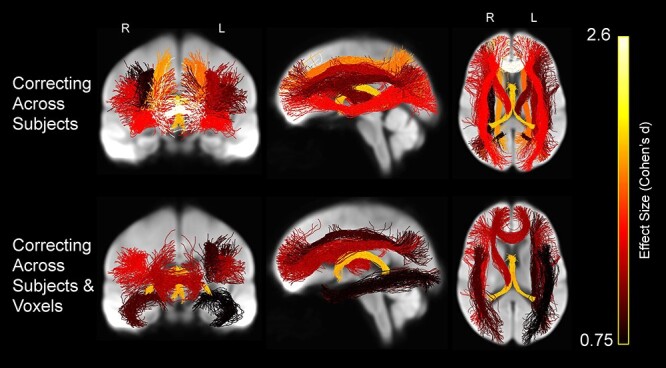
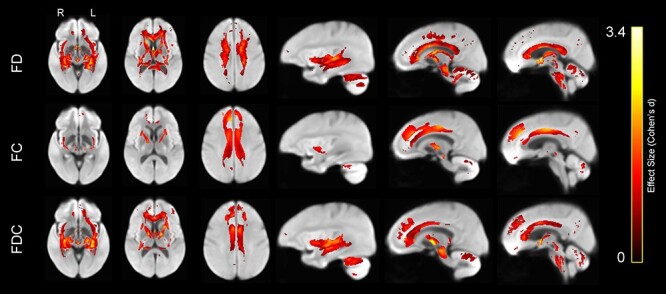
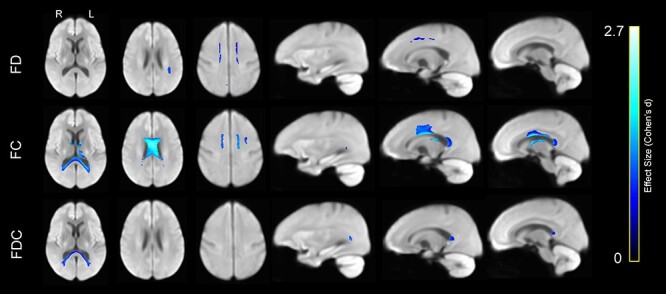
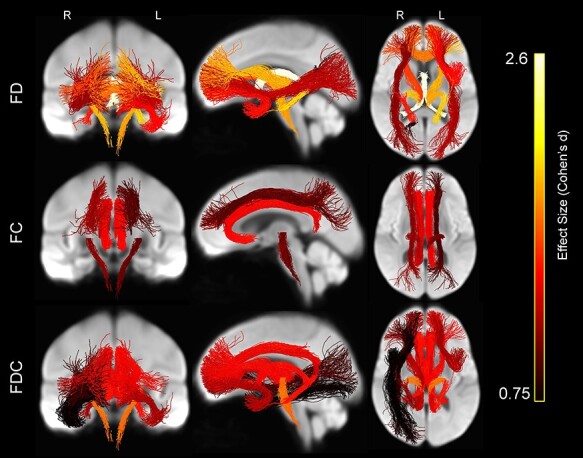
Aging is associated with widespread alterations in cerebral white matter (WM). Most prior studies of age differences in WM have used diffusion tensor imaging (DTI), but typical DTI metrics (e.g., fractional anisotropy; FA) can reflect multiple neurobiological features, making interpretation challenging. Here, we used fixel-based analysis (FBA) to investigate age-related WM differences observed using DTI in a sample of 45 older and 25 younger healthy adults. Age-related FA differences were widespread but were strongly associated with differences in multi-fiber complexity (CX), suggesting that they reflected differences in crossing fibers in addition to structural differences in individual fiber segments. FBA also revealed a frontolimbic locus of age-related effects and provided insights into distinct microstructural changes underlying them. Specifically, age differences in fiber density were prominent in fornix, bilateral anterior internal capsule, forceps minor, body of the corpus callosum, and corticospinal tract, while age differences in fiber cross section were largest in cingulum bundle and forceps minor. These results provide novel insights into specific structural differences underlying major WM differences associated with aging.

Keywords: aging; diffusion; fixel; tensor; white matter.


Figures

Figure 1
Figure 1
Tensor and fOD model for a single voxel with corresponding fixels, with location displayed on T1 image of corresponding subject.
Figure 2
Figure 2
Graphical illustration of complexity (CX), FA, FD, FC, and FDC. (A) fOD model and tensor model in the same voxels, in which complexity increases from top to bottom while FA decreases. (B) An illustration of the FBA metrics FD, FC, and FDC adapted from Elsevier: Neuroimage. Investigating white matter fibre density and morphology using fixel-based analysis. Raffelt et al. (2017) under a Creative Commons CC_BY license.
Figure 3
Figure 3
Diagram displaying the workflow for four of the different analyses conducted in the current study.
Figure 4
Figure 4
Lower WM FA in older compared with younger adults, displayed on the WM population template. Colors represent voxels in which FA was significantly lower in the older compared with the younger group, with brighter colors representing larger effect sizes (Cohen’s d).
Figure 5
Figure 5
Greater WMFA in older compared with younger adults, displayed on the WM population template. Colors represent voxels in which FA was significantly greater in the older compared with the younger group, with brighter colors representing larger effect size (Cohen’s d).
Figure 6
Figure 6
The 16 tracts that were included in the tract-specific analyses, displayed on the WM population template.
Figure 7
Figure 7
Whole-brain projections onto 2D slices showing WM tracts in which average FA was significantly lower in the older versus younger participants, displayed on the WM population template. Streamlines within each tract are colored by the tract’s effect size (Cohen’s d), with brighter colors representing greater effect size.
Figure 8
Figure 8
Correlation between average FA and average CX within the significance mask across subjects (P < 0.001 and r = −0.81). The bottom left corner contains a histogram displaying the frequency of correlation coefficients between FA and CX across voxels within each subject. The mean correlation coefficient was r = −0.72.
Figure 9
Figure 9
Correlation between FA and CX across subjects at each voxel, displayed on the WM population template. Colors represent the strength of the negative or positive correlation coefficient for each voxel, with brighter colors representing stronger correlation coefficients.
Figure 10
Figure 10
Relationship between CX, FA, and age. (A) Correlations between CX and FA across subject means (colored points) and across voxels within each subject (slopes: colored lines; the inset displays a histogram of the distribution of these within-participant correlation coefficients). Colors indicate age group (blue = young; orange = old). Colored curves show interpolated histograms (kernel density plots) of subject means for each group. (B) Observed age differences in mean FA before (left) and after (right) statistically controlling for CX–FA correlations across subjects.
Figure 11
Figure 11
Effects of controlling for complexity. (Left) Apparent age differences in FA in the original data (top), after controlling for CX–FA correlations across subjects (middle) and then across voxels (bottom). (Right) Voxels exhibiting significantly reduced age differences in FA after each stage of correction.
Figure 12
Figure 12
Whole-brain projections onto 2D slices showing WM tracts in which average FA was significantly lower in the older versus younger participants after controlling for complexity (FA–CX), displayed on the WM population template. Streamlines within each tract are colored by the tract’s effect size (Cohen’s d), with brighter colors representing greater effect size.
Figure 13
Figure 13
Lower WM FD (top row), FC (middle row), and the product of FDC (bottom row) in older compared with younger adults, displayed on the WM population template. Colors represent fixels in which the corresponding measure was significantly lower in the older compared with the younger group, with brighter colors representing larger effect size (Cohen’s d).
Figure 14
Figure 14
Greater WM FD (top row), FC (middle row), and the product of FDC (bottom row) in older compared with younger adults, displayed on the WM population template. Colors represent fixels in which the corresponding measure was significantly greater in the older compared with the younger group, with brighter colors representing larger effect size (Cohen’s d).
Figure 15
Figure 15
Whole-brain projections onto 2D slices showing WM tracts in which average FD (top row), average FC (middle row), and the product of average FDC (bottom row) were significantly lower in the older versus younger participants, displayed on the WM population template. Brighter colors represent greater effect size (Cohen’s d).

References

    1. Aboitiz F, Scheibel AB, Fisher RS, Zaidel E. 1992. Individual differences in brain asymmetries and fiber composition in the human corpus callosum. Brain Res. 598(1–2):154–161. doi: 10.1016/0006-8993(92)90179-d. - DOI - PubMed
    1. Alexander D, Barker G, Arridge S. 2002. Detection and modeling of non-Gaussian apparent diffusion coefficient profiles in human brain data. Magn Reson Med. 48(2):331–340. doi: 10.1002/mrm.10209. - DOI - PubMed
    1. Assaf Y, Basser PJ. 2005. Composite hindered and restricted model of diffusion (CHARMED) MR imaging of the human brain. Neuroimage. 27(1):48–58. doi: 10.1016/j.neuroimage.2005.03.042. - DOI - PubMed
    1. Beaulieu C. 2002. The basis of anisotropic water diffusion in the nervous system - a technical review. NMR Biomed. 15(7–8):435–455. doi: 10.1002/nbm.782. - DOI - PubMed
    1. Bender AR, Völkle MC, Raz N. 2015. Differential aging of cerebral white matter in middle-aged and older adults: a seven-year follow-up. Neuroimage. 125:74–83. doi: 10.1016/j.neuroimage.2015.10.030. - DOI - PMC - PubMed

Publication types

MeSH terms