

Clinical validation of a computerized algorithm to determine mean systemic filling pressure
- PMID: 33791920
- PMCID: PMC8011774
- DOI: 10.1007/s10877-020-00636-2
Clinical validation of a computerized algorithm to determine mean systemic filling pressure
Abstract
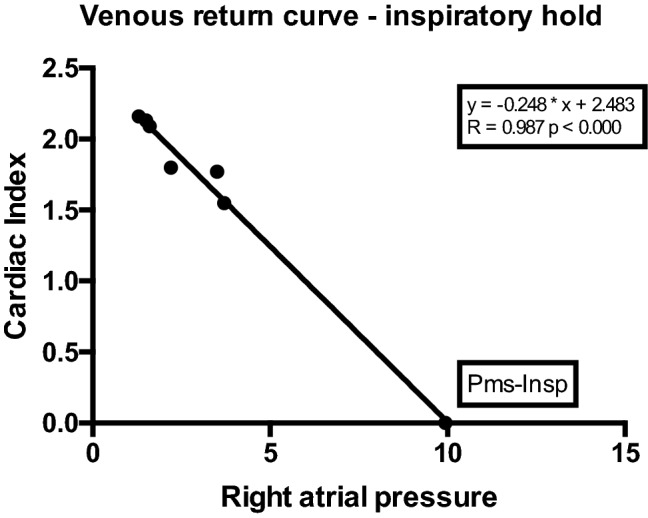
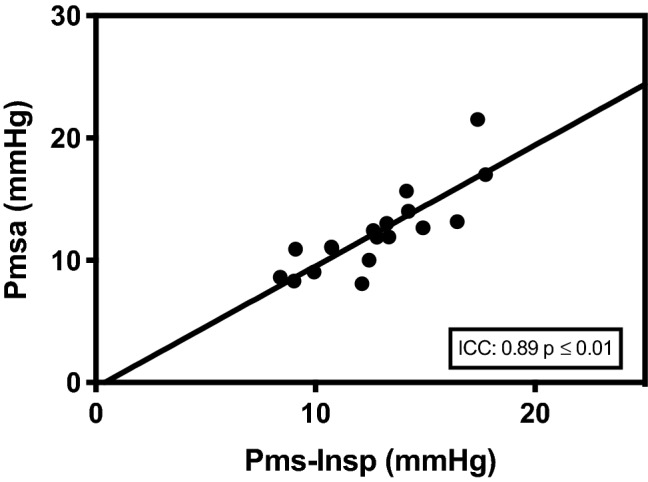
Mean systemic filling pressure (Pms) is a promising parameter in determining intravascular fluid status. Pms derived from venous return curves during inspiratory holds with incremental airway pressures (Pms-Insp) estimates Pms reliably but is labor-intensive. A computerized algorithm to calculate Pms (Pmsa) at the bedside has been proposed. In previous studies Pmsa and Pms-Insp correlated well but with considerable bias. This observational study was performed to validate Pmsa with Pms-Insp in cardiac surgery patients. Cardiac output, right atrial pressure and mean arterial pressure were prospectively recorded to calculate Pmsa using a bedside monitor. Pms-Insp was calculated offline after performing inspiratory holds. Intraclass-correlation coefficient (ICC) and assessment of agreement were used to compare Pmsa with Pms-Insp. Bias, coefficient of variance (COV), precision and limits of agreement (LOA) were calculated. Proportional bias was assessed with linear regression. A high degree of inter-method reliability was found between Pmsa and Pms-Insp (ICC 0.89; 95%CI 0.72-0.96, p = 0.01) in 18 patients. Pmsa and Pms-Insp differed not significantly (11.9 mmHg, IQR 9.8-13.4 vs. 12.7 mmHg, IQR 10.5-14.4, p = 0.38). Bias was -0.502 ± 1.90 mmHg (p = 0.277). COV was 4% with LOA -4.22 - 3.22 mmHg without proportional bias. Conversion coefficient Pmsa ➔ Pms-Insp was 0.94. This assessment of agreement demonstrates that the measures Pms-Insp and the computerized Pmsa-algorithm are interchangeable (bias -0.502 ± 1.90 mmHg with conversion coefficient 0.94). The choice of Pmsa is straightforward, it is non-interventional and available continuously at the bedside in contrast to Pms-Insp which is interventional and calculated off-line. Further studies should be performed to determine the place of Pmsa in the circulatory management of critically ill patients. ( www.clinicaltrials.gov ; TRN NCT04202432, release date 16-12-2019; retrospectively registered).Clinical Trial Registration www.ClinicalTrials.gov , TRN: NCT04202432, initial release date 16-12-2019 (retrospectively registered).
Keywords: Cardiac output; Inspiratory hold; Mean systemic filling pressure; Right atrial pressure; Venous return.
© 2021. The Author(s).
Conflict of interest statement
The authors declare that they have no conflict of interest.
Figures

References
Publication types
MeSH terms
Associated data
LinkOut - more resources
Full Text Sources
Other Literature Sources
Medical
