

Identification of high-dimensional omics-derived predictors for tumor growth dynamics using machine learning and pharmacometric modeling
- PMID: 33792207
- PMCID: PMC8099445
- DOI: 10.1002/psp4.12603
Identification of high-dimensional omics-derived predictors for tumor growth dynamics using machine learning and pharmacometric modeling
Abstract
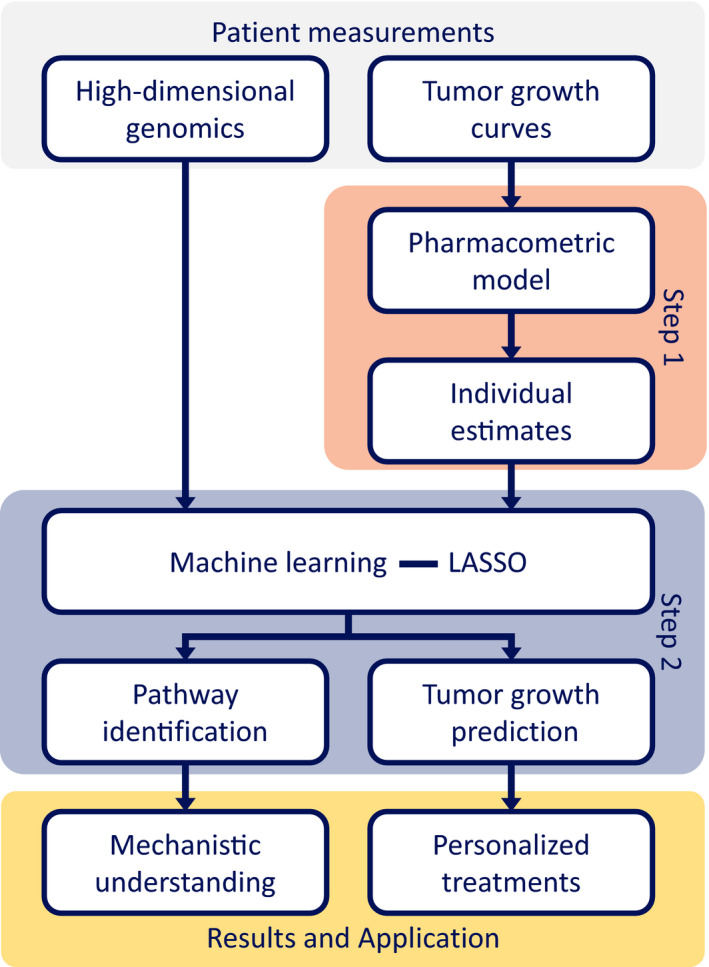
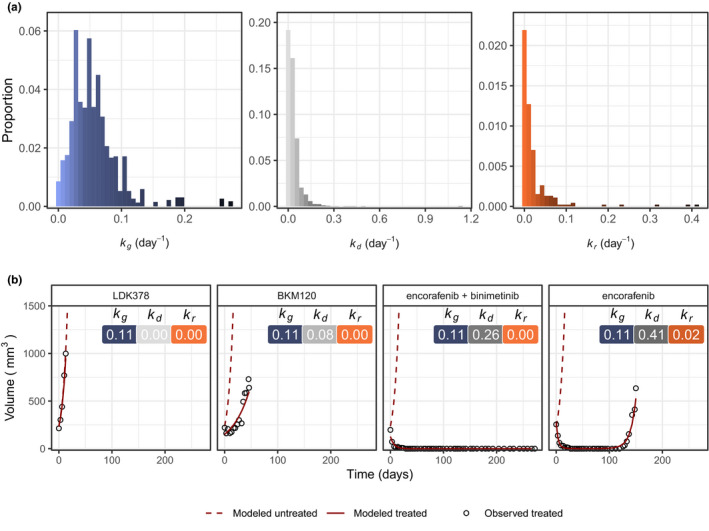
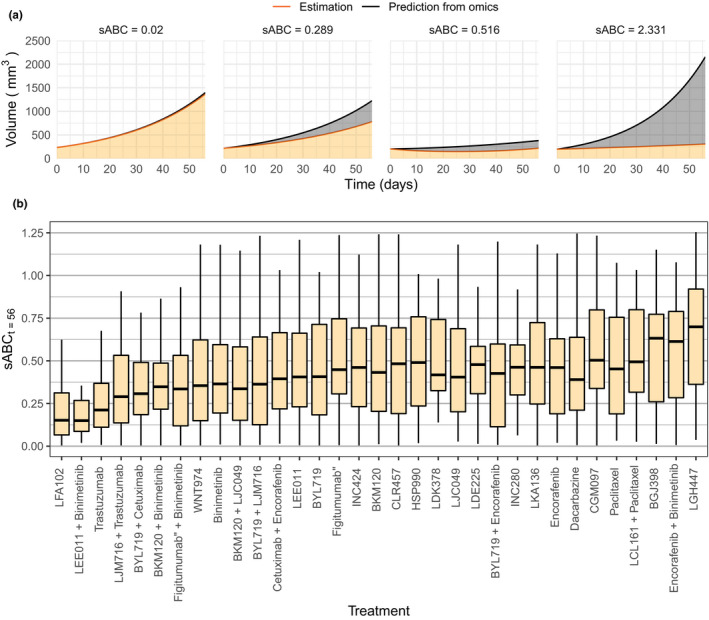
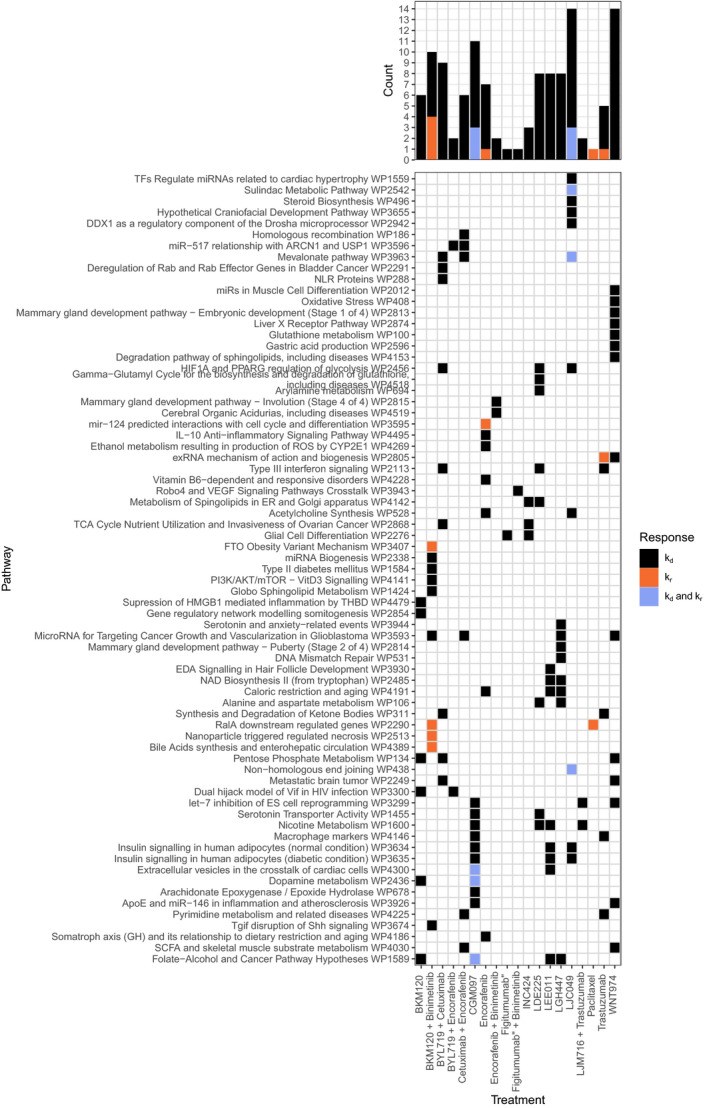
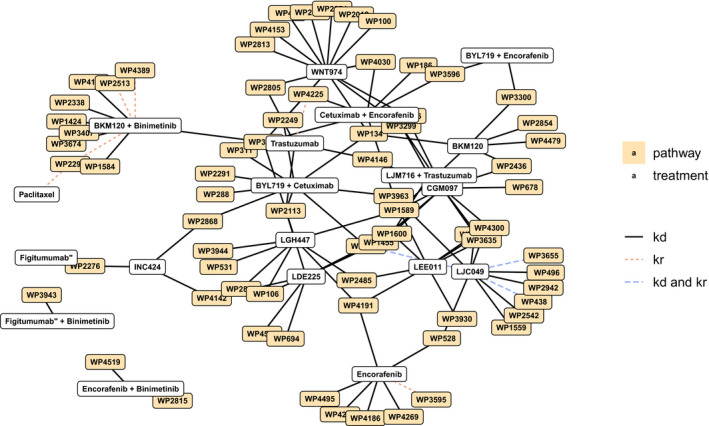
Pharmacometric modeling can capture tumor growth inhibition (TGI) dynamics and variability. These approaches do not usually consider covariates in high-dimensional settings, whereas high-dimensional molecular profiling technologies ("omics") are being increasingly considered for prediction of anticancer drug treatment response. Machine learning (ML) approaches have been applied to identify high-dimensional omics predictors for treatment outcome. Here, we aimed to combine TGI modeling and ML approaches for two distinct aims: omics-based prediction of tumor growth profiles and identification of pathways associated with treatment response and resistance. We propose a two-step approach combining ML using least absolute shrinkage and selection operator (LASSO) regression with pharmacometric modeling. We demonstrate our workflow using a previously published dataset consisting of 4706 tumor growth profiles of patient-derived xenograft (PDX) models treated with a variety of mono- and combination regimens. Pharmacometric TGI models were fit to the tumor growth profiles. The obtained empirical Bayes estimates-derived TGI parameter values were regressed using the LASSO on high-dimensional genomic copy number variation data, which contained over 20,000 variables. The predictive model was able to decrease median prediction error by 4% as compared with a model without any genomic information. A total of 74 pathways were identified as related to treatment response or resistance development by LASSO, of which part was verified by literature. In conclusion, we demonstrate how the combined use of ML and pharmacometric modeling can be used to gain pharmacological understanding in genomic factors driving variation in treatment response.
© 2021 The Authors CPT: Pharmacometrics & Systems Pharmacology published by Wiley Periodicals LLC on behalf of American Society for Clinical Pharmacology and Therapeutics.
Conflict of interest statement
The authors declare no conflict of interest.
Figures
References
-
- Rodriguez‐Brenes IA, Komarova NL, Wodarz D. Tumor growth dynamics: Insights into evolutionary processes. Trends Ecol Evol. 2013;28:597‐604. - PubMed
-
- Claret L, Girard P, Hoff PM, et al. Model‐based prediction of phase III overall survival in colorectal cancer on the basis of phase II tumor dynamics. J Clin Oncol. 2009;27:4103‐4108. - PubMed
MeSH terms
Substances
LinkOut - more resources
Full Text Sources
Other Literature Sources
Medical
