Observational Study
. 2021 May;69(5):1170-1174.
doi: 10.1111/jgs.17102. Epub 2021 Apr 1.

Quantitative description of SARS-CoV-2 RT-PCR, a cohort of 76 COVID-19 older hospitalized adults

Affiliations
Observational Study

Quantitative description of SARS-CoV-2 RT-PCR, a cohort of 76 COVID-19 older hospitalized adults

Maxence Meyer et al. J Am Geriatr Soc. 2021 May.
No abstract available


Conflict of interest statement

The authors do not have any conflicts of interest.

Figures
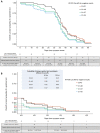
FIGURE 1
FIGURE 1
The survival analysis, analyzing expected duration of time until RT‐PCR negative conversion. (A and B) In this representation a RT‐PCR test is considered positive on a particular D‐day for a patient if the last test performed on the D‐day is positive or if the last test performed on the D‐day is negative but the patient presented a subsequent positive test after the D‐day. For example, if the patient had RT‐PCR positive on day 3, 15, 30, 37 then negative on 42 and 47 the test is considered negative from day 42. If the patients had RT‐PCR positive on day 3, 15, 30, 37, then negative on day 42, then positive on day 47, then negative on day 52 and 57. The test is considered negative from day 52. We included in this analysis the results of a total of 213 RT‐PCR tests among the 52 patients who survived. Number of tests performed, different patients tested and the RT‐PCR cycle threshold (Ct) value with its mean and standard deviation (SD) and median and interquartile range (IQR) are presented for every 10 days. The survival curves are presented with different cut‐offs defining a negative RT‐PCR test depending on whether the Ct is greater than 35, 37, 40, 42. Because the study is designed to reassess the RT‐PCR 1 month after dso, the survival analysis plot makes sense from the 40th day after dso (panel B)

References

    1. Meyer M, Calabrese L, Meyer A, et al. Clinical and virological follow‐up of a cohort of 76 covid‐19 older hospitalized adults. J Am Geriatr Soc. 2021;69:1167‐1170. 10.1111/jgs.17023. - DOI - PubMed
    1. Wood SN, Generalized Additive Models: An Introduction with R. 2nd ed. Boca Raton: Chapman and Hall/CRC; 2017. 10.1201/9781315370279 - DOI
    1. To KK‐W , Tsang OT‐Y, Leung W‐S, et al. Temporal profiles of viral load in posterior oropharyngeal saliva samples and serum antibody responses during infection by SARS‐CoV‐2: an observational cohort study. Lancet Infect Dis. 2020;20:565‐574. 10.1016/S1473-3099(20)30196-1. - DOI - PMC - PubMed
    1. Zhou F, Yu T, Du R, et al. Clinical course and risk factors for mortality of adult inpatients with COVID‐19 in Wuhan, China: a retrospective cohort study. Lancet. 2020;395(10229):1054‐1062. 10.1016/S0140-6736(20)30566-3. - DOI - PMC - PubMed
    1. Xiao AT, Tong YX, Zhang S. Profile of RT‐PCR for SARS‐CoV‐2: a preliminary study from 56 COVID‐19 patients. Clin Infect Dis. 2020;71(16):2249‐2251. 10.1093/cid/ciaa460. - DOI - PMC - PubMed