

Integrated requirement of non-specific and sequence-specific DNA binding in Myc-driven transcription
- PMID: 33792944
- PMCID: PMC8126922
- DOI: 10.15252/embj.2020105464
Integrated requirement of non-specific and sequence-specific DNA binding in Myc-driven transcription
Abstract
Eukaryotic transcription factors recognize specific DNA sequence motifs, but are also endowed with generic, non-specific DNA-binding activity. How these binding modes are integrated to determine select transcriptional outputs remains unresolved. We addressed this question by site-directed mutagenesis of the Myc transcription factor. Impairment of non-specific DNA backbone contacts caused pervasive loss of genome interactions and gene regulation, associated with increased intra-nuclear mobility of the Myc protein in murine cells. In contrast, a mutant lacking base-specific contacts retained DNA-binding and mobility profiles comparable to those of the wild-type protein, but failed to recognize its consensus binding motif (E-box) and could not activate Myc-target genes. Incidentally, this mutant gained weak affinity for an alternative motif, driving aberrant activation of different genes. Altogether, our data show that non-specific DNA binding is required to engage onto genomic regulatory regions; sequence recognition in turn contributes to transcriptional activation, acting at distinct levels: stabilization and positioning of Myc onto DNA, and-unexpectedly-promotion of its transcriptional activity. Hence, seemingly pervasive genome interaction profiles, as detected by ChIP-seq, actually encompass diverse DNA-binding modalities, driving defined, sequence-dependent transcriptional responses.
Keywords: DNA binding; E-box; Myc; promoter; transcription.
© 2021 The Authors.
Conflict of interest statement
The authors declare that they have no conflict of interest.
Figures

Structure of the DNA‐bound Myc/Max dimer (Nair & Burley, 2003), with an alignment of the Myc and Max basic regions (numbering based on the 439 a.a. human Myc protein (GenBank nr. AAA36340.1).
H359 and E363 in Myc establish H‐bonds with the complementary G6 and C1’ bases, respectively, E363 forming an additional bond with A2. R364, R366, and R367 contact the phosphodiester backbone, R367 interacting also with G4. Note that, in keeping with the symmetric configuration of the Myc/Max dimer (panel A) and with the similar structure of the Max homodimer (Ferre‐D'Amare et al, 1993), the corresponding residues in Max (R33/35/36, and H28/E32) form equivalent contacts with the other half of the E‐box palindrome.
Far‐UV CD spectra at 20°C (top) and thermal denaturation monitored at 222 nm (bottom) for Myc (red) and Max (black) bHLH‐LZ constructs (at 16 and 8 µM, respectively), alone or in combination (Myc + Max), as indicated. SUM Myc + Max: theoretical sum of the individual Myc and Max curves. The Myc variant used (WT, RA, or HEA) is indicated at the top. The increased ellipticity signals at 222 nm and increased melting temperatures of the experimental Myc + Max mixtures (blue) compared to the theoretical sums (gray) demonstrate that MycWT, MycHEA, and MycRA heterodimerize with Max to comparable extents.
EMSA of the Max bHLH‐LZ construct alone (at 2 µM) or in the presence of either Myc construct (MycWT, MycHEA, or MycRA, all at 6 µM). The polypeptides were incubated in the presence of 500 nM of the fluorescently labeled IRD‐CACGTG probe and the complexes separated on a native polyacrylamide gel, as described (Beaulieu et al, 2012).
EMSA titration experiment, with increasing concentrations of either Myc bHLH‐LZ variant (WT or HEA) in the presence of a fixed amount of the Max bHLH‐LZ (2 µM) and of the fluorescently labeled IRD‐CACGTG probe (500 nM). The plot shows the mean and standard deviation of the quantification of the shifted Myc/Max bands as a function of the Myc concentration (the experiment was performed in triplicate). % Bound probe: fraction of the IRD‐CACGTG probe associated with the Myc/Max complex. HEA/WT Kd ratio: Kd value for MycHEA/Max/CACGTG divided by the Kd value for MycWT/Max/CACGTG. The apparent Kd values were 3.78 µM for MycWT/Max and 5.57 µM for MycHEA/Max.
EMSA competition of the complex between Myc/Max and the fluorescently labeled IRD‐CACGTG probe with increasing concentrations of an unlabeled CACGTG probe (0.195, 0.390, 0.781, 1.563, 3.125, 6.25, 12.50, and 25 µM). The plot at the bottom shows the mean and standard deviation of the quantification of the shifted Myc/Max bands as a function of unlabeled probe concentration (the experiment was performed in triplicate). HEA/WT Kd ratio: as in (E). The apparent Kd values were 387 nM for MycWT/Max and 622 nM for MycHEA/Max.
Same as (F), with an unlabeled GGATCC probe as competitor. The apparent Kd values were > 25 µM for MycWT/Max and 14.5 µM for MycHEA/Max.
Same as (F), with an unlabeled CACGTC probe as competitor. The apparent Kd values were 674 nM for MycWT/Max and 280 nM for MycHEA/Max. Note that last two lanes of the upper gel were loaded in inverted order and for this reason were cropped and flipped horizontally in the final layout.
- A–C
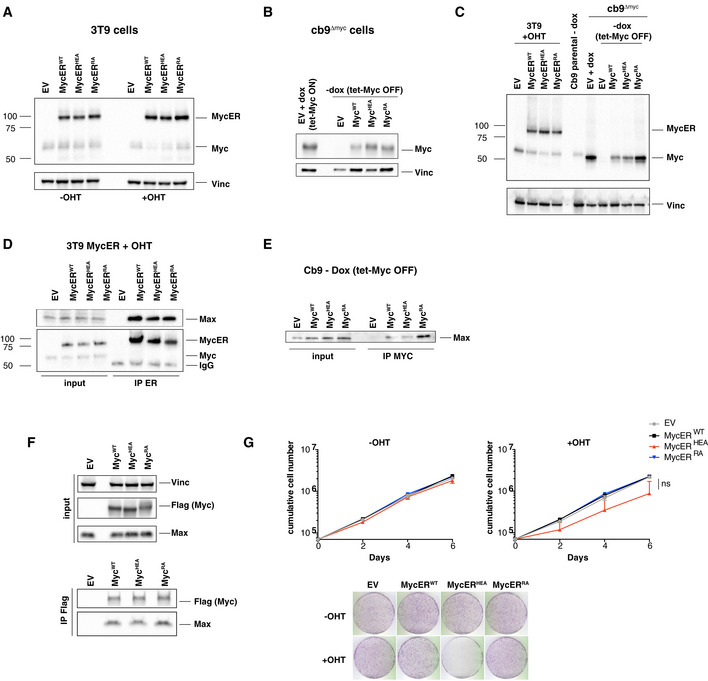
Immunoblot analysis of 3T9 or cb9Δmyc cells infected with retroviral vectors expressing the indicated MycER or Myc proteins. 3T9MycER cells were treated or not with OHT (4 h), as indicated; cb9Δmyc cells were cultured without doxycycline (−dox) for 24 h to switch off the tet‐Myc transgene, except where indicated (+dox: tet‐Myc ON). EV: empty vector. Both Myc and MycER were detected with the Y69 antibody. Note that the higher levels of MycRA seen in panel C were not observed in other experiments (panel B).
- D, E
Lysates from the above 3T9 and cb9Δmyc cells were immunoprecipitated (IP) with anti‐ER and anti‐Myc (Sigma), respectively, and the precipitates analyzed by immunoblotting with the indicated antibodies. Note the proportional amounts of MycER and Max in immunoprecipitates from 3T9 cells; the amounts of the full‐length Myc proteins immunoprecipitated from cb9Δmyc cells could not be determined, due their migration close to the Ig heavy chain. One representative experiment out of 3 is shown.
- F
Top: immunoblot analysis of 293T cells transfected with plasmids expressing the indicated Flag‐tagged Myc proteins. Bottom: 293T cell lysates were immunoprecipitated with anti‐Flag, followed by immunoblot analysis. One representative experiment out of 3 is shown.
- G
Growth curves and colony forming assays for 3T9 cells expressing the indicated MycER proteins, in the presence or absence of OHT. Data are presented as mean ± SD; n = 3 (biological replicates).
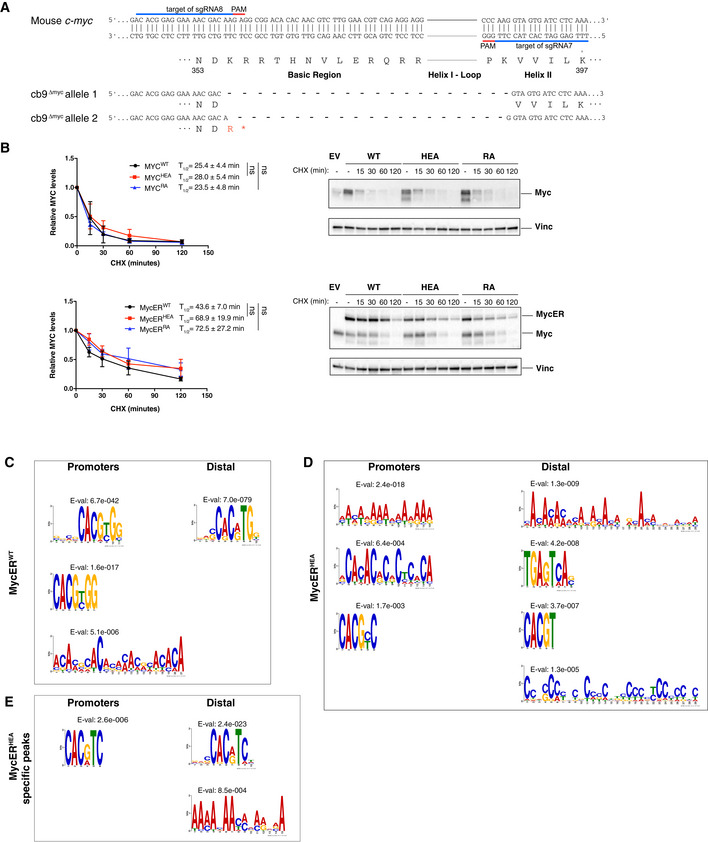
Schematic representation of the mutant c‐myc alleles in cb9Δmyc cells (numbering based on the 439 a.a. mouse Myc protein: NCBI nr. NP 001170823.1).
Assessment of protein stability in cb9Δmyc and 3T9 cells expressing the WT or mutant forms of Myc and MycER, respectively. cb9Δmyc cells (top) were plated without doxycycline for 24 h before cycloheximide (CHX) treatment, while 3T9 cells (bottom) were treated with OHT for 4 h before CHX treatment, followed by cell lysis at the indicated time‐points and immunoblot analysis. The quantification of three independent experiments is shown on the left as average (each normalized to time 0) and standard deviation. A representative blot for each model is shown on the right. No statistically significant differences were observed for any of the mutant proteins relative to their WT counterpart at any of the time‐points analyzed, the only points reaching P < 0.1 being MycERHEA at 15 min (P = 0.042) and MycERRA at 120 min (P = 0.075).
De novo motif discovery analysis performed underneath the summit of the top 200 promoter‐associated or distal MycERWT peaks, as indicated. The position weight matrixes of predicted DNA‐binding motifs are shown together with their E‐values.
As in (C) for the top 200 MycERHEA peaks.
As in (C) for MycERHEA‐specific peaks (i.e., not bound by MycERWT).
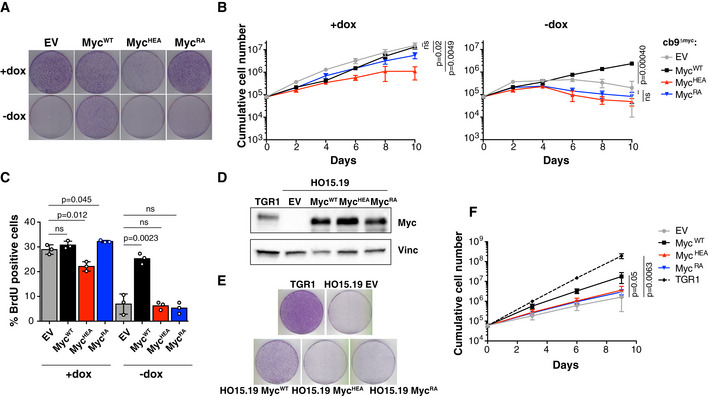
Colony formation for cb9Δmyc cells infected with retroviral vectors expressing the indicated Myc proteins; all cells were expanded with doxycycline prior to the final plating step, upon which the compound was either maintained (+dox) or removed (−dox) to switch off the tet‐Myc transgene. One representative experiment out of 3 is shown.
Cumulative cell counts for cb9Δmyc cells upon serial passaging with or without dox (removed at day 2). The data are presented as mean ± SD; n = 3 (biological replicates).
Percentage of BrdU‐positive cb9Δmyc cells, in the presence or absence (24h after removal) of doxycycline. Data are presented as mean ± SD; n = 3. Two‐tailed Student’s t‐test was used to compare between two groups and expressed as P‐values.
Immunoblot analysis of c‐myc −/− HO15.19 rat fibroblasts infected with retroviral vectors expressing the indicated Myc proteins. Parental TGR1 cells serve as control for endogenous levels of the MycWT protein.
Colony formation for the same cells as in (D). One representative experiment out of 3 is shown.
Cumulative cell counts for the same cells as in (D). Data are presented as mean ± SD; n = 3 (biological replicates). Two‐tailed Student’s t‐test was used to compare between two groups and expressed as P‐values.
- A
Heatmaps representing normalized ChIP‐seq intensities at Myc or MycER‐associated promoters or distal sites in 3T9 cells, as indicated. Each row represents a genomic site called in at least one of the experimental samples, with each column spanning a 4 kb‐wide genomic interval centered on the union of MycER peaks (called either with anti‐Myc or anti‐ER antibody). All rows were ranked on the basis of the signal intensity of the MycERWT sample.
- B
Heatmaps representing normalized ChIP‐seq intensities at MycERWT‐ and/or MycERHEA‐associated promoters or distal sites. Each row represents a 4 kb‐wide genomic interval centered on the peak summit in either the MycERWT sample (for either the common or the WT‐only sites, as indicated on the left) or the MycERHEA sample (for HEA‐only sites). All rows were ranked on the basis of the signal intensity of the MycERWT sample (considering all signals, regardless of peak calling). The plots on the right show average ChIP‐seq intensity profiles for the 6 groups of peaks defined in the heatmap.
- C
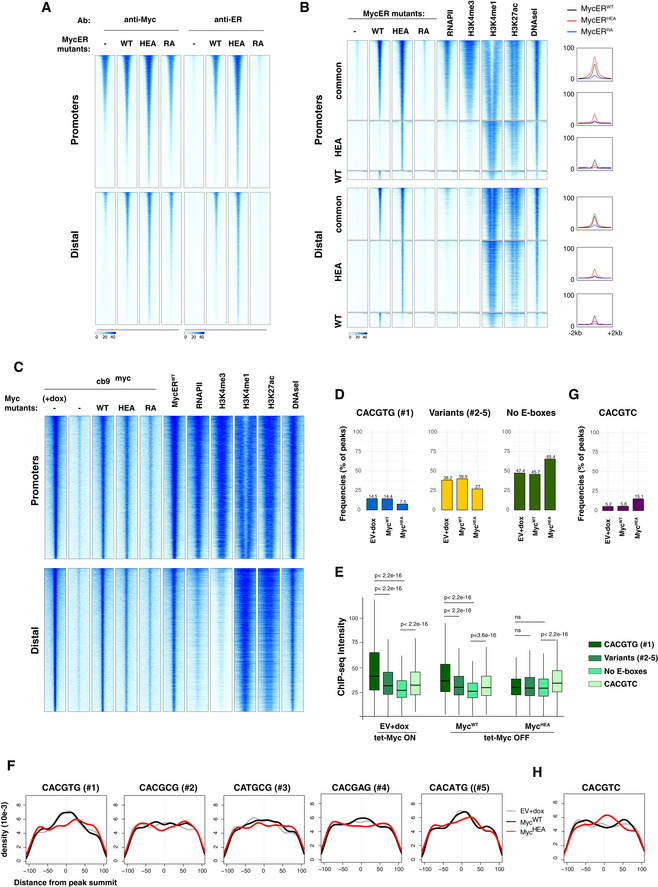
Heatmaps representing normalized Myc ChIP‐seq intensities in cb9Δmyc cells expressing the various forms of Myc (WT, HEA, RA), as indicated. As a reference, we include the MycERWT profile (obtained with anti‐Myc antibodies) after 4h of OHT treatment. The data for RNAPII, histone marks (H3K4me3, H3K4me1, H3K27ac), and DNAseI hypersensitivity are from 3T9‐MycERWT fibroblasts without OHT (Sabò et al, 2014). Each row represents a genomic site called in at least one of the experimental cb9Δmyc samples, with each column spanning a 4 kb‐wide genomic interval centered on the union of the Myc peaks. All sites are ranked according to the intensity of the ChIP signal in the first column (cb9Δmyc cells + dox).
- D
As Fig 3B, for cb9Δmyc cells: frequency of peaks (as %) that contain the indicated motif (within ± 100 bp from the peak summit) in each ChIP‐seq sample (EV, WT, HEA, and RA).
- E
As Fig 3C, for cb9Δmyc cells: ChIP‐seq intensities for peaks containing the indicated motifs. The central band in the boxplot represents the median of the data, boxes the lower and upper quartiles (25 and 75%), and whiskers the minimum and maximum values. P‐values were calculated using Wilcoxon’s test.
- F
As Fig 3D, for cb9Δmyc cells: density plots showing the distribution of the indicated motifs in a region of ± 100 bp from peak summit.
- G, H
As in (D) and (F), respectively, for the CACGTC motif in cb9Δmyc cells.
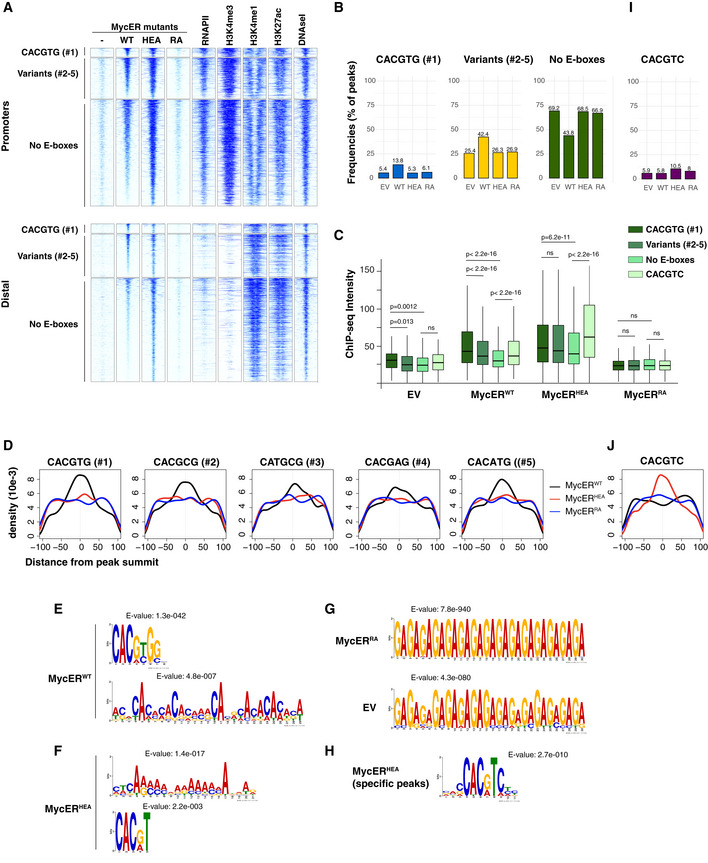
- A
Heatmaps representing normalized ChIP‐seq intensities at MycER‐associated promoters or distal sites, as indicated. Each row represents a genomic site called in at least one of the experimental samples, with each column spanning a 4 kb‐wide genomic interval centered on the union of MycER peaks. All sites are ranked according to the intensity of the MycERWT signal and divided based on the presence of the indicated DNA motifs (#1: canonical CACGTG; variants #2‐5: CACG
C G, CAT GC G, CACGA G, CACA TG; no E‐boxes: none of the above) in an interval of ± 100 bp around their peak summit. The data for RNAPII, histone marks (H3K4me3, H3K4me1, H3K27ac), and DNAseI hypersensitivity are from 3T9‐MycERWT fibroblasts without OHT (Sabò et al, 2014). - B
Frequency of peaks (as %) that contain the indicated motif within ± 100 bp from the peak summit in each ChIP‐seq sample (EV, WT, HEA, and RA).
- C
ChIP‐seq intensities for peaks (promoters + distal) containing the indicated motifs in an interval of ± 100 bp around their summit. For most accurate quantitation, intensities were computed within ± 50 bp from the summit. P‐values were calculated using Wilcoxon’s test. The central band in the boxplot represents the median of the data, boxes the lower and upper quartiles (25 and 75%), and whiskers the minimum and maximum values.
- D
Density plots showing the distribution of the indicated motifs in a ± 100 bp interval from the peak summit.
- E–G
De novo motif discovery analysis performed underneath the summit of the top 200 peaks called with (E) MycERWT, (F) MycERHEA, (G) MycERRA, and empty vector (EV) infected cells. The position weight matrixes of predicted DNA‐binding motifs are shown together with their E‐values.
- H
As in (F) for the top 200 MycERHEA‐specific peaks (i.e. not bound by MycERWT).
- I, J
As in (B) and (D), respectively, for the CACGTC motif.

Immunoblots on subcellular fractions, used for the quantifications shown in Fig 4A. Cyt, Nuc, and Chr indicate the cytoplasmic, nucleoplasmic, and chromatin‐associated fractions, respectively, all loaded with the same cell equivalents as the total. Histone H3 and Vinculin were used as markers of the Chr and Cyt fractions, respectively. Note that the spread pattern of H3 in the central blot is most likely caused by its presence close to the front of migration in SDS–PAGE. In the first gel, the loading of the last two lanes was inverted, as indicated by the names in red. Saturated: over‐exposure of the blot, shown in order to visualize weak bands.
Schematic representation of the illumination protocol for the SMT acquisitions to quantify the fraction of bound Myc molecules and exemplary acquisitions. The maximal projection of a representative MycWT movie is shown, displaying the nucleus boundaries (cyan dotted line) and a representative region (yellow square), for which exemplary frames are displayed on the right. The blue and red arrows highlight a bound and a diffusing molecule, respectively. Scale‐bar: 5 µm.
Tracking the single Myc molecules allows estimating the distribution of displacements which is fit with a three‐component diffusion model to extract the fraction of bound molecules as well as the fractions and the diffusion coefficients of the diffusing molecules (see Materials and Methods).
Schematic of the illumination protocol for the SMT movies to quantify the residence times of bound Myc molecules. Acquisition at different frame rates (ttl ranging between 200 ms and 2s) is performed to measure the residence times of bound Myc molecules at multiple time‐scales and to correct for photobleaching.
The cumulative distributions of residence times are analyzed together using a global model accounting for photobleaching.
The model allows estimating three characteristic times τ 1,τ 2,τ 3— inverse of the three characteristic reaction rates, whose weighted average provides an estimate of the mean residence time of the various Myc proteins on chromatin (See Materials and Methods and Fig 4C).

Scatter plots showing the fold change of each mRNA after 8h of OHT treatment (log2FC; y‐axis) against the intensity of Myc binding to the corresponding promoter (x‐axis) for all DEGs (defined as qval < 0.05) with a peak on the promoter in 3T9 cells expressing either MycERWT (left) or MycERHEA (right).
As in (A), with black dots indicating the presence of the indicated motif within ± 100bp from the peak summit.
Gene set enrichment plots for 5 custom Myc‐dependent signatures (Perna et al, 2012; Lorenzin et al, 2016; Muhar et al, 2018; Tesi et al, 2019). Normalized enrichment score (NES) and false discovery rate (FDR) values are reported for each dataset. Within each plot, genes were sorted from left to right according to the log2FC in their expression when comparing MycERWT or MycERHEA versus empty vector control cells, all treated with OHT.

3T9 fibroblasts expressing the indicated MycER proteins and control cells (EV) were treated with OHT (4 h) and subjected to biochemical fractionation in three independent experiments. The quantity of MycER protein in the different fractions was quantified by Western blotting (shown in Fig EV4A) and the relative proportion in the various fractions plotted as average and standard deviation.
Single‐molecule tracking at high frame rate: the time of ttl = 10 ms between two images allows to estimate the distribution of displacements, that is then fit by a three‐component diffusion model to estimate the fraction of molecules immobilized on chromatin. Inset: average bound fraction (see Fig EV4C and Materials and Methods). Note that MycRA displays a significantly lower bound fraction than MycWT and MycHEA (n cells = 34, 30, and 35, and n displacements = 78,550, 59,783, and 83,801 for MycWT, MycRA, and MycHEA, respectively). Error bar: SD. Statistical significance evaluated by permutation tests.
Single‐molecule tracking at lower frame rate (ttl spanning between 200 ms and 2 s) allows to quantify the distribution of residence times (i.e. the duration of binding events). Inset: average residence times (see Fig EV4E and F and Materials and Methods). The data reveal a significantly shorter average for MycRA, relative to either MycWT or MycHEA (n cells = 35, 35, and 31, and n bound–molecules = 2,452, 2,084, and 2,171 for MycWT, MycRA, and MycHEA, respectively). Error Bar: SD. Statistical test: ANOVA–Tukey.
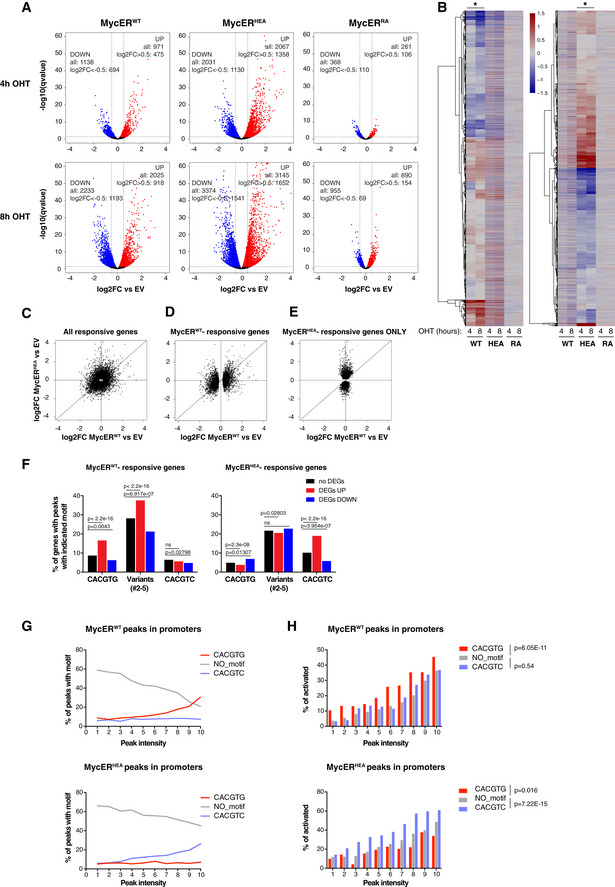
- A
Fold change of each annotated mRNA (log2FC, relative to the EV control), plotted against its q‐value (−log10). mRNAs showing significant up‐ and down‐regulation (qval < 0.05) are marked in red and blue, respectively. The values reported in the graphs indicate the total numbers of up‐ and down‐regulated genes (qval < 0.05) and of the subset regulated above a defined threshold of |log2FC| > 0.5.
- B
Heatmaps representing the same log2FC values as in (A) (restricted to those mRNAs with qval < 0.05 in at least one of the MycER samples). The two heatmaps differ in the samples driving the clustering, indicated by the asterisks at the top.
- C–E
Scatter plots confronting fold‐change values (defined as in A) in response to MycERWT (x‐axis) and MycERHEA (y‐axis), showing the following groups of mRNAs: (C) all of the mRNAs called as DEGs (qval < 0.05) in at least one of the samples; (D) MycERWT‐regulated DEGs (whether regulated or not by MycERHEA); (E) MycERHEA‐specific DEGs (excluding those regulated by MycERWT).
- F
Percentage of promoters with the indicated DNA motifs under the ChIP‐seq peak (±100 bp from the peak summit) within each regulatory class (no DEG, UP, or DOWN) for either MycERWT (left) or MycERHEA (right). P‐values calculated with Fisher’s exact test.
- G
Percentage of promoter‐associated ChIP‐seq peaks with the indicated motifs, as a function of peak intensity (binned in deciles: 1–10) for either MycERWT (top) or MycERHEA (bottom).
- H
Percentage of DEG UP genes (qval < 0.05) as a function of peak intensity (binned as in G). Statistical test: Chi‐squared against the “no motif” condition, performed on the entire series.
References
-
- Amati B, Dalton S, Brooks MW, Littlewood TD, Evan GI, Land H (1992) Transcriptional activation by the human c‐Myc oncoprotein in yeast requires interaction with Max. Nature 359: 423–426 - PubMed
Publication types
MeSH terms
Substances
LinkOut - more resources
Full Text Sources
Other Literature Sources
Molecular Biology Databases
Research Materials
