. 2021 Apr 1;16(4):e0234591.
doi: 10.1371/journal.pone.0234591. eCollection 2021.

Hemodynamic and electromechanical effects of paraquat in rat heart

Affiliations

Hemodynamic and electromechanical effects of paraquat in rat heart

Chih-Chuan Lin et al. PLoS One. .

Abstract

Paraquat (PQ) is a highly lethal herbicide. Ingestion of large quantities of PQ usually results in cardiovascular collapse and eventual mortality. Recent pieces of evidence indicate possible involvement of oxidative stress- and inflammation-related factors in PQ-induced cardiac toxicity. However, little information exists on the relationship between hemodynamic and cardiac electromechanical effects involved in acute PQ poisoning. The present study investigated the effects of acute PQ exposure on hemodynamics and electrocardiogram (ECG) in vivo, left ventricular (LV) pressure in isolated hearts, as well as contractile and intracellular Ca2+ properties and ionic currents in ventricular myocytes in a rat model. In anesthetized rats, intravenous PQ administration (100 or 180 mg/kg) induced dose-dependent decreases in heart rate, blood pressure, and cardiac contractility (LV +dP/dtmax). Furthermore, PQ administration prolonged the PR, QRS, QT, and rate-corrected QT (QTc) intervals. In Langendorff-perfused isolated hearts, PQ (33 or 60 μM) decreased LV pressure and contractility (LV +dP/dtmax). PQ (10-60 μM) reduced the amplitudes of Ca2+ transients and fractional cell shortening in a concentration-dependent manner in isolated ventricular myocytes. Moreover, whole-cell patch-clamp experiments demonstrated that PQ decreased the current amplitude and availability of the transient outward K+ channel (Ito) and altered its gating kinetics. These results suggest that PQ-induced cardiotoxicity results mainly from diminished Ca2+ transients and inhibited K+ channels in cardiomyocytes, which lead to LV contractile force suppression and QTc interval prolongation. These findings should provide novel cues to understand PQ-induced cardiac suppression and electrical disturbances and may aid in the development of new treatment modalities.


Conflict of interest statement

The authors have declared that no competing interests exist.

Figures

Fig 1
Fig 1. Representative recordings of arterial pressure, LV pressure (LVP), first derivative of LV pressure (LV dP/dt), and ECG from an anesthetized rat at baseline and at various times after PQ treatment (180 mg/kg, i.v.).
QTc value in each panel denotes rate-corrected QT interval derived using normalized Bazett’s formula QTc = QT/(RR/f)1/2, where f = 180 ms.
Fig 2
Fig 2
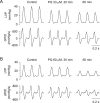
Representative tracings of LVP (upper) and dP/dt (lower) signals recorded from Langendorff-perfused rat hearts paced at 300 beats/min at baseline and following treatment with 33 μM (A) or 60 μM PQ (B).
Fig 3
Fig 3. Effects of PQ on Ca2+ transients (represented by fura-2 fluorescence ratio F340/F380) and cell shortening in rat ventricular myocytes paced at 1 Hz.
(A) Continuous recordings of Ca2+ transients (upper panel) and cell shortening (lower panel) showing the effects of the cumulative application of 10, 30, and 60 μM PQ. (B) Recordings on an expanded time scale taken at the time indicated by the corresponding letters over the F340/F380 trace in A. (C, D) The mean data of the amplitude of cell shortening (C) and Ca2+ transient (D) before and after application of PQ. Data are expressed as mean ± SD (n = 11). Cell shortening was normalized to resting cell length.
Fig 4
Fig 4. Effect of PQ on K+ currents.
(A) Families of current traces elicited by a series of 400-ms long depolarizing or hyperpolarizing pulses from a holding potential of −80 mV in the absence and presence of 3 and 10 μM PQ. (B, C) Averaged I–V relationship for Ito and IK1 peak currents (B) and Iss (C) observed in the absence, and presence of 1, 3, and 10 μM PQ. Peak Ito current was measured as the difference between the peak current and the steady-state current at the end of the pulse. Iss current was measured as the steady-state current at the end of the pulse. Each data point indicates mean ± SD from 5 myocytes. (D) Percent inhibition of the Ito integral by 1, 3, and 10 μM PQ calculated at different depolarizing potentials. Data points are mean ± SD (n = 5). (E) Original superimposed families of current traces generated by 400-ms depolarizing pulses to +40 mV from a holding potential of −80 mV in the absence or presence of increasing PQ concentrations. The arrow indicates the zero current density level. (F) Concentration–response curve for the effect of PQ on the integral of Ito at +40 mV. Data points are mean ± SD (n = 5). The continuous line was drawn according to the fitting of the Hill equation.
Fig 5
Fig 5. Voltage dependence of steady-state Ito activation and inactivation in the absence and presence of 3 μM PQ.
Steady-state inactivation was examined with a double-pulse protocol: A conditioning 400 ms pulse to various potentials ranging from −80 to +10 mV was followed by a test depolarizing pulse to +60 mV (B, inset). The holding potential was −80 mV. The predrug superimposed current traces are shown in A. The inactivation curves for Ito were obtained by normalizing the current amplitudes (I) to the maximal value (Imax) and plotted as a function of the conditioning potentials before and after PQ (n = 5). The activation curves were obtained from the normalized conductance of Ito channels (Gto/Gto, max), which were calculated from the Ito amplitude in Fig 4B and plotted as a function of the depolarizing potentials (n = 5). The solid lines drawn through the data points were best fitted to the Boltzmann equation. (C, D) Effects of PQ on reactivation of Ito. The twin-pulse protocol consisted of two identical 200 ms depolarizing pulses to +60 mV from a holding potential of −80 mV (D, inset), and the prepulse–test pulse interval varied between 10 and 550 ms. An example of the recovery of Ito from inactivation in control conditions is shown in C. The normalized currents (fractional recovery) obtained in the absence and presence of 3 μM PQ were plotted as a function of the recovery time. The solid lines represent a single exponential fit to the data in the absence and presence of 3 μM PQ (n = 5), respectively.

Similar articles

Cited by

References

    1. Dinis-Oliveira RJ, Duarte JA, Sanchez-Navarro A, Remiao F, Bastos ML, et al.. (2008) Paraquat poisonings: mechanisms of lung toxicity, clinical features, and treatment. Crit Rev Toxicol 38: 13–71. 10.1080/10408440701669959 - DOI - PubMed
    1. Naito H, Yamashita M (1987) Epidemiology of paraquat in Japan and a new safe formulation of paraquat. Hum Toxicol 6: 87–88. 10.1177/096032718700600114 - DOI - PubMed
    1. Onyon LJ, Volans GN (1987) The epidemiology and prevention of paraquat poisoning. Hum Toxicol 6: 19–29. 10.1177/096032718700600104 - DOI - PubMed
    1. Yang CC, Wu JF, Ong HC, Hung SC, Kuo YP, et al.. (1996) Taiwan National Poison Center: epidemiologic data 1985–1993. J Toxicol Clin Toxicol 34: 651–663. 10.3109/15563659609013825 - DOI - PubMed
    1. Seok SJ, Gil HW, Jeong DS, Yang JO, Lee EY, et al.. (2009) Paraquat intoxication in subjects who attempt suicide: why they chose paraquat. Korean J Intern Med 24: 247–251. 10.3904/kjim.2009.24.3.247 - DOI - PMC - PubMed

Publication types