. 2021 Apr 1;17(4):e1008830.
doi: 10.1371/journal.pcbi.1008830. eCollection 2021 Apr.

Using Hawkes Processes to model imported and local malaria cases in near-elimination settings

Affiliations

Using Hawkes Processes to model imported and local malaria cases in near-elimination settings

H Juliette T Unwin et al. PLoS Comput Biol. .

Abstract

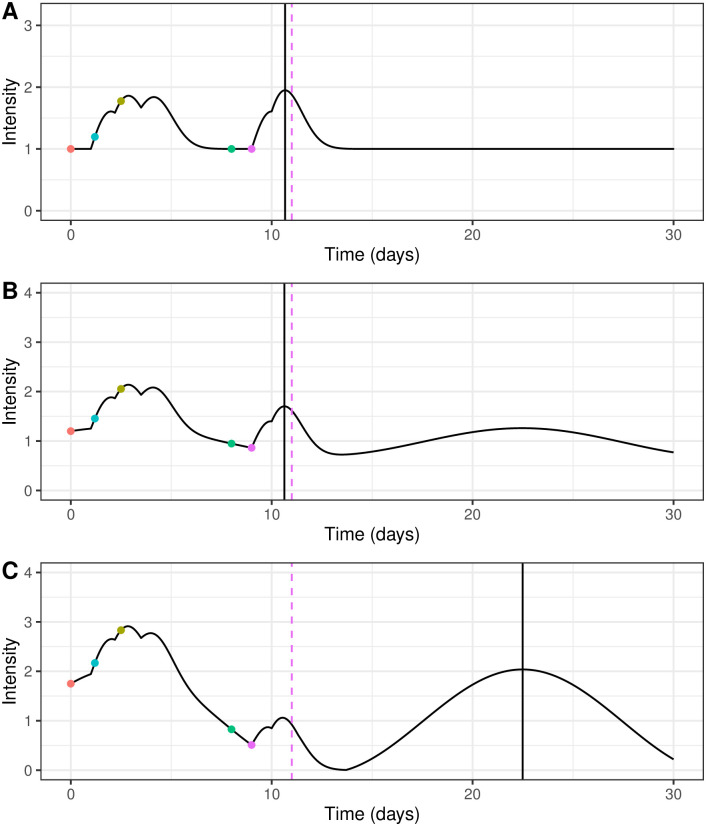
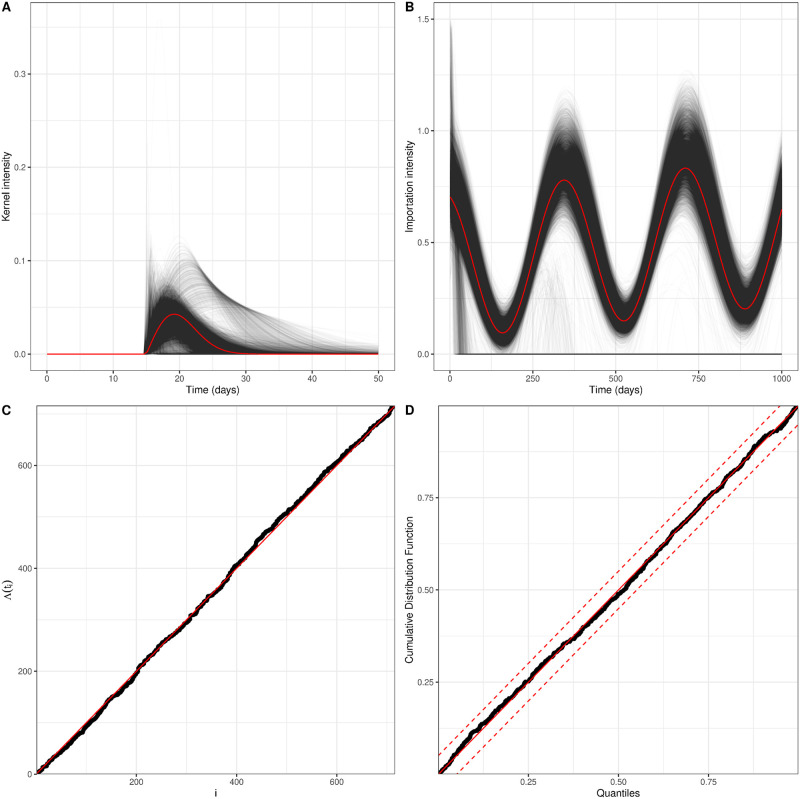
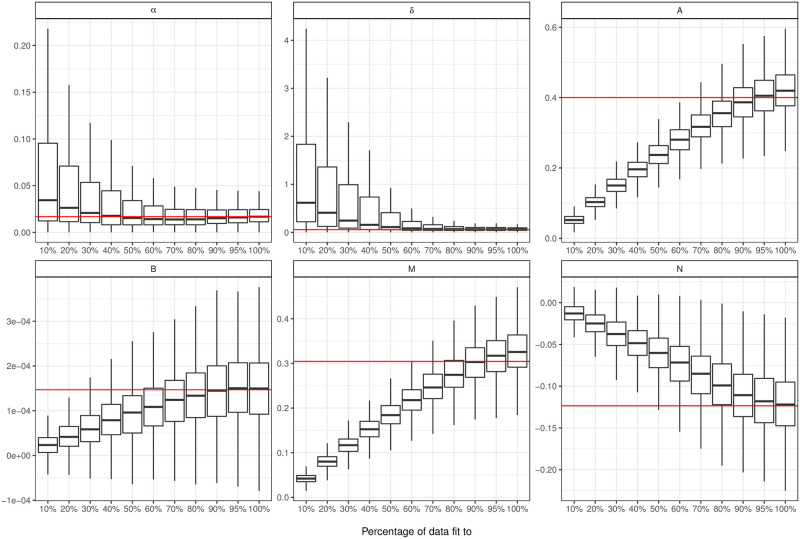
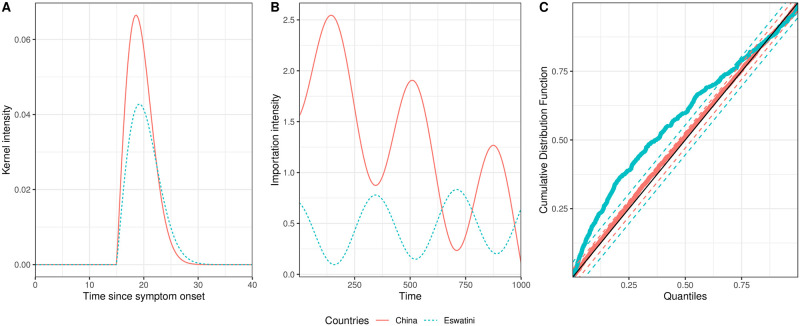
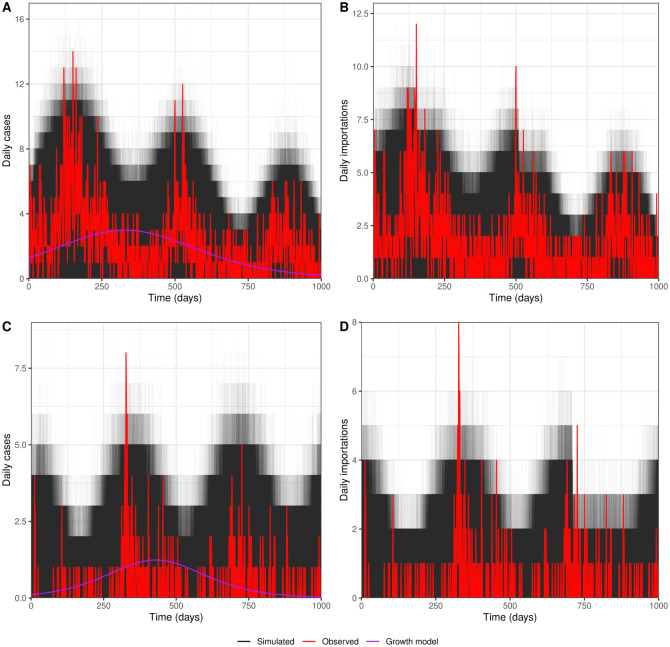
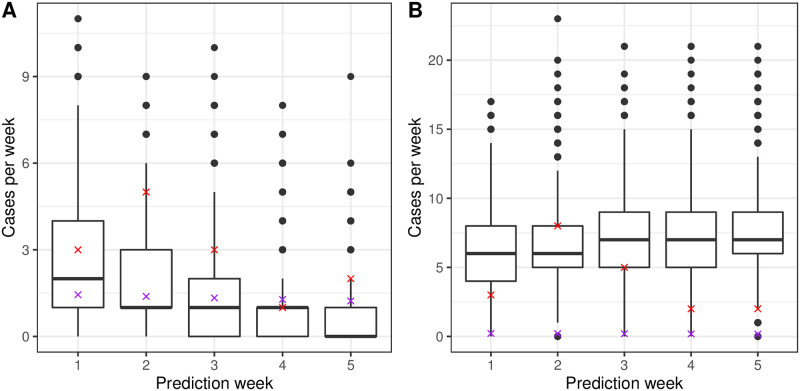
Developing new methods for modelling infectious diseases outbreaks is important for monitoring transmission and developing policy. In this paper we propose using semi-mechanistic Hawkes Processes for modelling malaria transmission in near-elimination settings. Hawkes Processes are well founded mathematical methods that enable us to combine the benefits of both statistical and mechanistic models to recreate and forecast disease transmission beyond just malaria outbreak scenarios. These methods have been successfully used in numerous applications such as social media and earthquake modelling, but are not yet widespread in epidemiology. By using domain-specific knowledge, we can both recreate transmission curves for malaria in China and Eswatini and disentangle the proportion of cases which are imported from those that are community based.


Conflict of interest statement

The authors have declared that no competing interests exist.

Figures

Fig 1
Fig 1. Illustrative plot of intensity function for events occurring at times 0, 1.2, 2.5, 8 and 9 with kernel parameters α = 1.0 and δ = 1.0, a 1 day delay and a time varying μ.
The coloured dots refer to different events or infections and the dashed pink line indicate the time of the theoretical maximum value of a single Rayleigh kernel at the last event time. The solid black line indicates the time of the maximum value of the kernel after the last event. Fig 1A shows a constant μ and Fig 1B and 1C show sinusoidal μ with a linear decrease of different magnitudes. The parameters for Eq (6) in each case are as follows: A—A = 1; B—A = 1, B = −0.001, M = 0.2, N = 0.2 and p = 20; C—A = 1, B = −0.001, M = 0.75, N = 0.75 and p = 20. These parameters are only illustrative and do not reflect parameters we would expect real in malaria models.
Fig 2
Fig 2. Model fits for simulated data using parameters: α = 0.017, δ = 0.057, A = 0.400, B = 0.0001, M = 0.305, N = −0.123 and our fixed delay Δ = 15.
Fig 2A shows the kernel from the true parameter in red with the kernels generated from the refits to each simulation in black. Fig 2B shows the how the exogenous term or importation intensity varies through time. The red line shows the importation intensity calculated from the initial parameters and the black lines shows the importation intensity calculated from the parameters fit from each simulation. This figure is magnified to show the region around the true value, but the un-magnified version is given in S1 Fig. Fig 2C shows the integral of the intensity evaluated at each event time plotted against the event index, for one simulation. The red solid line is y = x. Fig 2D shows the KS goodness of fit test from one simulation. The red solid line is y = x and the red dashed lines represent the 95% confidence intervals.
Fig 3
Fig 3. Box and whisker plots showing the distribution of our fits to different proportions of the data.
Each of the parameters in our model is shown as a different plot. The red line is the true parameter used to generate our simulations and the box shows the interquartile range with the whiskers showing 1.5 times the interquartile range above and below the 25th and 75th percentile.
Fig 4
Fig 4. Fitted endogenous and exogenous terms for the China and Eswatini data.
Fig 4A shows the fitted kernel intensity for a single infection, which corresponds Eq (5). Fig 4B shows how the exogenous terms vary through time. Fig 4C shows results from the Kolmogorov–Smirnov goodness of fit tests. The solid red lines and dots correspond to the China data and the dashed blue lines and dots correspond to the Eswatini data. The black solid line in Fig 4C is the line y = x and the red and blue dashed lines are the 95% confidence intervals for the China and Eswatini data set respectively.
Fig 5
Fig 5. Simulated daily cases for the China and Eswatini data.
Fig 5A and 5C show the daily malaria case counts for China and Eswatini respectively. The red line shows the real case counts over time and the black lines show the case counts over time from 10,000 simulations of the full fitted model. Fig 5B and 5D the daily importations for China and Eswatini respectively. Again the red line shows the real case counts over time and the black lines show simulation results.
Fig 6
Fig 6. Predicted total weekly cases of malaria.
Fig 6A shows weekly predicted cases of malaria for China and Fig 6B for Eswatini respectively. The red crosses show real number of cases each week, the purple crosses show the predictions from the growth model and the box and whisker plot show predictions from the 10,000 simulations. The box shows the interquartile range and the whiskers show 1.5 times the interquartile range above and below the 25th and 75th percentile.

References

    1. Kermack WO, McKendrick AG, Walker GT. A contribution to the mathematical theory of epidemics. Proceedings of the Royal Society of London Series A, Containing Papers of a Mathematical and Physical Character. 1927;115(772):700–721.
    1. Bershteyn A, Gerardin J, Bridenbecker D, Lorton CW, Bloedow J, Baker RS, et al.. Implementation and applications of EMOD, an individual-based multi-disease modeling platform. Pathogens and Disease. 2018;76(5). 10.1093/femspd/fty059 - DOI - PMC - PubMed
    1. Winskill P, Slater HC, Griffin JT, Ghani AC, Walker PGT. The US President’s Malaria Initiative, Plasmodium falciparum transmission and mortality: A modelling study. PLOS Medicine. 2017;14(11):1–14. 10.1371/journal.pmed.1002448 - DOI - PMC - PubMed
    1. Routledge I, Chevéz JER, Cucunubá ZM, Rodriguez MG, Guinovart C, Gustafson KB, et al.. Estimating spatiotemporally varying malaria reproduction numbers in a near elimination setting. Nature Communications. 2018;9. 10.1038/s41467-018-04577-y - DOI - PMC - PubMed
    1. Routledge I, Lai S, Battle KE, Ghani AC, Gomez-Rodriguez M, Gustafson KB, et al.. Tracking progress towards malaria elimination in China: Individual-level estimates of transmission and its spatiotemporal variation using a diffusion network approach. PLOS Computational Biology. 2020;16(3):1–20. 10.1371/journal.pcbi.1007707 - DOI - PMC - PubMed

Publication types