. 2021 Apr 1;17(4):e1009395.
doi: 10.1371/journal.pgen.1009395. eCollection 2021 Apr.

Identification of common predisposing loci to hematopoietic cancers in four dog breeds

Affiliations

Identification of common predisposing loci to hematopoietic cancers in four dog breeds

Benoît Hédan et al. PLoS Genet. .

Abstract

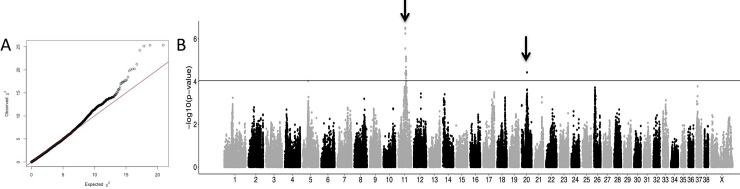
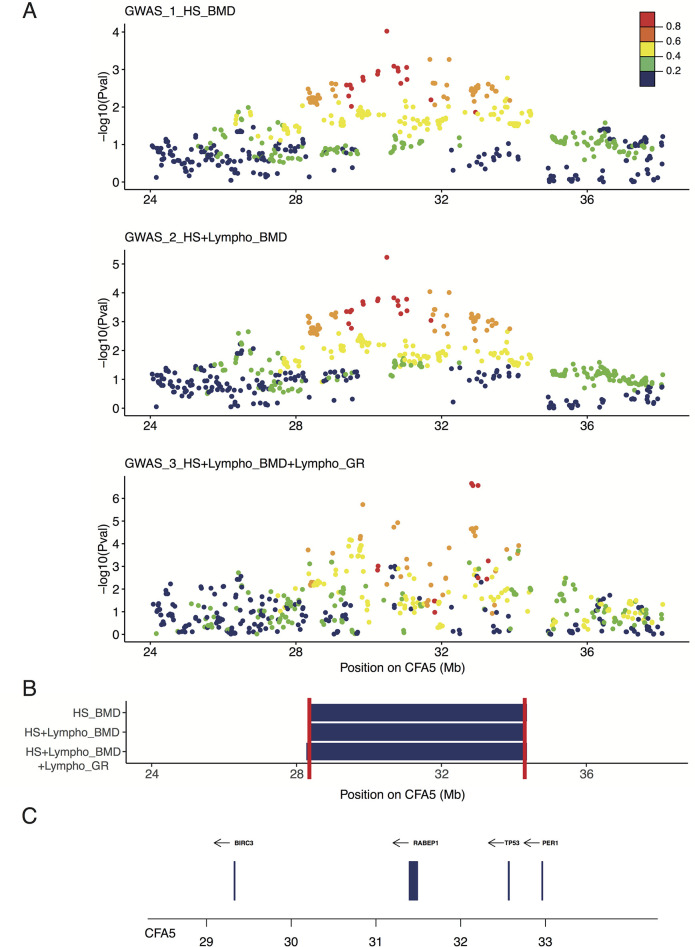
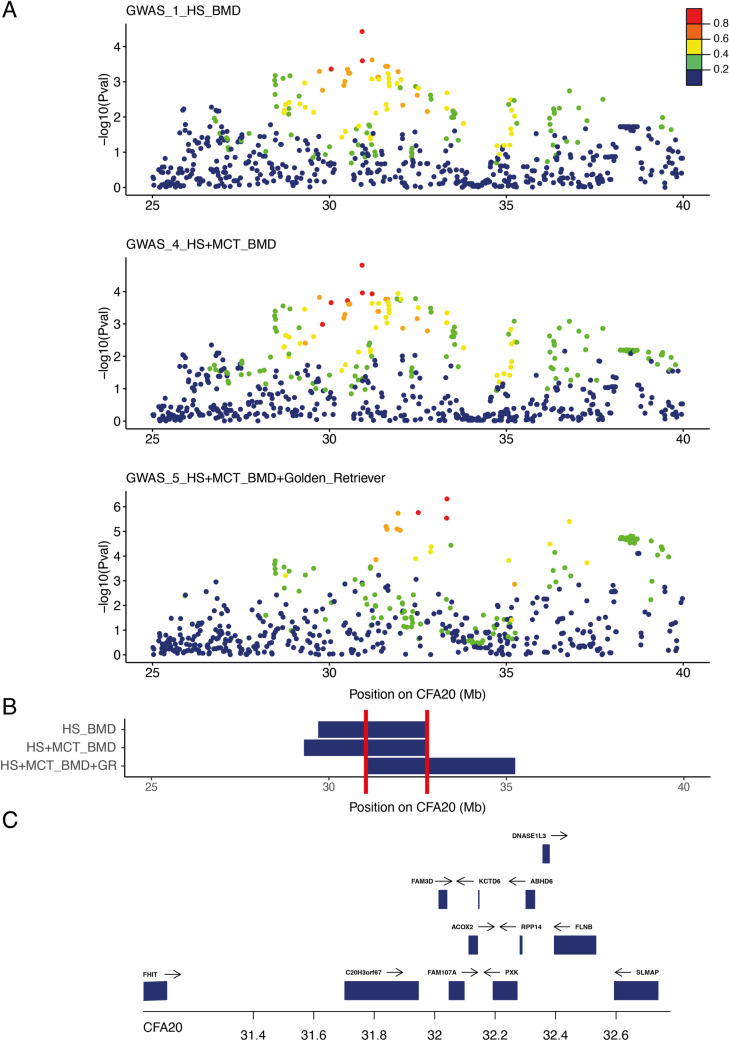
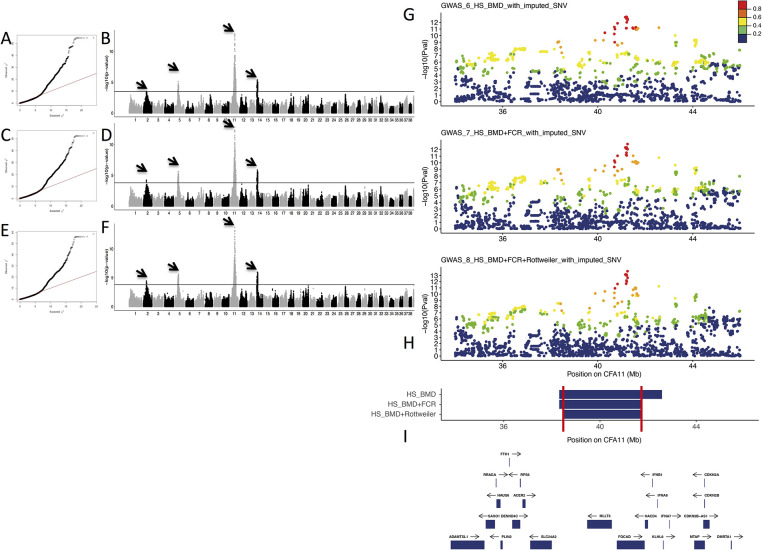
Histiocytic sarcoma (HS) is a rare but aggressive cancer in both humans and dogs. The spontaneous canine model, which has clinical, epidemiological, and histological similarities with human HS and specific breed predispositions, provides a unique opportunity to unravel the genetic basis of this cancer. In this study, we aimed to identify germline risk factors associated with the development of HS in canine-predisposed breeds. We used a methodology that combined several genome-wide association studies in a multi-breed and multi-cancer approach as well as targeted next-generation sequencing, and imputation We combined several dog breeds (Bernese mountain dogs, Rottweilers, flat-coated retrievers, and golden retrievers), and three hematopoietic cancers (HS, lymphoma, and mast cell tumor). Results showed that we not only refined the previously identified HS risk CDKN2A locus, but also identified new loci on canine chromosomes 2, 5, 14, and 20. Capture and targeted sequencing of specific loci suggested the existence of regulatory variants in non-coding regions and methylation mechanisms linked to risk haplotypes, which lead to strong cancer predisposition in specific dog breeds. We also showed that these canine cancer predisposing loci appeared to be due to the additive effect of several risk haplotypes involved in other hematopoietic cancers such as lymphoma or mast cell tumors as well. This illustrates the pleiotropic nature of these canine cancer loci as observed in human oncology, thereby reinforcing the interest of predisposed dog breeds to study cancer initiation and progression.


Conflict of interest statement

The authors have declared that no competing interests exist.

Figures

Fig 1
Fig 1. Results of genome-wide association studies (GWAS) on Bernese mountain dogs (BMD) with 172 histiocytic sarcoma (HS) cases and 128 controls (GWAS_1_HS_BMD).
A) Quantile-quantile plot displaying a genomic inflation λ of 1.000005, indicating no residual inflation. B) Manhattan plot displaying the statistical results from the GWAS. This analysis pointed out two loci (arrows) on chromosome 11 (CFA11:41161441, pcorrected = 3.11 × 10⁻⁷) and on chromosome 20 (CFA20:30922308, pcorrected = 3.73 × 10⁻⁵).
Fig 2
Fig 2. Close up view of the CFA5 locus.
A) Manhattan plot of the CFA5 20–40 Mb region highlighting the best p-values obtained in the three genome-wide association studies (GWAS): Bernese mountain dog (BMD) GWAS for histiocytic sarcoma (HS) with 172 cases vs. 128 controls (GWAS_1_HS_BMD); BMD GWAS for HS and lymphoma with 252 cases vs. 128 controls (GWAS_2_HS+lymphoma_BMD); meta-analysis combining the BMD GWAS of HS and lymphoma (252 cases vs. 128 controls) and golden retriever GWAS for lymphoma (41 cases vs. 172 controls) from Tonomura et al. [16] (GWAS_3_HS+lymphoma_BMD+golden_retriever). The R2 in cases from the top single nucleotide variation (SNV) is depicted to show the linkage-disequilibrium (LD) structure. B) Regions delimitated by the SNPs in LD with the best GWAS SNVs (R2 > 0.6) in cases; minimal region between the three GWAS (CFA5:28309815–34321500) is delimitated by red lines. C) Close up view of the genes (with available symbols) located in this minimal region (28–34 Mb) of CFA5.
Fig 3
Fig 3. Close up view of the CFA20 locus.
A) Manhattan plot of the CFA20 20–45 Mb region highlighting the best p-values obtained in the three genome-wide association study (GWAS): Bernese Mountain dogs (BMD) GWAS for histiocytic sarcoma (HS) with 172 cases vs. 128 controls (GWAS_1_HS_BMD); BMD GWAS for HS and mast cell tumor with 216 cases vs. 128 controls (GWAS_4_HS+MCT_BMD); meta-analysis combining BMD GWAS for HS and mast cell tumor with European golden retriever (69 cases vs. 74 controls) from Arendt et al. [15] (GWAS_5_HS+MCT_BMD+golden_retriever). The R2 in cases from top single nucleotide variation (SNVs) show the linkage disequilibrium (LD) structure. B) Regions delimitated by SNVs in LD with the best GWAS SNVs (R2 > 0.6) in cases; minimal region between the three GWAS (CFA20:31036863–32778949) is delimitated by red lines. C) Close up view of the genes (with available symbols) located in this minimal region (31–33 Mb) of CFA20.
Fig 4
Fig 4. Genome-wide association studies (GWAS) of Bernese mountain dogs (BMD) and other predisposed breeds on histiocytic sarcoma (HS) with the imputation of single nucleotide variations (SNV) on a higher density SNV array.
A–B) BMD GWAS results based on 403 cases and 347 controls (GWAS_6_HS_BMD_with_imputed_SNV). A) Quantile-quantile plot displaying a genomic inflation λ of 1.000023, indicating no residual inflation. B) Manhattan plot displaying the statistical results from the GWAS. This analysis shows four loci (arrows) on chromosome 2 (best SNV at CFA2:29716535, pcorrected = 3.25 × 10⁻⁴), chromosome 5 (best SNV at Chr5:30496048, pcorrected = 8.22 × 10⁻⁶), chromosome 11 (best SNV at Chr11:41215628, pcorrected = 1.45 × 10⁻¹³), and chromosome 14 (CFA14:6567456, pcorrected = 4.04 × 10⁻⁶). C–D. GWAS results for HS combining BMDs (403 cases vs. 347 controls) and flat-coated retrievers (FCRs; 13 cases vs. 15 controls; GWAS_7_HS_BMD+FCR_with_imputed_SNV). C) Quantile-quantile plot displaying a genomic inflation λ of 1.000018, indicating no residual inflation. D) Manhattan plot displaying the statistical results from the GWAS. This analysis shows four loci (arrows) on chromosome 2 (best SNV at CFA2:29716535, pcorrected = 6.02 × 10⁻⁵), chromosome 5 (best SNV at CFA5:33823740, pcorrected = 2.52 × 10⁻⁶), chromosome 11 (best SNV at CFA11:41252822, pcorrected = 1.49 × 10⁻¹³), and chromosome 14 (CFA14:6567456, pcorrected = 1.37 × 10⁻⁶). E–F) GWAS results for HS combining BMDs (403 cases vs. 347 controls), FCRs (13 cases vs. 15 controls), and Rottweilers (37 cases vs. 23 controls; GWAS_8_HS_BMD+FCR+Rottweiler_with_imputed_SNV). E) Quantile-quantile plot displaying a genomic inflation λ of 1.000013, indicating no residual inflation. F) Manhattan plot displaying the statistical results from the GWAS. This analysis shows four loci (arrows) on chromosome 2 (best SNV at CFA2:29716535, pcorrected = 3.58 × 10⁻⁵), chromosome 5 (best SNV at CFA5:33823740, pcorrected = 2.4 × 10⁻⁶), chromosome 11 (best SNV at CFA11:41252822, pcorrected = 2.04 × 10⁻¹⁴), and chromosome 14 (best SNV at CFA14:6566022, pcorrected = 1.09 × 10⁻⁶). G) Close up view of the CFA11 locus highlighting the best p-values obtained in the three GWAS: BMDs GWAS (GWAS_6_HS_BMD_with_imputed_SNV), BMDs plus FCRs GWAS (GWAS_7_HS_BMD+FCR_with_imputed_SNV), and BMDs plus Rottweilers and FCRs GWAS (GWAS_8_HS_BMD+FCR+Rottweiler_with_imputed_SNV). R2 in cases from top SNV is depicted to show the linkage disequilibrium (LD) structure. H) Regions delimitated by SNVs in LD with the best GWAS SNVs (R2 > 0.6) in cases, minimal region between the three GWAS (CFA11: 38435917–41701130) is delimitated by red lines. I) Close up view of the genes (with available symbols) located in this minimal region (38–42 Mb).

Similar articles

Cited by

References

    1. Pinho SS, Carvalho S, Cabral J, Reis CA, Gärtner F. Canine tumors: a spontaneous animal model of human carcinogenesis. -DEPTH Cover Cardiovasc IMAGING. 2012;159: 165–172. 10.1016/j.trsl.2011.11.005 - DOI - PubMed
    1. LeBlanc AK, Breen M, Choyke P, Dewhirst M, Fan TM, Gustafson DL, et al.. Perspectives from man’s best friend: National Academy of Medicine’s Workshop on Comparative Oncology. Sci Transl Med. 2016;8: 324ps5. 10.1126/scitranslmed.aaf0746 - DOI - PMC - PubMed
    1. Rowell JL, McCarthy DO, Alvarez CE. Dog models of naturally occurring cancer. Trends Mol Med. 2011;17: 380–388. 10.1016/j.molmed.2011.02.004 - DOI - PMC - PubMed
    1. Rao SR, Somarelli JA, Altunel E, Selmic LE, Byrum M, Sheth MU, et al.. From the Clinic to the Bench and Back Again in One Dog Year: How a Cross-Species Pipeline to Identify New Treatments for Sarcoma Illuminates the Path Forward in Precision Medicine. Front Oncol. 2020;10: 117. 10.3389/fonc.2020.00117 - DOI - PMC - PubMed
    1. DeWeerdt S. How dogs are teaching researchers new tricks for treating cancer. Nature. 2018;563: S50–S51. 10.1038/d41586-018-07365-2 - DOI - PubMed

Publication types

MeSH terms

Substances