. 2021 Apr 1;16(4):e0249212.
doi: 10.1371/journal.pone.0249212. eCollection 2021.

Characterizing and quantifying the temporal relationship between structural and functional change in glaucoma

Affiliations

Characterizing and quantifying the temporal relationship between structural and functional change in glaucoma

Fang-I Chu et al. PLoS One. .

Abstract

Purpose: To characterize and quantify the temporal relationship between structural and functional change in glaucoma.

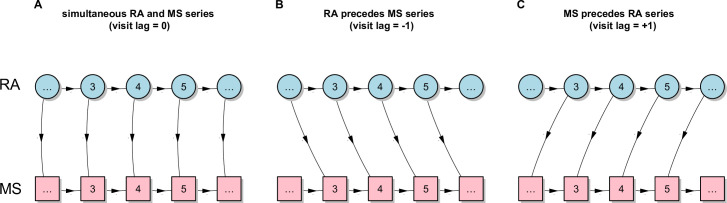
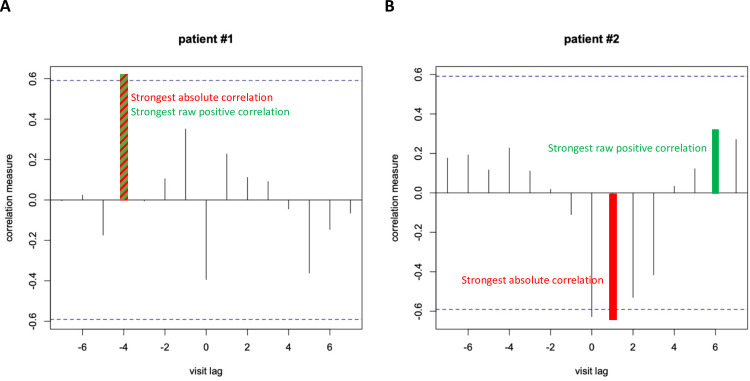
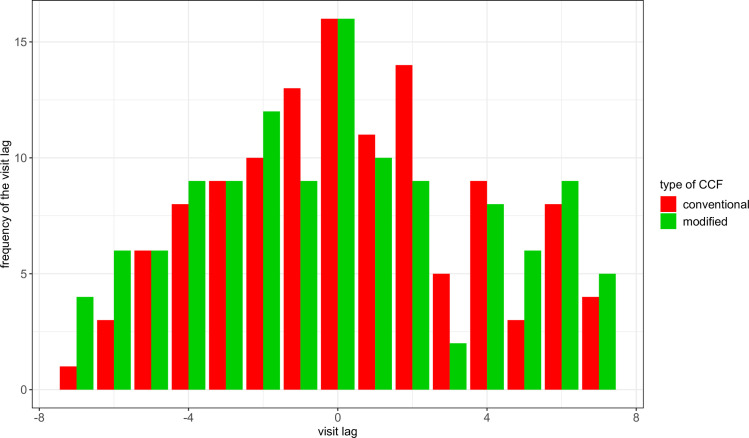
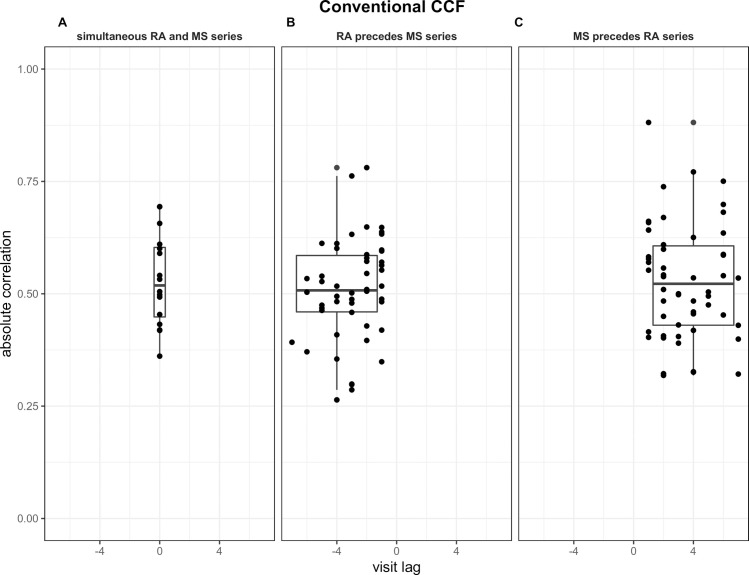
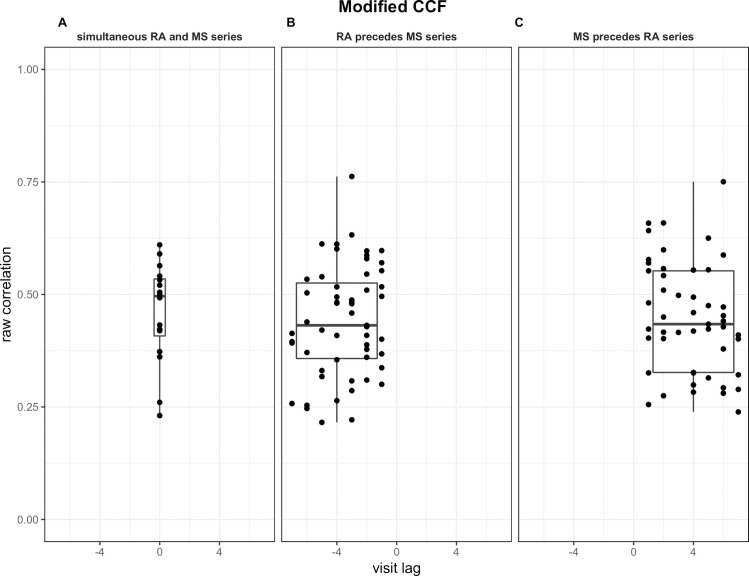
Methods: 120 eyes of 120 patients with ocular hypertension or primary open-angle glaucoma were selected from the Diagnostic Innovations in Glaucoma Study or the African Descent and Glaucoma Evaluation Study. Patients had 11 visits, separated by at least 3 months over 5 to 10 years. Each visit had rim area (RA) and mean sensitivity (MS) measurements taken within a 30-day period. The structure-function (SF) relationship was summarized using conventional and modified cross-correlation functions (CCFs), which identified the strongest absolute and positive correlation, respectively. Patients were categorized in one of the following three groups: RA and MS evolved simultaneously (lag = 0), RA preceded MS (lag<0), and MS preceded RA (lag>0). Lagging regression analysis was used to examine the variations of the SF relationship within groups.

Results: The number of participants, mean visit lag, and mean correlation (standard deviation) were, for the conventional and modified CCFs, respectively: lag = 0 [16, 0, 0.53 (0.10) and 16, 0, 0.46 (0.11)]; lag<0 [50, -2.94, 0.51 (0.11) and 55, -3.45, 0.44 (0.12)], and lag>0 [54, 3.35, 0.53 (0.13) and 49, 3.78, 0.45 (0.12)]. A significant difference of the visit lag relation within groups was identified using lagging regression analysis (p<0.0001).

Conclusions: The strongest relationship between structure and function was obtained at different visit lags in different patients. This finding also suggests that the SF relationship should be addressed at the subject level when using both measurements jointly to model glaucoma progression.


Conflict of interest statement

We have read the journal’s policy and the authors of this manuscript have the following competing interests: LR is a scientific advisor for Olleyes, Inc. This does not alter our adherence to PLOS ONE policies on sharing data and materials. Fang-I Chu has no competing interests to declare.

Figures

Fig 1
Fig 1. A graphical illustration of the three possible scenarios derived by CCF.
Panel A shows the two series of data that evolve simultaneously, panel B shows a series of RA data that precedes the MS series by 1 visit, and panel C shows a series of MS data that precedes the RA series by 1 visit.
Fig 2
Fig 2. Examples of CCF plots of RA on MS for two patients included in this study.
The conventional CCF identified the strongest absolute correlation (tallest overall spike illustrated in red and green stripes the same as the strongest positive correlation) at lag = −4 (panel A) and +1 (panel B). The modified CCF identified the strongest positive correlation (tallest spike above the zero line) at lag = −4 (panel A, in red and green stripes because the same as the strongest absolute correlation) and +6 (panel B, illustrated in green). The dashed blue horizontal lines indicate statistical significance at the p = 0.05 level.
Fig 3
Fig 3. The number of patients with the strongest correlation at each visit lag for the RA on MS relation using the conventional and modified CCFs.
Negative lags indicate that RA precedes MS series and positive lags indicate that MS precedes RA series. With both CCFs, the number of visit lags ranges from −7 to 7.
Fig 4
Fig 4. Boxplots of measure of the strongest absolute correlations at different group of visit lags using the conventional CCF.
Boxplots are shown for the visit lag = 0 in which the RA and MS series evolve simultaneously (Panel A), visit lag<0 in which change in the RA series precedes change in the MS series (Panel B), and for visit lag>0 in which change in the MS series precedes change in the RA series.
Fig 5
Fig 5. Boxplots of measure of the strongest positive correlations at different group of visit lags using the modified CCF.
Boxplots are shown for the visit lag = 0 in which the RA and MS series evolve simultaneously (Panel A), visit lag<0 in which change in the RA series precedes change in the MS series (Panel B), and for visit lag>0 in which change in the MS series precedes change in the RA series.
Fig 6
Fig 6. Histograms of lags for 120 pairs of 11 series in 9 simulated datasets with different parameter settings.
An autoregressive model (AR = 1) with decreasing trend (0.5) and random error with Gaussian process of mean 0 and SD 1 was used to simulate the first series X(t); the second series, Y(t), was simulated by scaling (0.8) on X(t) series with lag -1,0 and 1 for panels in column 1, 2 and 3, respectively. While the panels in row 1 indicate the result of no added random error to Y(t) series, random error with Gaussian process of mean 0 and SD 1, mean 0 and SD 2 was further added in to the Y(t) series for the panels in row 2 and 3.

Similar articles

References

    1. Garway-Heath DF, Holder GE, Fitzke FW, Hitchings RA. Relationship between electrophysiological, psychophysical, and anatomical measurements in glaucoma. Invest Ophthalmol Vis Sci. 2002;43(7):2213–20. - PubMed
    1. Rao HL, Zangwill LM, Weinreb RN, Leite MT, Sample PA, Medeiros FA. Structure-function relationship in glaucoma using spectral-domain optical coherence tomography. Arch Ophthalmol. 2011;129(7):864–71. 10.1001/archophthalmol.2011.145 - DOI - PMC - PubMed
    1. Reus NJ, Lemij HG. Relationships between standard automated perimetry, HRT confocal scanning laser ophthalmoscopy, and GDx VCC scanning laser polarimetry. Invest Ophthalmol Vis Sci. 2005;46(11):4182–8. 10.1167/iovs.04-1029 - DOI - PubMed
    1. Schlottmann PG, De Cilla S, Greenfield DS, Caprioli J, Garway-Heath DF. Relationship between visual field sensitivity and retinal nerve fiber layer thickness as measured by scanning laser polarimetry. Invest Ophthalmol Vis Sci. 2004;45(6):1823–9. 10.1167/iovs.03-0692 - DOI - PubMed
    1. Nassiri N, Nilforushan N, Coleman AL, Law SK, Caprioli J, Nouri-Mahdavi K. Longitudinal structure-function relationships with scanning laser ophthalmoscopy and standard achromatic perimetry. Arch Ophthalmol. 2012;130(7):826–32. 10.1001/archophthalmol.2012.1057 - DOI - PubMed

Publication types

LinkOut - more resources