. 2021 Apr 23;11(3):jkaa065.
doi: 10.1093/g3journal/jkaa065.

MutSα mismatch repair protein stability is governed by subunit interaction, acetylation, and ubiquitination

Affiliations

MutSα mismatch repair protein stability is governed by subunit interaction, acetylation, and ubiquitination

Tim Arlow et al. G3 (Bethesda). .

Abstract

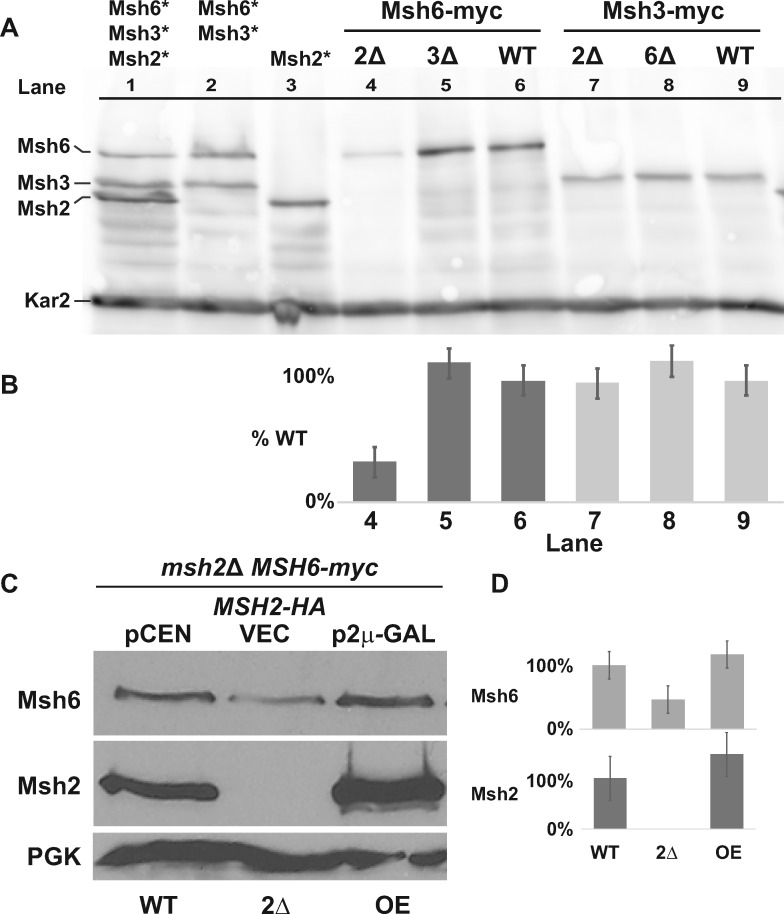
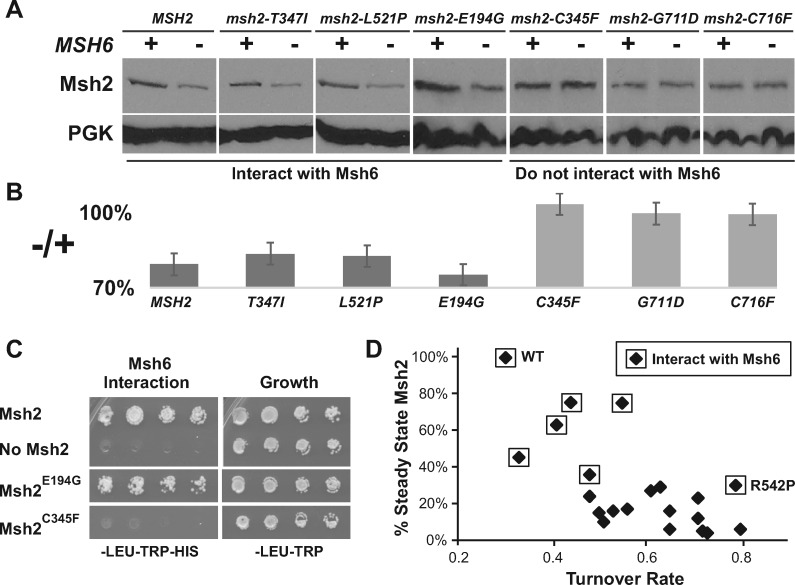
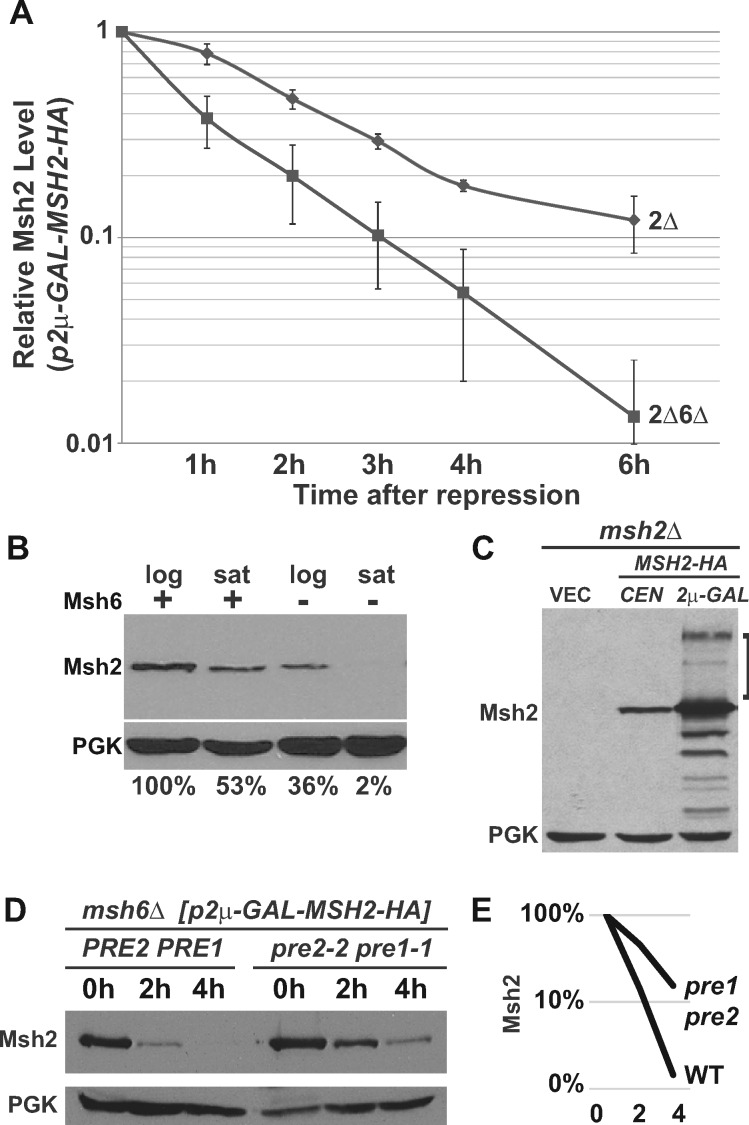
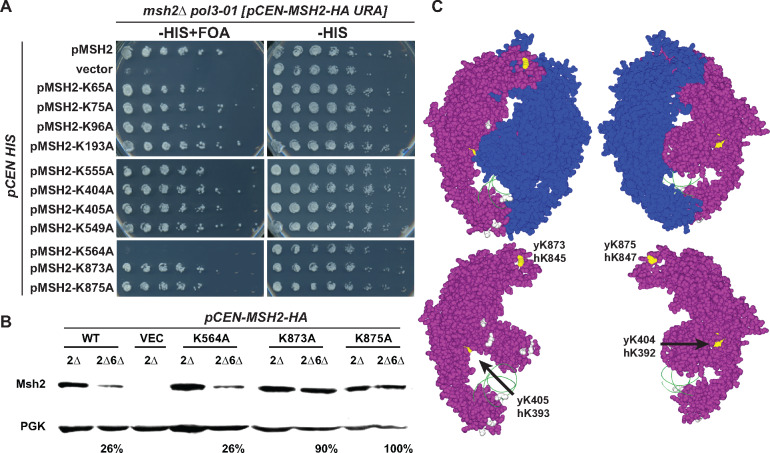
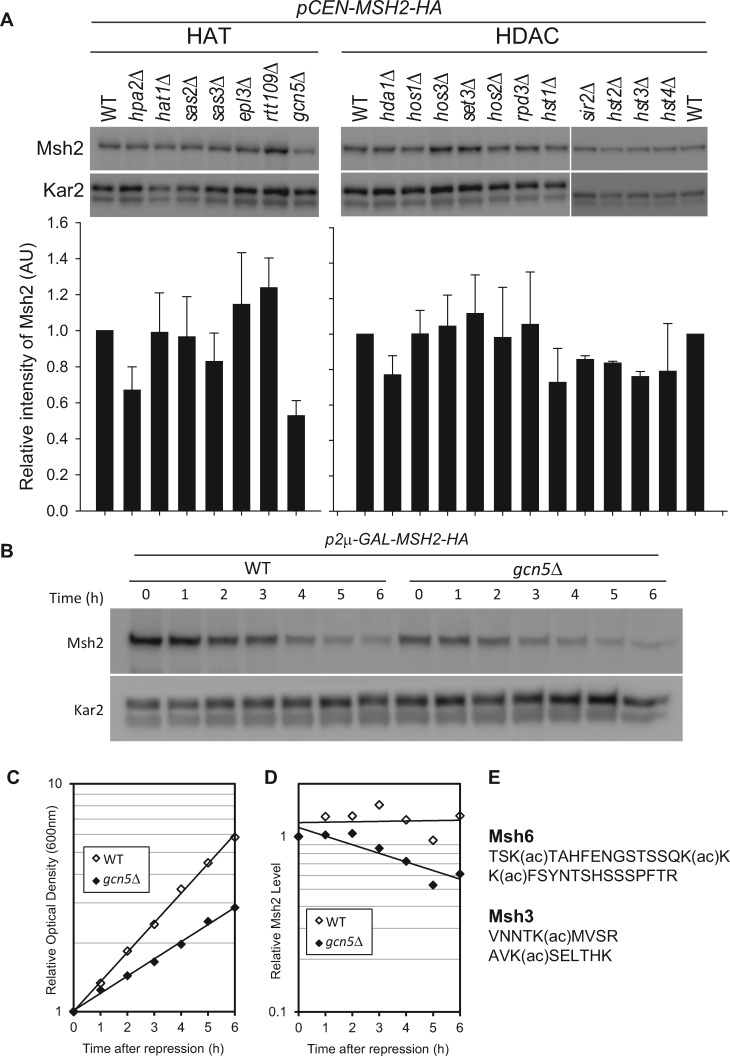
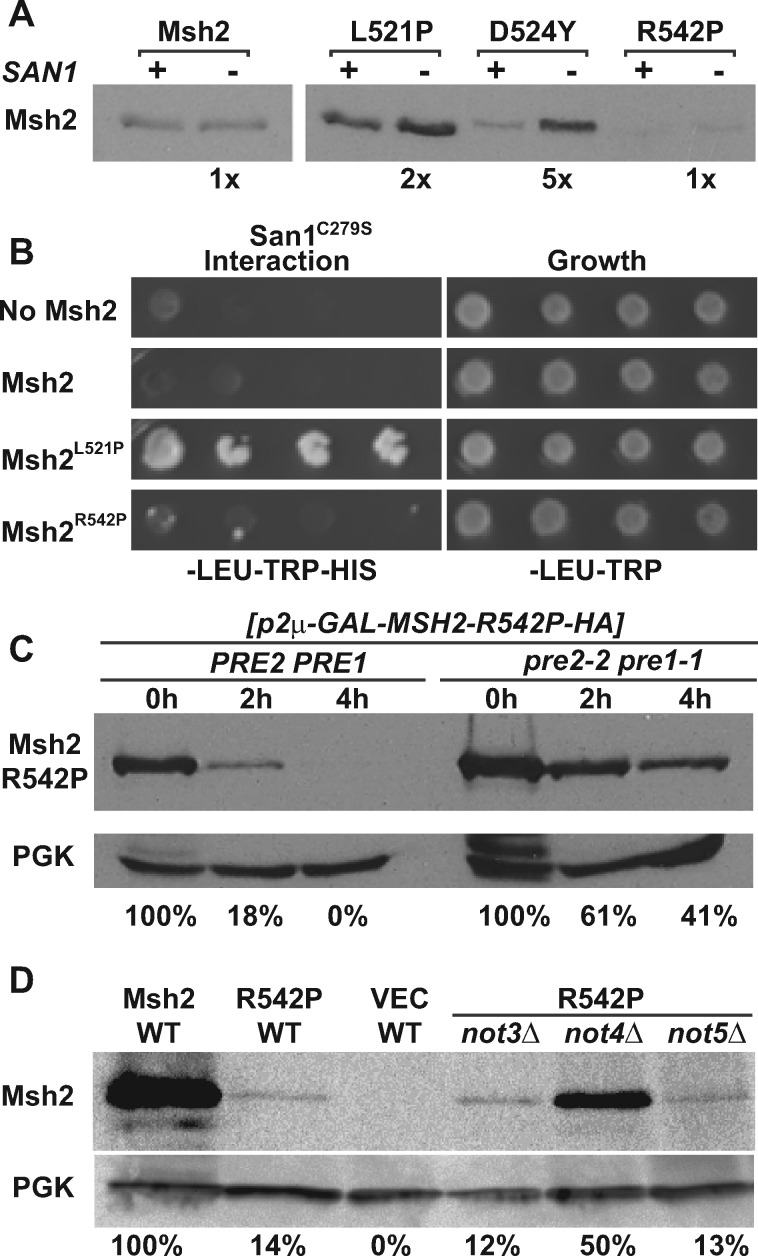
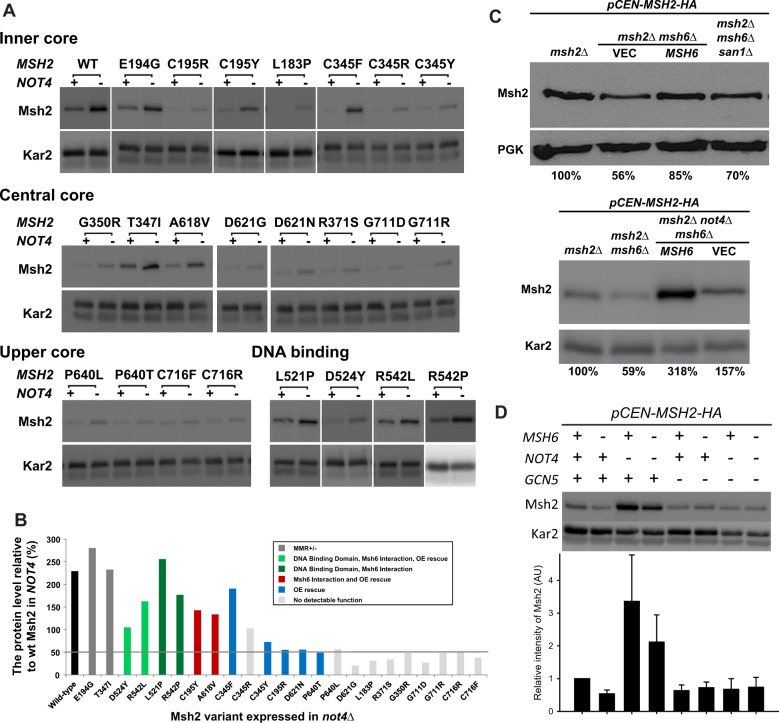
In eukaryotes, DNA mismatch recognition is accomplished by the highly conserved MutSα (Msh2/Msh6) and MutSβ (Msh2/Msh3) complexes. Previously, in the yeast Saccharomyces cerevisiae, we determined that deleting MSH6 caused wild-type Msh2 levels to drop by ∼50%. In this work, we determined that Msh6 steady-state levels are coupled to increasing or decreasing levels of Msh2. Although Msh6 and Msh2 are reciprocally regulated, Msh3 and Msh2 are not. Msh2 missense variants that are able to interact with Msh6 were destabilized when Msh6 was deleted; in contrast, variants that fail to dimerize were not further destabilized in cells lacking Msh6. In the absence of Msh6, Msh2 is turned over at a faster rate and degradation is mediated by the ubiquitin-proteasome pathway. Mutagenesis of certain conserved lysines near the dimer interface restored the levels of Msh2 in the absence of Msh6, further supporting a dimer stabilization mechanism. We identified two alternative forms of regulation both with the potential to act via lysine residues, including acetylation by Gcn5 and ubiquitination by the Not4 ligase. In the absence of Gcn5, Msh2 levels were significantly decreased; in contrast, deleting Not4 stabilized Msh2 and Msh2 missense variants with partial function. The stabilizing effect on Msh2 by either the presence of Msh6 or the absence of Not4 are dependent on Gcn5. Taken together, the results suggest that the wild-type MutSα mismatch repair protein stability is governed by subunit interaction, acetylation, and ubiquitination.

Keywords: MutS; acetylation; dimer stabilization; mismatch repair; ubiquitination.


Figures

Figure 1
Figure 1
Levels of Msh6, but not Msh3, are influenced by Msh2. (A) Chromosomally tagged Msh6 and Msh3 proteins display differential regulation in the absence of Msh2. Cultures grown to mid-exponential phase were processed and immunoblotted with α-myc antibodies for Msh2-myc, Msh3-myc, and Msh6-myc, and α-Kar2 for the loading control. Lanes 1-3 show the relative migration position and levels of Msh6, Msh3, or Msh2 expressed from stains where the proteins are identically tagged with the myc epitope, singly or in combinations (lanes 1-3, tagged protein indicated above the lanes with asterisks). Msh6-myc (lanes 4-6) and Msh3-myc (lanes 7-8) proteins were expressed in the absence of Msh2 (2Δ), Msh3 (3Δ) or Msh6 (6Δ), or in wild-type (WT) strain backgrounds. (B) Band intensities from Panel A of Msh6-myc and Msh3-myc were normalized to the loading controls using ImageJ and graphed as the percentage of each protein expressed in the WT strain (%WT). Lane numbers from Panel A are shown for reference. Error bars represent the stand error. (C) Msh6 levels are controlled by the abundance of Msh2. A strain with a chromosomally myc tagged MSH6 (MSH6-myc) and with a deletion in MSH2 (msh2Δ MSH6-myc) harbored plasmids expressing wild-type MSH2-HA from the endogenous promoter on a low copy, centromere-based plasmid (pCEN or WT), or overexpressed from an inducible GAL10 promoter on a high-copy, 2 μ plasmid (p2μ-GAL or OE). As a comparison, no Msh2 was expressed in the msh2Δ MSH6-myc strain with a plasmid vector (VEC, or 2Δ). The cells were grown to exponential phase in 2% galactose. Msh6-myc, Msh2-HA, and the PGK loading control were detected by α-myc, α-HA, and α-PGK, respectively. (D) Band intensities from Panel C of Msh6-myc and Msh2-HA were normalized to the loading controls using ImageJ and graphed as the percentage of each protein expressed in the WT strain described in Panel C. Error bars represent the stand error.
Figure 2
Figure 2
Unstable missense variants of Msh2 that fail to interact with Msh6 are not further destabilized in its absence. (A) Representative examples of the steady-state levels of Msh2 missense variants in the presence and absence of Msh6. Indicated HA-tagged missense variants (msh2-T743I, msh2-L521P, msh2-E194G, msh2-C345F, msh2-G711D, and msh2-C716F shown) were expressed in msh2Δ (+) or msh2Δmsh6Δ (–) and examined by immunoblotting. The variants that interact or do not interact with Msh6 are indicated. (B) Band intensities of Msh2 and the Msh2 variant proteins were normalized to the loading controls from Panel A using the densitometry function of the open source program ImageJ (Schneider et al. 2012) and graphed as the percentage of the Msh2 or variant Msh2 proteins expressed in the absence of Msh6 to the level expressed in the presence of Msh6 (–/+). Error bars represent the standard error. (C) Representative examples of Msh6 interactions with wild-type Msh2 and the unstable Msh2 variants. Yeast 2-hybrid strain PJ69-4A was transformed with pGBD-MSH2, pGBD-C2 (no Msh2), and all the pGBD-MSH2 low level variant plasmids including pGBD-MSH2-E194G and pGBD-MSH2-C345F shown in the figure. Yeast 2-hybrid strain PJ69-4α was transformed with pGAD-MSH6. Diploids were formed and selected for growth on medium lacking leucine and tryptophan (–LEU–TRP) and on selective medium also lacking histidine (–LEU–TRP–HIS) for the yeast 2-hybrid interaction. (C) Low level variants that do not interact with Msh6 are less stable than those that do interact with Msh6. The plot shows the steady-state levels of wild-type Msh2 (WT) and the unstable Msh2 variants as a percentage of wild-type verses the turnover rate. The turnover rates were calculated by normalizing densitometry scanned values to the zero-time point, plotting the normalized values on a log scale, and taking the average of the negative log slope. The steady-state data for most of the Msh2 variants and turnover rates were reported previously (Arlow et al. 2013). Msh2 and Msh2 missense variants that interact with Msh6 are indicated with a box around the data point. The Msh2R542P (R542P) outlier is indicated.
Figure 3
Figure 3
Wild-type Msh2 is degraded more rapidly in the absence of Msh6 via the ubiquitin-proteasome pathway. Indicated msh2Δ (2Δ) or msh2Δmsh6Δ (2Δ6Δ) cells bearing the vector pRS413 (VEC), a centromere-based plasmid encoding MSH2-HA (pCEN-MSH2-HA), or a high-copy plasmid expressing MSH2 under GAL promoter (p2μ-GAL-MSH2-HA) were grown to exponential phase. Protein extracts of ∼3 × 10⁷ cells were subjected to chemiluminescence immunoblotting methods to detect Msh2 with α-HA and a loading control (PGK) with α-PGK. (A) Msh2 has an increased turnover rate in the absence of Msh6. Indicated cells carrying p2μ-GAL-MSH2-HA were grown to exponential phase in medium containing 2% raffinose. MSH2 expression was induced with 2% galactose and repressed with 2% glucose (zero-time point) and time points were taken as described in Materials & Methods. The graph represents the average of three experiments. The data were normalized to the zero-time point. The error bars are the standard error of the mean. (B) The stabilizing effect of Msh6 on Msh2 is more pronounced when cultures become saturated. Strains that were wild-type (+) or lacking Msh6 (–) were grown in synthetic medium to an optical density at 600 nm (OD600) of 0.6 representing logarithmic phase (log) or until the cultures saturated in stationary phase (sat) at an OD600 of 1.6. Samples were prepared for immunoblotting to detect Msh2 and the PGK loading control. Band intensities of Msh2 were normalized to the loading controls using ImageJ and shown below the immunoblot images as the percentage Msh2 expressed in the presence of Msh6 during logarithmic phase. (C) High molecular weight species of wild-type Msh2 are observed when Msh2 is overexpressed. Indicated cells were grown to exponential phase in 2% galactose to overexpress MSH2. High molecular weight Msh2-HA species are indicated with a square bracket. (D) Genetic inhibition of the proteasome stabilizes monomeric Msh2. A strain with an MSH6 deletion (msh6Δ) and temperature sensitive mutations in genes for the 20S proteasome (pre1-1 pre2-2) and a msh6Δ strain with a wild-type proteasome (PRE2 PRE1) harbored p2μ-GAL-MSH2-HA and were grown to early exponential phase at 30°C in galactose containing medium. The cells were shifted to 37°C for additional 30 min to deactivate the proteasome in the proteasome mutant strain, and then 2% Glucose was added to repress MSH2 (zero-time point, 0 h). Time points at 2 and 4 h were taken at the indicated time after repression. (E) Band intensities of Msh2 from Panel D were normalized to the loading controls using ImageJ and graphed on a log scale as the percentage Msh2 expressed at 0 h for the strains with a wild-type proteasome (WT) or a defective proteasome (pre1 pre2) over the 0, 2, and 4 h time points.
Figure 4
Figure 4
Conserved lysines on the MutSα stabilize Msh2 in the absence of Msh6. (A) Functional assays of lysine substitution mutants. An msh2Δ pol3-01 strain kept alive by a URA3-based plasmid expressing wild-type MSH2 (pCEN-MSH2-HA URA) was transformed with HIS3 encoding plasmids (pCEN HIS) expressing endogenously expressed wild-type MSH2 (pMSH2), no MSH2 (vector), and lysine substitution variants (pMSH2-KcodonA). Stains were grown overnight in medium lacking histidine allowing for the loss of the covering wild-type MSH2 URA3 plasmid. Fivefold serial dilutions were delivered to plates lacking histidine with no drug (–HIS) or supplement with 5-FOA (–HIS+ FOA). 5-FOA selects for cells that were able to lose the MSH2 URA3 plasmid during growth, indicating full suppression of the mismatch repair defect. (B) Steady-state levels of Msh2 and its lysine substitution variants in the presence (2Δ) and absence of Msh6 (2Δ6Δ). The proteins were detected as described in Figure 1A. Band intensities were normalized to the loading controls using ImageJ and shown below the immunoblot images as the percentage of the protein level expressed in the presence of Msh6. (C) Conserved lysines highlighted on the human MutSα structure. The Msh2 protein is shown in purple with the conserved lysines that when mutated had no effect on levels (gray) or stabilized the levels of Msh2 (yellow) in the absence of Msh6. The ribbon backbone of the DNA molecule (green) is shown for orientation purposes. Two views of the heterodimer with and without Msh6 (blue) are shown. Images created without Msh6 are to reveal the concealed lysines. The potential lysine targets (yellow) are labeled with the yeast and human codon numbers in the images with just Msh2. Images were made with Swiss PDB Viewer (Guex et al. 1999) and Persistence of Vision Raytracer (Version 3.6) retrieved from http://www.povray.org/download/.
Figure 5
Figure 5
Gcn5 mediates MutSα turnover through acetylation of Msh6. (A) Msh2 steady-state levels in histone acetyl transferase (HAT) mutants or histone deacetylase (HDAC) mutants. Cells were grown to exponential phase and processed for immunoblotting as described in above. The Msh2 levels from duplicate experiments were quantified, normalized by a loading control Kar2 and graphed as the relative intensity of Msh2 (AU, arbitrary units). Error bars are standard error of the mean. (B-D) Gcn5 regulates the turnover of Msh2. Turnover experiments of Msh2 were conducted in wild-type (WT) or GCN5 deletion strains (gcn5Δ). After MSH2 repression by 2% glucose, cells were harvested and assayed for Msh2 protein levels via immunoblotting (B) and growth via optical density readings (C). Msh2 levels were quantified and normalized to the Kar2 loading control (D). (E) Msh6 and Msh3 acetylated fragments. The acetylation sites were mapped previously (Downey et al. 2015).
Figure 6
Figure 6
Different E3 Ubiquitin ligases control Msh2 variant levels. (A) Deletion of the San1 ubiquitin ligase stabilizes all the low level Msh2 variants except for Msh2R542P. The isogenic WT (+) and san1Δ (–) expressing Msh2 or variants were grown to exponential phase and processed for immunoblotting as described in the Materials and Methods. Band intensities were quantified using ImageJ and shown below the immunoblot images as the fold increase detected in the absence of San1. (B) San1 interacts with the unstable Msh2L521P variant, but not with wild-type Msh2 or Msh2R542P. Yeast 2-hybrid was used as described in Figure 2 to determine the interaction between San1 and wild-type Msh2 or Msh2 low level variants, Msh2L521P or Msh2R542P. Growth on medium lacking histidine (–HIS) indicates a positive interaction with San1C279S, a variant of San1 that allows for better detection of the interaction with substrates. (C) Genetic inhibition of the proteasome stabilizes Msh2R542P. Turnover experiments were conducted using the Msh2R542P variant in wild-type (PRE2 PRE1) or in a proteasome mutant strain (pre2-2 pre1-1) as described in in the Materials and Methods. Cells were processes for immunoblotting at 0, 2 and 4 h after shutting off synthesis of Msh2R542P as indicated. The immunoblot was probed to detect the Msh2R542P variant as well as PGK, the loading control. Band intensities of Msh2 were normalized to the loading controls using ImageJ and are shown below the immunoblot image as the percentage Msh2 expressed at 0 h for the strains with a wild-type proteasome or a defective proteasome over the 0, 2, and 4 h time points. (D) Deletion of NOT4 increases steady-state levels of Msh2R542P. Deletion strains not3Δ, not4Δ, not5Δ or the wild-type strain (WT) expressing MSH2 (Msh2), msh2-R542P (R452P), or the empty vector (VEC) were grown to exponential phase and processed for immunoblotting as described above. Band intensities of Msh2 were normalized to the loading controls using ImageJ and are shown below the immunoblot image as the percentage WT Msh2.
Figure 7
Figure 7
Low-level Msh2 variants with partial function are targeted by the Not4 ubiquitin ligase. (A) Deletion of NOT4 increases steady-state levels of Msh2 and Msh2 variants. The isogenic wild type (+) and not4Δ (–) expressing MSH2 or variants from a centromere-based plasmid (pCEN-MSH2-HA) were grown to exponential phase and processed for immunoblotting as described in Figure 1A. (B) Deleting NOT4 stabilizes Msh2 and Msh2 variants with partial function. Immunoblots were quantified and the levels of Msh2 or variants in not4Δ were presented as the relative level (%) to wild-type Msh2 level in NOT4. Data bars for Msh2 missense variants are colored according to the partial functioning including, partial mismatch repair function(MMR±) when expressed from a centromere-based plasmid, the ability to interact with Msh6 based on a yeast 2-hybrid assay, and the ability to function in mismatch repair function when overexpressed (OE rescue). The horizontal gray bar highlights the variants whose levels are increased to at least 50% of wild-type Msh2 levels. (C) Lower Wild-type Msh2 levels in strains lacking Msh6 is not a function of San1 or Not4 activity. Indicated cells were grown to exponential phase and processed for immunoblotting as described in Figure 1A. MSH6 was endogenously expressed from a centromere-based plasmid. PGK and Kar2 were used as a loading control. Band intensities of Msh2 were normalized to the loading controls using ImageJ and are shown below the immunoblot image as the percentage of the wild-type control (msh2Δ expressing MSH2 on a centromere-based plasmid). (D) Not4 specific turnover of Msh2 is not observed in the absence of Gcn5. Msh2 steady-state levels in the presence (+) or absence (–) of MSH6, NOT4 or GCN5. Cells were grown to exponential phase and processed for immunoblotting as described previously. The levels from duplicate experiments were quantified, normalized to Kar2 and graphed as the relative intensity of Msh2 (AU, arbitrary units). Error bars are standard error of the mean.

References

    1. Acharya S, Wilson T, Gradia S, Kane MF, Guerrette S, et al.1996. hMSH2 forms specific mispair-binding complexes with hMSH3 and hMSH6. Proc Natl Acad Sci USA. 93:13629–13634. - PMC - PubMed
    1. Amberg DC, Burke DJ, Strathern JN.. 2005. Methods in Yeast Genetics: A Cold Spring Harbor Laboratory Course Manual. Plainview, NY: Cold Spring Harbor Laboratory Press.
    1. American Cancer Society 2020. Cancer Facts & Figures 2020. Atlanta, GA: American Cancer Society.
    1. Arlow T, Scott K, Wagenseller A, Gammie A.. 2013. Proteasome inhibition rescues clinically significant unstable variants of the mismatch repair protein Msh2. Proc Natl Acad Sci USA. 110:246–251. - PMC - PubMed
    1. Ausubel FM, Brent R, Kingston RE, Moore DD, Seidman JG, et al.1989. Short Protocols in Molecular Biology. New York: John Wiley & Sons Inc.

Publication types

Substances

LinkOut - more resources