. 2021 Apr 17;33(2):270-289.
doi: 10.1093/plcell/koaa028.

Enhanced nucleotide analysis enables the quantification of deoxynucleotides in plants and algae revealing connections between nucleoside and deoxynucleoside metabolism

Affiliations

Enhanced nucleotide analysis enables the quantification of deoxynucleotides in plants and algae revealing connections between nucleoside and deoxynucleoside metabolism

Henryk Straube et al. Plant Cell. .

Abstract

Detecting and quantifying low-abundance (deoxy)ribonucleotides and (deoxy)ribonucleosides in plants remains difficult; this is a major roadblock for the investigation of plant nucleotide (NT) metabolism. Here, we present a method that overcomes this limitation, allowing the detection of all deoxy- and ribonucleotides as well as the corresponding nucleosides from the same plant sample. The method is characterized by high sensitivity and robustness enabling the reproducible detection and absolute quantification of these metabolites even if they are of low abundance. Employing the new method, we analyzed Arabidopsis thaliana null mutants of CYTIDINE DEAMINASE, GUANOSINE DEAMINASE, and NUCLEOSIDE HYDROLASE 1, demonstrating that the deoxyribonucleotide (dNT) metabolism is intricately interwoven with the catabolism of ribonucleosides (rNs). In addition, we discovered a function of rN catabolic enzymes in the degradation of deoxyribonucleosides in vivo. We also determined the concentrations of dNTs in several mono- and dicotyledonous plants, a bryophyte, and three algae, revealing a correlation of GC to AT dNT ratios with genomic GC contents. This suggests a link between the genome and the metabolome previously discussed but not experimentally addressed. Together, these findings demonstrate the potential of this new method to provide insight into plant NT metabolism.


Figures

Figure 1
Figure 1
Schematic overview of the method for the extraction and analysis of NTs and Ns. Plant material is disrupted and quenched with TCA, which is removed together with apolar contaminants by LLE with DCM and TOA (A). The extract is loaded onto a weak-anion exchange SPE cartridge, the flow-through contains (deoxy)nucleosides for analysis. Subsequently, contaminants are depleted by washing with methanol (MeOH) and ammonium acetate (NH4Ac), resulting in elution of (deoxy)ribonucleotides with MeOH and ammonia (NH3; B). Isolated fractions are analyzed by LC–MS using a zic-cHILIC column (NTs and Ns) or a Hypercarb column (NTs; C).
Figure 2
Figure 2
Cellular concentrations and absolute amounts of rNTs and dNTs in Arabidopsis leaves and seedlings. rNTs (rNTPs; A) and dNTs (dNTPs; B) were quantified in 7-day-old seedlings (unhatched bars) and 33-day-old rosette leaves (hatched bars). Each biological replicate represents a pool of several seedlings (A) or two leaves (B) which met the criteria outlined in the “Materials and methods” section from one individual plant. For seedlings, every replicate is a pool of seedlings grown together in one flask. Replicates were grown in parallel under identical conditions. Concentration of rNTPs (C) and dNTPs (D) in NT containing compartments of 33-day-old leaves. The concentration was calculated with the assumptions and formulas given in the “Materials and methods” section. Error bars indicate standard deviations (sd) for n = 3 biological replicates (A and B) or n = 6 biological replicates (C and D). * means P < 0.05 and was determined using a two-way ANOVA with Sidak’s post test.
Figure 3
Figure 3
A/T and G/C ratios of dNTs (dNTPs) in different plant species. Ratios of dNTPs in A. officinalis, A. sativa, A. thaliana, C. reinhardtii, H. vulgare, M. scalaris, O. sativa, P. (P.) patens, P. vulgaris, S. lycopersicum, T. aestivum, V. carteri, and Z. mays. (A) Ratio of dATP to dTTP. (B) Ratio of dGTP to dCTP. Error bars indicate standard deviation (sd) for n = 3 biological replicates with each replicate representing a pool of several plants/seedlings all grown in parallel under the same environmental conditions.
Figure 4
Figure 4
Regression analysis of the GC content in dNTPs and DNA. The GC content in the dNTPs (y-axis) is plotted against the genomic GC content (x-axis) and the Pearson correlation coefficient and the corresponding P value of a linear regression are calculated. Every white circle represents the average of three measurements. The green circle comprise all dicotyledonous species (A. thaliana, P. vulgaris, S. lycopersicum) and the bryophyte (P. patens), the orange circle encompasses the monocotyledonous species (A. officinalis, A. sativa, H. vulgare, O. sativa, T. aestivum, and Z. mays) and the purple circle alga (C. reinhardtii, M. scalaris, and V. carteri). * indicates an estimate of genomic GC content by extrapolation from known codon DNA sequences (R2 without this datapoint is 0.73).
Figure 5
Figure 5
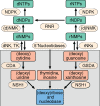
Scheme of nucleoside and NT metabolism. The (deoxy)nucleoside catabolism is highlighted with a gray background. NK, deoxynucleoside kinase; TK, thymidine kinase; rNK, ribonucleoside kinases; (d)NMK, (deoxy)nucleoside monophosphate kinases; and NDPK, nucleoside diphosphate kinases.
Figure 6
Figure 6
Absolute quantification of dNs in mutants impaired in the catabolism of rNs. Concentrations of dNs in seeds (A) and in 7-day-old seedlings (B) of A. thaliana wild type, as well as mutants in the degradation of purine and pyrimidine Ns (gsda, guanosin deaminase). Error bars are sd, n = 3 biological replicates, for seeds, three independent seed pools derived from different mother plants, for seedlings, three pools of seedlings from three independent liquid cultures were used. Statistical analysis was performed using one-way ANOVA with Tukey’s post hoc test or in case of deoxythymidine by a two-tailed Student’s t test. Different letters indicate P < 0.05. nd, not detected. FW, fresh weight.
Figure 7
Figure 7
Comparison of the AEC, the ATP/ADP ratio, and the rNT concentrations between seeds and seedlings. Concentrations of rNTs, as well as ATP/ADP ratio and AEC in seeds (A) and in 7-day-old seedlings (B) of A. thaliana wild type, as well as mutants in the salvage and degradation of purine and pyrimidine Ns (gsda, guanosin deaminase) .Error bars are sd, n = 3 biological replicates, for seeds, three independent seed pools derived from different mother plants, for seedlings, three pools of seedlings from three independent liquid cultures were used. Statistical analysis was performed using one-way ANOVA with Tukey’s post hoc test. Different letters indicate P < 0.05. FW, fresh weight.
Figure 8
Figure 8
Absolute quantification of NMPs in seeds and seedlings of wild type and mutant plants impaired in nucleoside catabolism. Concentrations of NMPs in seeds (A) and in 7-day-old seedlings (B) of A. thaliana wild type, as well as mutants in the degradation of purine and pyrimidine Ns (gsda, guanosin deaminase) . Error bars are sd, n = 3 biological replicates, for seeds, three independent seed pools derived from different mother plants, for seedlings, three pools of seedlings from three independent liquid cultures were used. Statistical analysis was performed using one-way ANOVA with Tukey’s post hoc test. Different letters indicate P < 0.05. nd, not detected. FW, fresh weight.
Figure 9
Figure 9
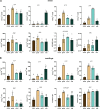
Absolute quantification of deoxynucleotide triphosphates in wild type and mutant seedlings impaired in nucleoside catabolism. Concentrations of dNTPs in 7-day-old seedlings of A. thaliana wild type, as well as mutants in the degradation of purine and pyrimidine Ns (gsda, guanosin deaminase). Error bars are sd, n = 3 biological replicates, for seedlings, three pools of seedlings from three independent liquid cultures were used. Statistical analysis was performed using one-way ANOVA with Tukey’s post hoc test. Different letters indicate P < 0.05. FW, fresh weight.

References

    1. Aoyagi S, Sugiyama M, Fukuda H (1998) BEN1 and ZEN1 cDNAs encoding S1-type DNases that are associated with programmed cell death in plants. FEBS Lett 429: 134–138 - PubMed
    1. Ashihara H, Crozier A, Ludwig IA (2020) Plant Nucleotide Metabolism: Biosynthesis, Degradation, and Alkaloid Formation. Wiley Blackwell, Chichester
    1. Ashihara H, Mitsui K, Ukaji T (1987) A simple analysis of purine and pyrimidine nucleotides in plant cells by high-performance liquid chromatography. Z Naturforsch C 42: 297–299
    1. Assmann SM (2002) Heterotrimeric and unconventional GTP binding proteins in plant cell signaling. Plant Cell 14: S355–S373 - PMC - PubMed
    1. Baccolini C, Witte C-P (2019) AMP and GMP catabolism in arabidopsis converge on Xanthosine, which is degraded by a nucleoside hydrolase heterocomplex. Plant Cell 31: 734–751 - PMC - PubMed

Publication types