. 2021 Apr 2;185(3):836-856.
doi: 10.1093/plphys/kiaa075.

Alternative splicing creates a pseudo-strictosidine β-d-glucosidase modulating alkaloid synthesis in Catharanthus roseus

Affiliations

Alternative splicing creates a pseudo-strictosidine β-d-glucosidase modulating alkaloid synthesis in Catharanthus roseus

Inês Carqueijeiro et al. Plant Physiol. .

Abstract

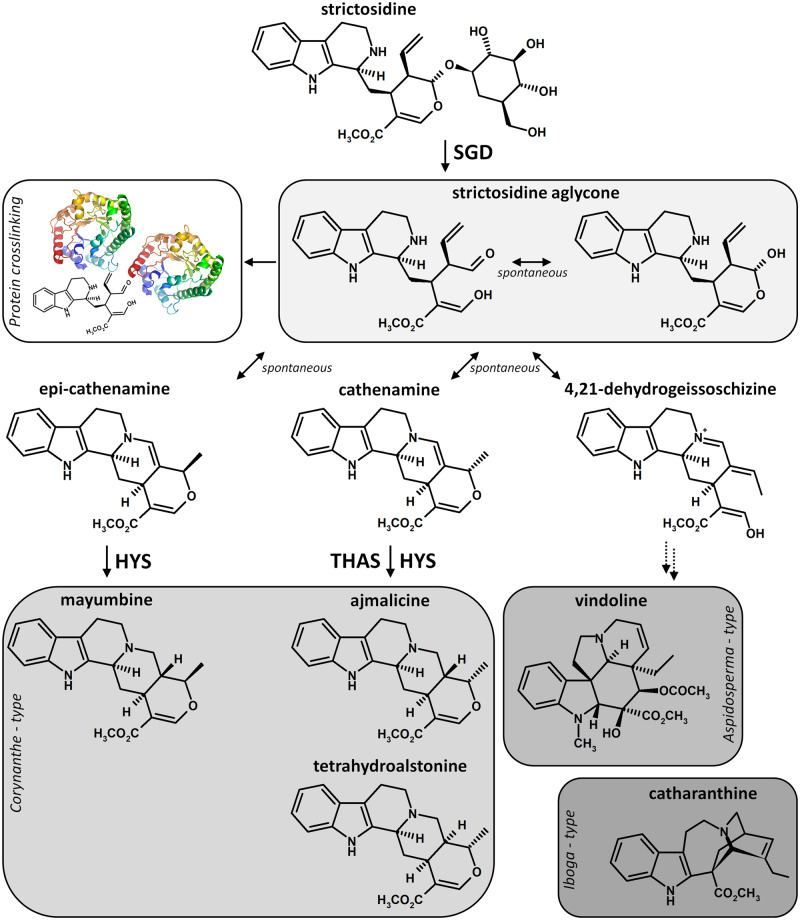
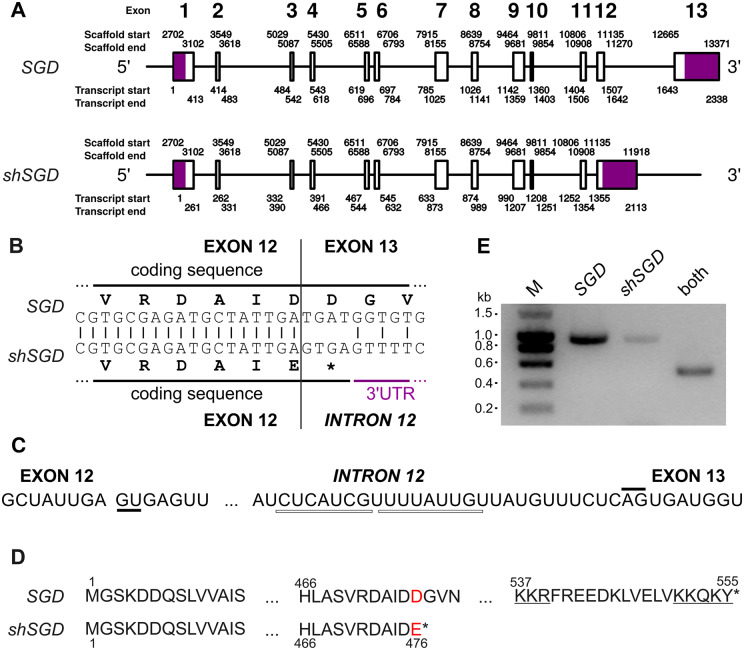
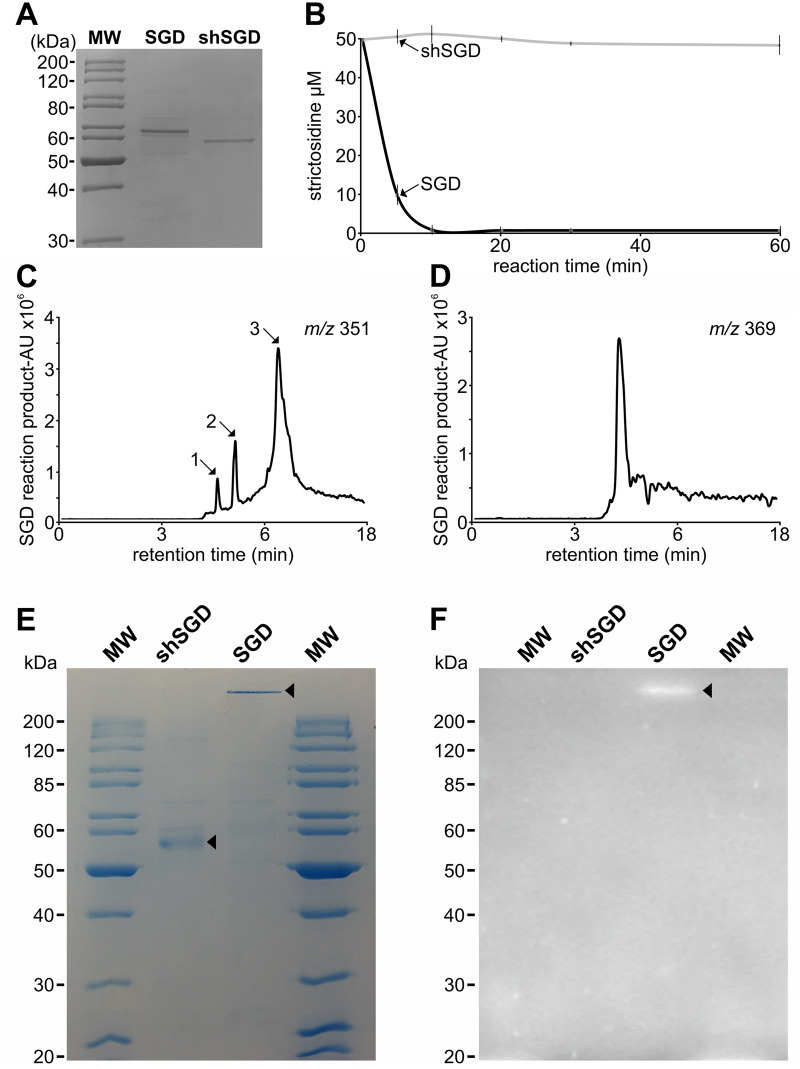
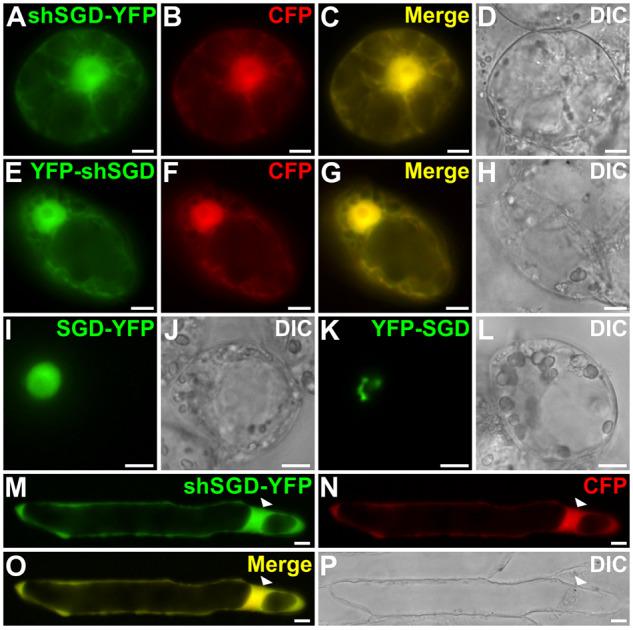
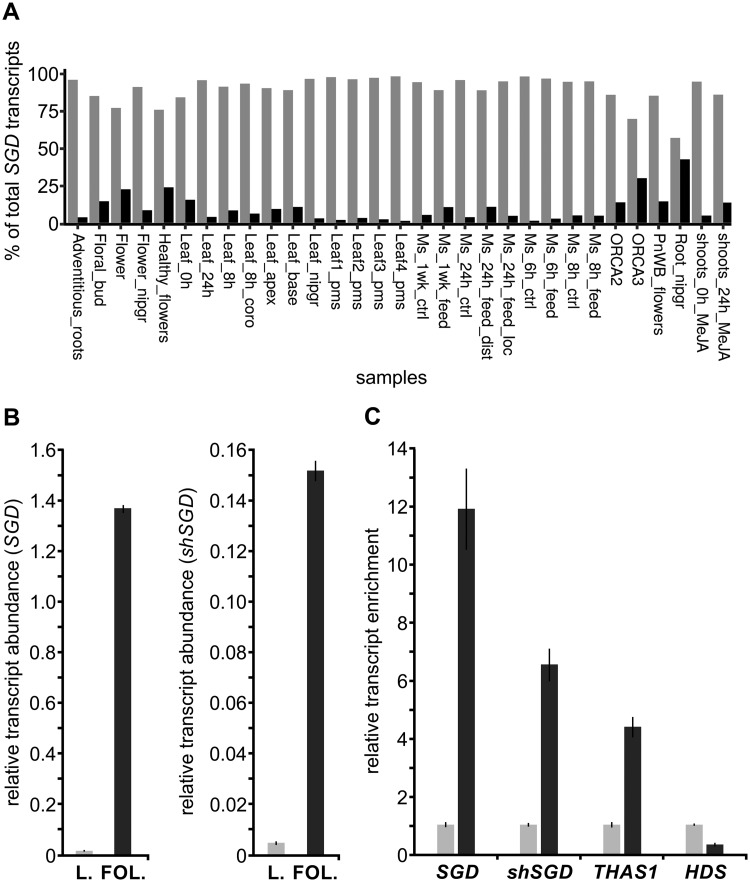
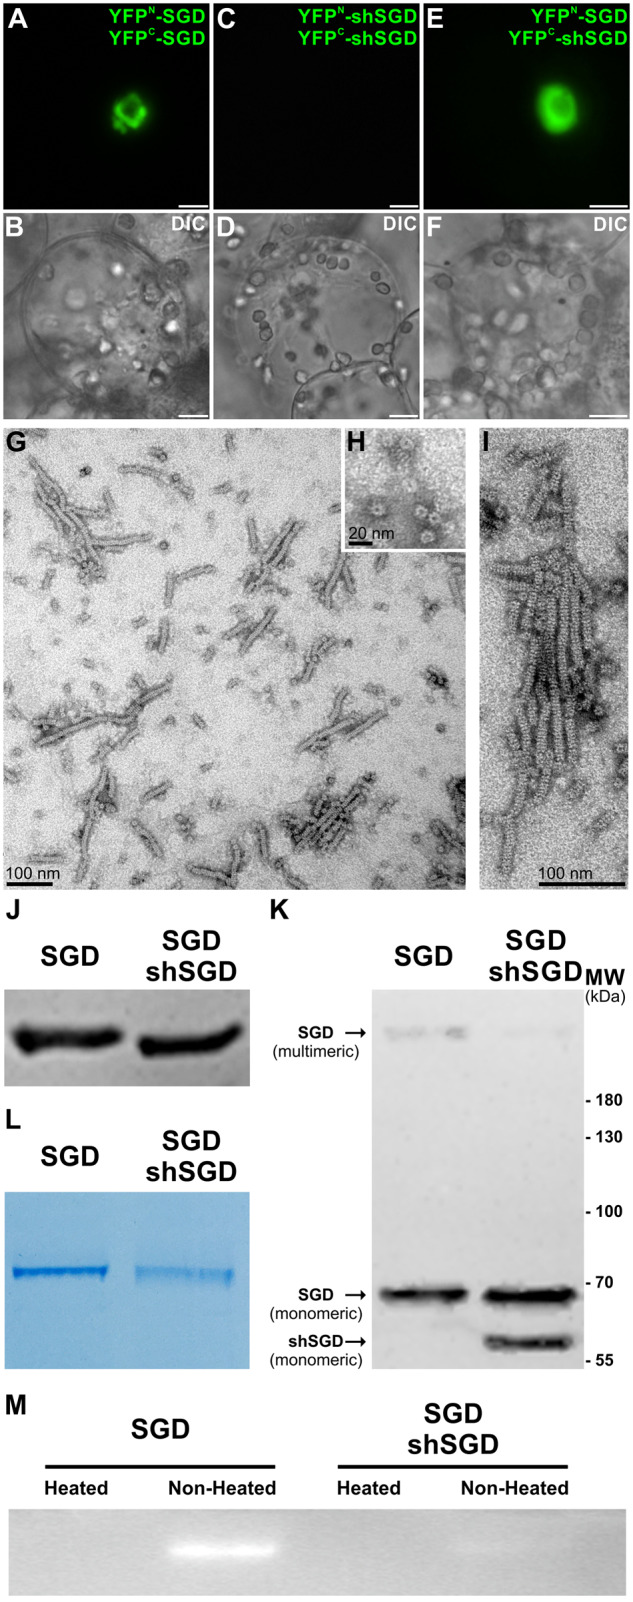
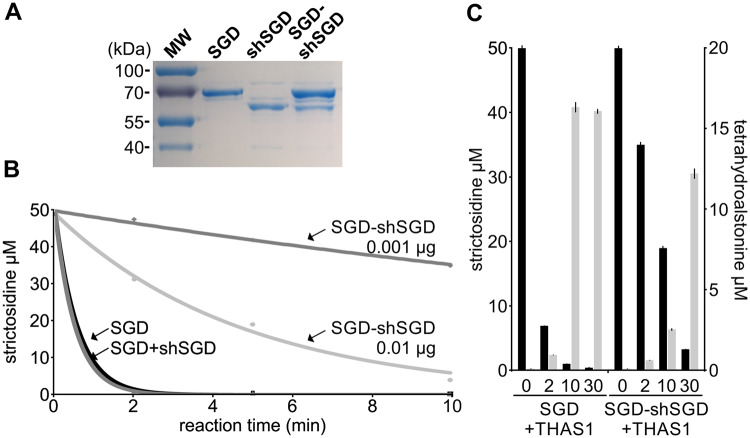
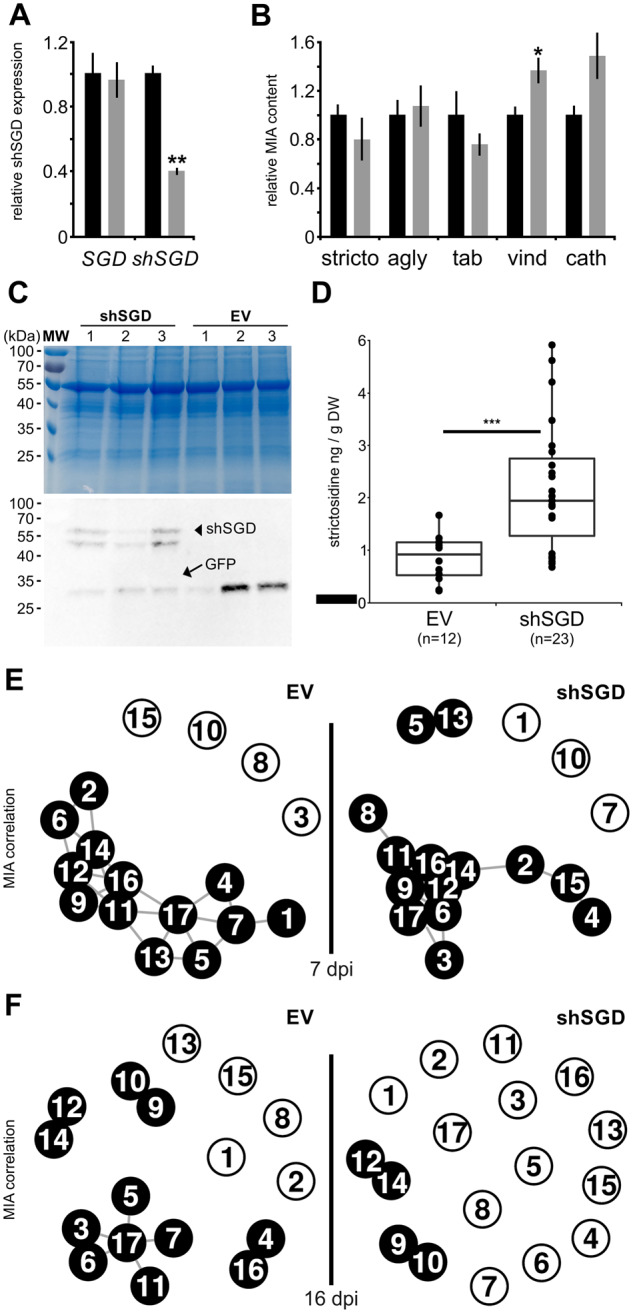
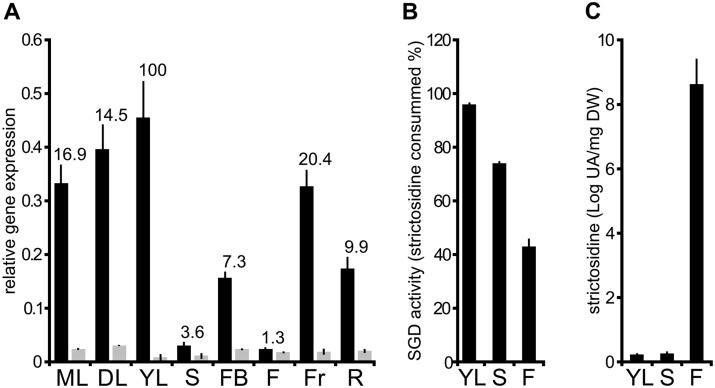
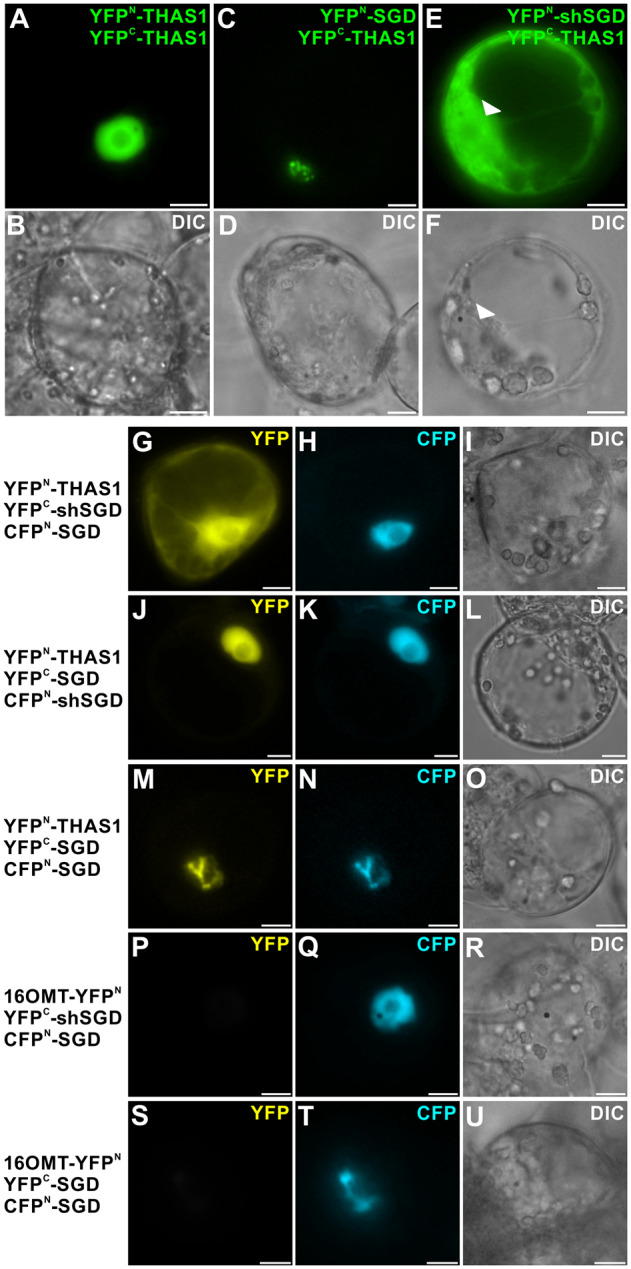
Deglycosylation is a key step in the activation of specialized metabolites involved in plant defense mechanisms. This reaction is notably catalyzed by β-glucosidases of the glycosyl hydrolase 1 (GH1) family such as strictosidine β-d-glucosidase (SGD) from Catharanthus roseus. SGD catalyzes the deglycosylation of strictosidine, forming a highly reactive aglycone involved in the synthesis of cytotoxic monoterpene indole alkaloids (MIAs) and in the crosslinking of aggressor proteins. By exploring C. roseus transcriptomic resources, we identified an alternative splicing event of the SGD gene leading to the formation of a shorter isoform of this enzyme (shSGD) that lacks the last 71-residues and whose transcript ratio with SGD ranges from 1.7% up to 42.8%, depending on organs and conditions. Whereas it completely lacks β-glucosidase activity, shSGD interacts with SGD and causes the disruption of SGD multimers. Such disorganization drastically inhibits SGD activity and impacts downstream MIA synthesis. In addition, shSGD disrupts the metabolic channeling of downstream biosynthetic steps by hampering the recruitment of tetrahydroalstonine synthase in cell nuclei. shSGD thus corresponds to a pseudo-enzyme acting as a regulator of MIA biosynthesis. These data shed light on a peculiar control mechanism of β-glucosidase multimerization, an organization common to many defensive GH1 members.


Figures

Figure 1
Figure 1
Deglycosylation of strictosidine and associated arising reactions. In C. roseus, the deglycosylation of strictosidine by strictosidine β-d-glucosidase (SGD) leads to the formation of a reactive aglycone that causes protein crosslinking during the “nuclear-time bomb” defense process or undergoes a spontaneous rearrangement initiating the synthesis of downstream MIAs. Enzymatic and spontaneous reactions are indicated by enzyme name or blank in front of arrows. Double dashed arrows represent multiple biosynthetic reactions. HYS, heteroyohimbine synthase; THAS, tetrahydroalstonine synthase.
Figure 2
Figure 2
Alternative splicing generates shSGD by intron retention. A, Genomic organization of SGD and shSGD depicting the general exon/intron junctions. The genomic coordinates were obtained with a reconstructed scaffold from the sequencing of a genomic BAC containing the SGD locus. B, Focus on the 3′-end of exon 12 and on the consequence of intron retention. C, Donor and acceptor sites of splicing of intron 12 are highlighted by solid lines and putative branch points are shown by white rectangles. D, Amino acid sequences of SGD and the truncated protein encoded by SRR924148_TR34256_c6_g1_i5_len=2115. Red letters and stars indicate mutated amino acids and protein ends, respectively. The bipartite NLS of SGD is underlined. E, Amplification of specific fragments of SGD and shSGD transcripts by RT-PCR performed on RNA from leaves. A combination of primers common to both transcripts was used as a control.
Figure 3
Figure 3
shSGD does not deglycosylate strictosidine. A, SDS-PAGE analysis of the purified SGD and shSGD. B, Time-course analysis of a representative strictosidine deglycosylation conducted by incubating 50 µM of strictosidine with SGD or shSGD. C, MIAs formed through deglycosylation of strictosidine by SGD. 1, epi-cathenamine; 2, dehydrogeissoschizine; 3, cathenamine. D, The aglycone crosslinking product resulting from SGD activity. E, Coomassie blue staining and F, zymogram of SGD and shSGD activities. Non-heat-treated recombinant proteins were separated on a semi-native PAGE before incubation in a MUGlc containing solution and UV-visualization.
Figure 4
Figure 4
shSGD displays a nucleocytosolic localization. Catharanthus roseus (A–L) and onion (M–P) cells were transiently transformed with plasmids expressing either shSGD–YFP (A, M), YFP-shSGD (E), SGD-YFP (I), or YFP-SGD (K) and a plasmid encoding the nucleocytosolic CFP marker (B, F, and N). Co-localization of the fluorescence signals appears in yellow when merging the two individual (green/red) false color images (C, G, and O). Cell morphology is observed with differential interference contrast (DIC) (D, H, J, L, and P). Bars, 10 µm.
Figure 5
Figure 5
shSGD and SGD are co-expressed in variable proportions. A, Relative abundance of SGD (light gray; SRR342023_TR15323_c0_g2_i2_len=2096) and shSGD (dark gray; SRR924148_TR34256_c6_g1_i5_len=2115) transcripts in paired-end samples available in public databases, including multiple organs and experimental conditions. Each entity is expressed as a percentage of the total SGD transcript (shSGD + SGD) amount. B, Relative quantification of SGD and shSGD transcripts in intact C. roseus leaves (light gray) and in C. roseus leaves (L.) subjected to folivory (FOL.) by M. sexta (dark gray). RNAs were extracted from both leaf treatments and reverse-transcribed before determination of relative gene expression by qPCR. Transcript copy numbers were normalized using CrRPS9. For both experiments, assays were performed in triplicate, and expression measurements were performed at least twice with independent experimental replicates (data represents means ± SE). C, Relative expression of SGD, shSGD, THAS1, and HDS in epidermis-enriched fractions of C. roseus leaves (dark gray) compared with the whole-leaf fraction (light gray). Epidermis-enriched transcript fractions were generated by a carborundum abrasion and both fraction types were reverse-transcribed before determination of relative gene expression by qPCR. Transcript copy numbers were normalized using CrRPS9 and expressed relative to the amount of transcript measured in the whole-leaf fraction. Data represent means ± SE of three technical replicates of two biological replicates.
Figure 6
Figure 6
shSGD is not capable of self-interactions but affects the enzymatically active multimeric conformation of SGD by disrupting SGD high-molecular-weight complexes. A, SGD; C, shSGD self-interactions; and E, shSGD/SGD interactions were analyzed by BiFC in C. roseus cells transiently transformed by appropriate combinations of plasmids encoding fusions with the two split YFP fragments, as indicated on the right of each fluorescence picture. Cell morphology is observed with differential interference contrast (DIC) (B, D, and F). Bars, 10 µm. G, Observation of the recombinant purified SGD multimers purified from E. coli by negative staining electron microscopy, (H) transversal observation of the multimers, and (I) multimers at a higher magnification. J, Immunoblot analysis of denatured protein extracts of E. coli expressing either SGD or SGD-shSGD constructs normalized based on the monomeric conformation of SGD. K, The same quantity of proteins was then resolved in acrylamide gels without denaturing the extracts (i.e. non-heat treatment) followed by immunoblotting. L, Since the supramolecular structure of the multimeric conformation of SGD barely migrated to the PVDF membrane, Coomassie brilliant blue-staining was used to highlight the difference in the assembly of the multimeric conformation of SGD. M, The enzymatic activity of extracts co-expressing SGD-shSGD was barely detected compared with extracts expressing SGD as revealed by zymography.
Figure 7
Figure 7
shSGD decreases SGD deglycosylation activity and production of tetrahydroalstonine in vitro. A, Integrity of the recombinant proteins used for the assays was checked by PAGE analysis after loading 0.5 µg per lane. B, Time-course analysis of strictosidine deglycosylation assays conducted by incubating 50 µM of strictosidine with SGD (0.001 µg), individually expressed SGD and shSGD (SGD+shSGD; 0.001 µg each), and co-expressed SGD and shSGD (SGD-shSGD; 0.001 and 0.01 µg) for 0, 2, 5, and 10 min. Assays were conducted in triplicate. Error bars are sd, but are too small to being visible. C, Effect of shSGD on downstream MIA production measured in vitro by tetrahydroalstonine production (light gray) by incubating 50 µM of strictosidine (dark gray) with SGD (0.001 µg) plus THAS (0.1 µg) or with co-expressed SGD and shSGD (SGD-shSGD; 0.01 µg) plus THAS (0.1 µg). Assays were conducted in technical triplicates and were repeated twice.
Figure 8
Figure 8
shSGD negatively impacts SGD deglycosylation activity. A, Relative expression of SGD and shSGD in leaves of plants transformed by empty vector (EV, black bar) or by the pTRV2-shSGD silencing construct (shSGD, gray bar) measured by RT-qPCR. B, Relative means of strictosidine (stricto), strictosidine aglycone (agly), tabersonine (tab), vindoline (vind), and catharanthine (cath) contents in leaves of EV (black bar) and shSGD (gray bar) transformed plants. Data represent means ± se of three technical replicates performed on four plants transformed with EV or shSGD (see Supplemental Material and Methods). Asterisks denote statistical significance (*P < 0.005; **P < 0.001; by Student’s t test). C, Coomassie blue staining and immunoblot analysis of crude protein extracts (15 µg per lane) from C. roseus leaves agroinfiltrated with pEAQ-HT:GFP-6His and either pEAQ-HT:shSGD-6His or empty vector (EV). D, Strictosidine concentration in infiltrated leaves (three independent biological replicates consisting of three plants transformed with EV, six plants transformed with shSGD construct, and for each plant four infiltrated leaves except for one sample of shSGD were analyzed after 7 d, thus totaling 12 EV samples and 23 shSGD samples). Points correspond to individual samples. Asterisks denote statistical significance in difference between the means (Wilcoxon rank sum test, P < 0.001). E and F, Metabolite correlation networks in control and shSGD overexpressing plants. Correlations among metabolite concentrations were calculated over 87 and 96 samples, respectively, from 10 plants and at least 8 infiltrated leaves for each construct at 7 d (E) and 16 d (F) post-infiltration (dpi). Nodes correspond to metabolites: 1, secologanin; 2, strictosidine; 3, tabersonine; 4, tabersonine imine alcohol; 5, 16-hydroxytabersonine; 6, 16-methoxytabersonine; 7, 16-methoxytabersonine epoxide; 8, 16-methoxy-2,3-dihydrotabersonine; 9, desacetoxyvindoline; 10, desacetoxyvindorosine; 11, desacetylvindoline; 12, vindoline; 13, demethylvindorosine; 14, catharanthine; 15, vinblastine; 16, ajmalicine; 17, serpentine. Node pairs connected by black lines indicate a Spearman rho >0.6 (E) and rho >0.7 (F) for these pairs, the higher the correlation, the shorter the line.
Figure 9
Figure 9
In planta correlation of shSGD and SGD transcript amounts, SGD activity, and strictosidine accumulation. A, Relative quantification of SGD (dark) and shSGD (gray) transcripts in different C. roseus organs including mature leaves (ML), developing leaves (DL), young leaves (YL), stems (S), flower buds (FB), flowers (F), fruits (Fr), and roots (R). RNAs were extracted from organs and reverse-transcribed before determination of gene expression by qPCR. Transcript copy numbers were normalized using CrRPS9. Values correspond to SGD/shSGD rations in the different organ types. B, SGD activity was measured in YL, S, and F by incubating 15 µg of each crude protein extract with 50 µM strictosidine for 30 min. SGD activity is expressed as the percent of consumed strictosidine. C, Quantification of in planta strictosidine in YL, S, and F. For all experiments in G, H, and I, assays were performed in triplicate, and expression measurements were performed at least twice with independent experimental replicates.
Figure 10
Figure 10
shSGD/THAS1 interaction causes partial delocalization of THAS1 to the cytosol and impacts the distribution of SGD/THAS1 complexes. A and B, THAS1 self-interactions; C and D, SGD/THAS1; and E and F, shSGD/THAS1 interactions were analyzed by BiFC in C. roseus cells transiently transformed by appropriated combinations of plasmids encoding fusions with the two split YFP fragments, as indicated on the right of each fluorescence picture. Arrowheads label cell nucleus. G–O, C. roseus cells were transiently co-transformed by the combinations of plasmids described on the left margin, expressing THAS1, shSGD, or SGD fused to split YFP fragment (YFPN and YFPC) and SGD or shSGD fused to a split CFP fragment (CFPN-SGD). P–R, 16-Hydroxytabersonine 16OMT/SGD/shSGD self-interactions and S–U, 16OMT/SGD/SGD interactions were studied to evaluate the specificity of THAS1/SGD and THAS1/shSGD interactions. Association of the two split YFP fragments results in the emission of a yellow fluorescent signal (G, J, and M), whereas association of split CFPN and split YFPC (H, K, N, Q, and T) allows the emission of a blue fluorescent signal. Cell morphology is observed with differential interference contrast (DIC) (B, D, F, I, L, O, R, and U). Bars, 10 µm.

References

    1. Baek M, Park T, Heo L, Park C, Seok C (2017) GalaxyHomomer: a web server for protein homo-oligomer structure prediction from a monomer sequence or structure. Nucleic Acids Res 45:W320–W324. - PMC - PubMed
    1. Barleben L, Panjikar S, Ruppert M, Koepke J, Stöckigt J (2007) Molecular architecture of strictosidine glucosidase: the gateway to the biosynthesis of the monoterpenoid indole alkaloid family. Plant Cell 19:2886–2897. - PMC - PubMed
    1. Besseau S, Kellner F, Lanoue A, Thamm AM, Salim V, Schneider B, Geu-Flores F, Höfer R, Guirimand G, Guihur A, et al. (2013) A pair of tabersonine 16-hydroxylases initiates the synthesis of vindoline in an organ-dependent manner in Catharanthus roseus. Plant Physiol 163:1792–1803. - PMC - PubMed
    1. Blanchard DJ, Cicek M, Chen J, Esen A (2001) Identification of β-glucosidase aggregating factor (BGAF) and mapping of BGAF binding regions on maize β-glucosidase. J Biol Chem 276:11895–11901. - PubMed
    1. Bolger AM, Lohse M, Usadel B (2014) Trimmomatic: a flexible trimmer for Illumina sequence data. Bioinformatics 30:2114–2120. - PMC - PubMed

Publication types

MeSH terms

LinkOut - more resources