. 2021 Apr 2;185(3):1198-1215.
doi: 10.1093/plphys/kiaa093.

Gibberellin signaling mediates lateral root inhibition in response to K+-deprivation

Affiliations

Gibberellin signaling mediates lateral root inhibition in response to K+-deprivation

Flora M Hetherington et al. Plant Physiol. .

Abstract

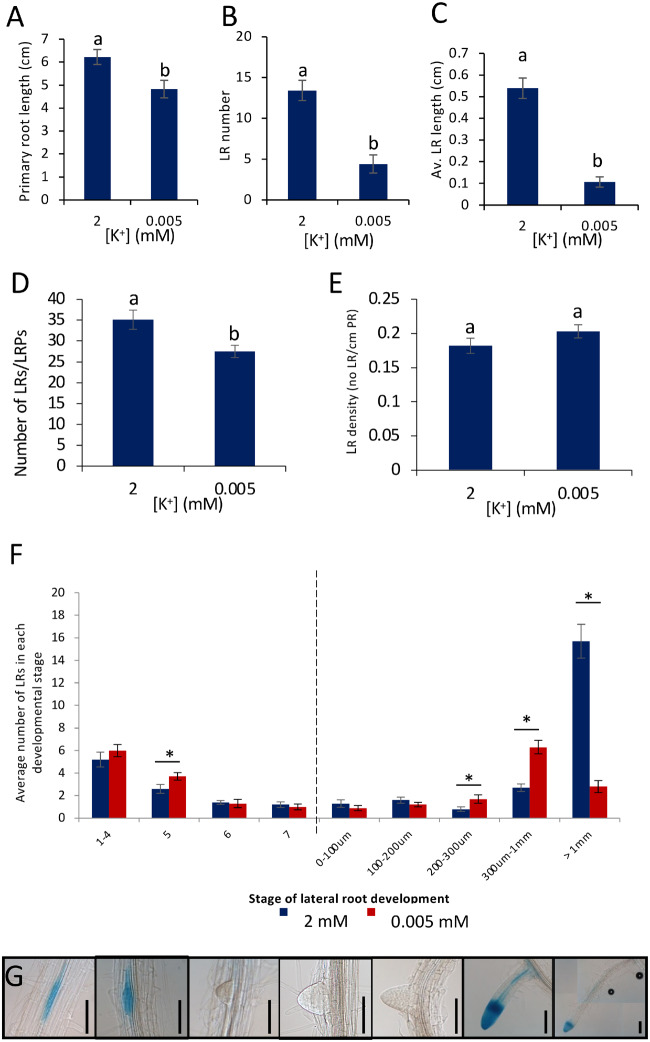
The potassium ion (K+) is vital for plant growth and development, and K+-deprivation leads to reduced crop yields. Here we describe phenotypic, transcriptomic, and mutant analyses to investigate the signaling mechanisms mediating root architectural changes in Arabidopsis (Arabidopsis thaliana) Columbia. We showed effects on root architecture are mediated through a reduction in cell division in the lateral root (LR) meristems, the rate of LR initiation is reduced but LR density is unaffected, and primary root growth is reduced only slightly. This was primarily regulated through gibberellic acid (GA) signaling, which leads to the accumulation of growth-inhibitory DELLA proteins. The short LR phenotype was rescued by exogenous application of GA but not of auxin or by the inhibition of ethylene signaling. RNA-seq analysis showed upregulation by K+-deprivation of the transcription factors JUNGBRUNNEN1 (JUB1) and the C-repeat-binding factor (CBF)/dehydration-responsive element-binding factor 1 regulon, which are known to regulate GA signaling and levels that regulate DELLAs. Transgenic overexpression of JUB1 and CBF1 enhanced responses to K+ stress. Attenuation of the reduced LR growth response occurred in mutants of the CBF1 target gene SFR6, implicating a role for JUB1, CBF1, and SFR6 in the regulation of LR growth in response to K+-deprivation via DELLAs. We propose this represents a mechanism to limit horizontal root growth in conditions where K+ is available deeper in the soil.


Figures

Figure 1
Figure 1
Effect of K+-deprivation on root development of Arabidopsis. WT accession Col-0 seedlings were grown for 4 d on half MS10 agar plates followed by 8 d on vertical agar plates supplemented with either 2 mM or 0.005 mM K+. A, Average PR length. B, Average emerged LR number. C, Average LR length. D, Average number of LRP and LRs per seedling. E, Average LR density (total LRs/PR length) per seedling. F, Average number of LRs in each stage of development on each PR. Dotted line indicates point of emergence from the PR. G, DR5::GUS staining pattern of LR development. Stages shown are (left-right) 1–4, 5, 6, and 7 as defined by Malamy and Benfey (1997), 0–100 µm, 300 µm to 1 mm, and >1 mm. Scale bars = 100 µm. Values represent means ± se, n ≥ 10. Letters indicate significance with independent samples t test (P < 0.05) (a) P = 0.009, (b) P = 0.000, (c) P = 0.000, (d) P = 0.013, (e) P = 0.167. (f) Categories and associated P-values; 1–4 (P= 0.361), 5 (P = 0.049), 6 (P  =0.806), 7 (P = 0.584), 1–100 µm (P = 0.340), 100–200 µm (P = 0.246), 200–300 µm (P = 0.045), 300 µm to 1 mm (P = 0.000), and >1 mm (P = 0.000).
Figure 2
Figure 2
Effect of K+-deprivation on LR meristem activity. A, LR meristems of Col-0 seedlings grown for 4 d on half MS10 then 8 d on 2 mM [K+] (left) or 0.005 mM (right) [K+]. Arrows denote meristem size. Scale bar = 50 µm. B, Length of meristems in LRs of between 300 µm and 1 mm in length. The meristem border is defined as the region of isodiametric cells from the QC up to the cell that was twice the length of the immediately preceding cell (calculated from the cortex cell layer). Values represent means± se, n ≥ 18 taken from at least 15 individual seedlings. Letters indicate significance with independent samples t test (P < 0.05) (P = 0.000). C, CYCB1;2:GUS expression in seedlings grown for 4 d on half MS10 followed by 8 d K+ treatment (2 or 0.005 mM); the GUS staining reveals a reduced area of cell division in 0.005 mM [K+]; scale bars = 50 µm. D, Mean number of dividing cells recorded as cells stained blue in the CYCB1;2:GUS line. Values are means ± se, n  ≥ 32, from at least 10 individual seedlings. Letters indicate significance with a Tukey pairwise comparison P < 0.05. E, Lengths of the first seven cells of the elongation zone of LRs grown for 4 d half on MS10 followed by 8 d on 2 or 0.005 mM [K+]. Measurements taken from at least six different seedlings, n  ≥ 11 for all apart from 7, where n = 6. Values are means ± se. Independent sample t tests found no significance between [K+] for any of the cells (P < 0.05). 1 (P = 0.597), 2 (P = 0.1), 3 (P = 0.121), 4 (P = 0.306), 5 (P = 0.268), 6 (P = 0.695), 7 (P = 0.953).
Figure 3
Figure 3
DEGs in seedlings grown on 0.005 mM (K+-deprived) or 2 mM (K+-sufficient) for 3 or 30 h, identified through RNA-Seq. A, Data represent the outputs from three independent biological replicates per sample; P ≤0.05 and a log2 fold change (log2fc) ≥0.5 and FDR < 0.05. Red dots are significant DEGs, black dots are nonsignificant; counts per million after 3 h (A) or 30 h (B) K+-deprivation. C, Histogram of significant DEGs separated into up- and downregulated genes. D–F, Relative normalized levels of transcripts of HAK5 (D), ERF6 (E), and STZ (F) after 30 h K+ treatment (2 mM or 0.005 mM [K+]), determined by RT-qPCR. Expression levels were normalized against AT1G13320; values are means ± se for three biological repeats with three technical repeats. Letters indicate significance between 2 and 0.005 mM with independent samples t test, P < 0.05.
Figure 4
Figure 4
The role of auxin in the reduced LR growth response to K+-deprivation. A, Representative fluorescence in LRs ˂1 mm in length of pDR5rev::3xVENUS-N7 seedlings after 4 d growth on half MS10 followed by 8 d grown on 2 mM (left) or 0.005 mM (right) [K+]. Scale bar = 50 μm. White is PI stain, green is VENUS. B, Relative mean fluorescence of LRs of each treatment measured using ImageJ. Images taken from at least 8 different seedlings per treatment, n  ≥ 14 LRs. Values are means ± se. Letters indicate significance as calculated with an independent sample t test, P = 0.159. C, Normalized relative level of IAA2 transcripts after 72 h K+ treatment (2 or 0.005 mM) determined by RT-qPCR. Samples taken from seedlings 14 DAG, normalized against AT1G13320. Values are means ± se. Three biological repeats and three technical repeats were used. Independent samples t test determined there was no significant difference between treatments, as denoted by letters (P <0.05). D, Mean LR growth over 3 d following [K+] treatment (2 or 0.005 mM in the presence of 0, 1, or 5 nM IAA), 12 DAG. E, Mean LR length after 10 d treatment with 0 and 10 nM IAA or 10 μM NPA, 19 DAG. Values are means of at least eight individual seedlings per sample, ±se for (D, E). Letters indicate significance with a Tukey pairwise comparison, P < 0.05. F, Mean LR growth after 8 d K+ treatment (2 or 0.005 mM), 12 DAG seedlings of Col-0 and aux1-7. Values are means of at least 25 individual seedlings ±SE, n ≥ 25. Letters indicate significance with a Tukey pairwise comparison, P < 0.05.
Figure 5
Figure 5
The role of ethylene in the reduced LR growth response to K+-deprivation. A, Changes in expression of ACS6 and ERF5 after K+ treatments at 3 h and ERF1 and ERF2 after K+ treatments at 30 h. B, Normalized relative level of transcript of ERF1 after 72 h K+ treatment (2 or 0.005 mM [K+]). Samples were taken from seedlings 14 DAG, analyzed by RT-qPCR, and normalized against AT1G13320. Values are means ± se of three biological repeats with three technical repeats. Letters indicate significance with independent samples t test, P < 0.05. C, LR progression analysis. Light microscopy and the auxin-responsive DR5::GUS reporter line allowed all LRP and LRs to be counted along the length of the PR. Col-0 seedlings were analyzed 12 DAG and after 8 d of K+ treatment (2 or 0.005 mM). Primordial stage from 1 to 7 as defined in Malamy and Benfey (1997). Stages 1–4 occur before LR founder cells transverse the endodermis and Stages 5–8 take place after the endodermis has been crossed. Stage 8 marks the emergence from the PR and therefore has been characterized here within the 0–100 µm category. Media were supplemented with 1 μM Ag2+. Values are averages taken from at least seven individual seedlings ±se. Asterisks indicate significance with independent samples t test, P < 0.05). D, Mean length of LRs after 8 d K+ treatment (2 or 0.005 mM) 12 DAG of seedlings of Col-0 and ethylene mutants ein2 and etr1-1 values are means of at least 10 individual seedlings ±SE. Letters indicate significance with a Tukey pairwise comparison, P < 0.05.
Figure 6
Figure 6
The role of GA in the reduced LR growth response to K+-deprivation. A, B, Effect of K+-deprivation on GA-related gene expression. Transcription of GA2ox6 (A), GA3ox1 (B) after 30, 54, and 72 h K+ treatment (2 or 0.005 mM), determined by RT-qPCR and normalized against AT1G13320. Seedlings were grown for 11 d on half MS10 followed by transfer to K+ treatment. Values are means ± SE of three biological repeats with three technical repeats. Asterisks indicate significance with independent samples t test, P < 0.05. C, proRGA::GFP:RGA protein localization in LRs grown for 9 d on half MS10 followed by 2 mM (top panels) or 0.005 mM (bottom panels) [K+] for 2, 3, 4, or 8 d; scale bars = 20 μm. D, Relative mean fluorescence of RGA GFP in LRs after 2, 3, 4, or 8 d K+ treatment (2 or 0.005 mM). LRs ˂1 mm were analyzed for all treatments apart from 8 d where LRs under and ˃1 mm were analyzed. Images taken from at least six different seedlings; values represent means ± SE. Asterisks indicate significance from independent samples t test, P < 0.05.
Figure 7
Figure 7
Effect of GA on meristem activity under K+-deprivation. A, CYCB1;2:GUS expression (GUS histochemistry) shows a reduced area of cell division in reduced [K+]; scale bars = 50 µM; length of meristem measured as the length of root with dividing cells. LRs > 1 mm. Media were supplemented with either 10 µM GA or 0.1 µM PAC for 8 d. Analysis was carried out on seedlings 12 DAG. Values are mean ± SE taken from at least six individual seedlings per treatment. B, Mean LR growth over 3 d on 2 or 0.005 mM K+ treatment. Seedlings were grown for 9 d on half MS10 before movement to K+ treatment. Values are means ± SE taken from at least 17 individual seedlings per treatment. C, Mean LR growth of Col-0 or the ga2ox quintuple mutant (Rieu et al., 2008) grown on 2 or 0.005 mM K+ for 3 d. Seedlings were analyzed 12 DAG. Values are means ± se of at least 10 individual seedlings per treatment. For all panels, letters indicate significance with a Tukey pairwise comparison, P < 0.05.
Figure 8
Figure 8
Role of TFs in regulating LR growth under K+-deprivation. A, Average LR growth over 3 d K+-deprivation in WT and erf5 erf6 double mutant seedlings. B, Average LR length of WT, jub1-1 and JUB1 overexpressing seedlings after 8 d K+-deprivation. C, D, Mean length of PRs (C) and LRs (D) after 4 d of growth on half MS10 and then 8 d of K+ treatment (2 or 0.005 mM) of Col-0 and CBF1-overexpressing seedlings. E, F, Average LR growth over 3 d (E) and 8 d (F) K+-deprivation in WT and sfr6-1 mutant seedlings. Values are averages taken from nine individual seedlings (A, B), 17 seedlings (C, D), and 21 seedlings (E, F) ±se. Letters indicate significance with a Tukey pairwise comparison, P < 0.05.

Similar articles

Cited by

References

    1. Achard P, Cheng H, De Grauwe L, Decat J, Schoutteten H, Moritz T, Van Der Straeten D, Peng J, Harberd NP (2006) Integration of plant responses to environmentally activated phytohormonal signals. Science 311:91–94 - PubMed
    1. Achard P, Genschik P (2009) Releasing the brakes of plant growth: how GAs shutdown Della proteins. J Exp Bot 60:1085–1092 - PubMed
    1. Achard P, Gong F, Cheminant S, Alioua M, Hedden P, Genschik P (2008a) The cold-inducible CBF1 factor-dependent signalinng pathway modulates the accumulation of the growth- repressing DELLA proteins via its effect on gibberellin metabolism. Plant Cell 20:2117–2129 - PMC - PubMed
    1. Achard P, Renou JP, Berthomé R, Harberd NP, Genschik P (2008b) Plant DELLAs restrain growth and promote survival of adversity by reducing the levels of reactive oxygen species. Curr Biol 18:656–660 - PubMed
    1. Adams F (1971) Soil solution. InCarson EW, ed, The Plant Root and its Environment. Charlottesville, VA, University Press of Virginia, pp 441–481

Publication types

MeSH terms

LinkOut - more resources