. 2021 Apr 23;185(4):1443-1456.
doi: 10.1093/plphys/kiab031.

Plasma membrane phylloquinone biosynthesis in nonphotosynthetic parasitic plants

Affiliations

Plasma membrane phylloquinone biosynthesis in nonphotosynthetic parasitic plants

Xi Gu et al. Plant Physiol. .

Abstract

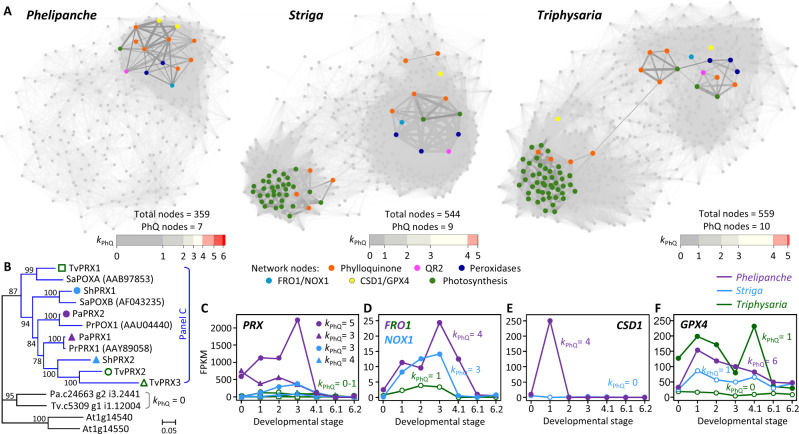
Nonphotosynthetic holoparasites exploit flexible targeting of phylloquinone biosynthesis to facilitate plasma membrane redox signaling. Phylloquinone is a lipophilic naphthoquinone found predominantly in chloroplasts and best known for its function in photosystem I electron transport and disulfide bridge formation of photosystem II subunits. Phylloquinone has also been detected in plasma membrane (PM) preparations of heterotrophic tissues with potential transmembrane redox function, but the molecular basis for this noncanonical pathway is unknown. Here, we provide evidence of PM phylloquinone biosynthesis in a nonphotosynthetic holoparasite Phelipanche aegyptiaca. A nonphotosynthetic and nonplastidial role for phylloquinone is supported by transcription of phylloquinone biosynthetic genes during seed germination and haustorium development, by PM-localization of alternative terminal enzymes, and by detection of phylloquinone in germinated seeds. Comparative gene network analysis with photosynthetically competent parasites revealed a bias of P. aegyptiaca phylloquinone genes toward coexpression with oxidoreductases involved in PM electron transport. Genes encoding the PM phylloquinone pathway are also present in several photoautotrophic taxa of Asterids, suggesting an ancient origin of multifunctionality. Our findings suggest that nonphotosynthetic holoparasites exploit alternative targeting of phylloquinone for transmembrane redox signaling associated with parasitism.


Figures

Figure 1
Figure 1
Phylloquinone biosynthesis in parasitic plants. A, A simplified phylloquinone biosynthetic pathway from top to bottom as numbered and color-coded by their predicted subcellular localization. B, Expression profiles of phylloquinone genes during parasitic plant development. Gene order is the same as in (A), and Y-axis is shown on the right. Developmental stages are as reported (Yang et al., 2015): 0, imbibed seeds; 1, germinated seeds/radicles; 2, HIF-treated seedlings; 3, haustoria, pre-vascular connection; 4.1, haustoria, post-vascular connection; 6.1, leaves/stems; 6.2, floral buds. Data from alternative gene candidates for the penultimate step are shown on the lower right panels, with grey dashed/dotted lines denoting the scale. C, HPLC detection of phylloquinone in germinated P. aegyptiaca seeds (top panel), and with spiked authentic standard (lower panel). Menaquinone (MK-4) was included as a reference. D, HPLC detection of phylloquinone in A. thaliana seed (top panel), and with authentic standard (lower panel)
Figure 2
Figure 2
Characterization of MenA and MenG. A, Plastid-targeting prediction of MenA and MenG polypeptides from various species. Heatmaps show prediction strengths above the 50th percentile of each method. Those with a high prediction score from at least one program are deemed potentially plastidial, as not all methods accurately predict experimentally characterized plastidial proteins (asterisks). Introns are not drawn to scale. CDS, coding sequence; UTR, untranslated region. B, Transmembrane domain prediction of AtMenA (green line denoting the transit peptide) and PaMenA2 (shifted x-axis for domain alignment). C–D, Confocal images of PaMenA2-GFP (C) and PaMenG2-GFP (D) colocalization with a plasma membrane marker AtPIP2A-mCherry. Scale bars = 20 µm. E, HPLC analysis of E. coli ΔmenG mutant strain JW5581 expressing PaMenG2 or the EcMenG control. (D)MK-8, (demethyl)menaquinone-8. F–G, Bayesian phylogeny of MenA and MenG from representative Asterids and two Rosids. Af, Aphyllon fasciculata; At, Arabidopsis thaliana; Ca, Conopholis americana; Lp, Lindenbergia philippensis; Migut, Mimulus guttatus; Pa, Phelipanche aegyptiaca; Potri, Populus trichocarpa; Rg, Rehmannia glutinosa; Solyc, Solanum lycopersicum; Sh, Striga hermonthica; Tv, Triphysaria versicolor; Vt, Verbascum thapsus. Branch support is shown for major nodes. Scale indicates the number of amino acid substitutions per site
Figure 3
Figure 3
Coexpression of phylloquinone genes. A–F, Coexpression patterns among phylloquinone biosynthetic genes, including multifunctional NDC1 and QR2, based on Gini correlation coefficient. Relevant genes or gene members involved in phylloquinone biosynthesis are boxed. The exceptions are A. thaliana AtICSs involved in salicylic acid biosynthesis for defense and AtDHNATs in peroxisomal β-oxidation (dashed box), besides phylloquinone biosynthesis. The corresponding Arabidopsis, Glycine, and Populus gene models are shown on the x-axis with shortened prefix for soybean (Gm = Glyma) and poplar (Pt = Potri). G, GO enrichments of phylloquinone-coexpressed genes defined as the union set of the top 500 most highly correlated transcripts for each phylloquinone gene. Only the top 10 categories are shown. Similar results were obtained using Gini correlation coefficient ≥0.8 to extract phylloquinone-coexpressed genes
Figure 4
Figure 4
Phylloquinone gene coexpression networks. A, Network visualization of the three parasitic plants. Edge thickness reflects the coexpression strength. Key gene nodes are color-coded by pathway or family, and QR2 is colored differently from the other phylloquinone genes (NDC1 was not captured in any of the networks). Horizontal bars depict the distribution of nodes according to their connectivity with phylloquinone genes (kPhQ). B, Bayesian phylogeny of peroxidases (PRX). Orthologs of experimentally characterized PRXs are color-coded by species in the blue clade. Scale indicates the number of amino acid substitutions per site. C–F, Expression profiles of PRX (C), FRO1/NOX1 (D), CSD1 (E), and GPX4 (F) orthologs. Solid symbols denote phylloquinone-coexpressed genes (kPhQ ≥3), and others are shown in open symbols. Developmental stages are the same as in Figure 1
Figure 5
Figure 5
Evolutionary changes in subcellular localization of phylloquinone biosynthesis. Conserved early- and mid-pathway steps are shown as circled numbers (1–7, see Figure 1) and late pathway steps MenA and MenG are abbreviated as A1/A2 and G1/G2, respectively. Circle colors denote different subcellular compartments: green, plastid; orange, peroxisome (px); purple, PM. Branches of the simplified eudicot phylogeny in the middle point to corresponding illustrations of changing pathway organization with representative species indicated. Clockwise from lower left, exclusively plastidial late steps in rosids and some asterids such as solanales; top left, dual plastidial and plasma membrane targeting in certain photosynthetic Orobanchaceae, attributable to lamiale-specific duplication of MenA and MenG. Differential losses of MenA and MenG genes in other photosynthetic, hemiparasitic (top right) and holoparasitic (lower right) lineages, with the latter exclusively PM targeting. pg, plastoglobule

References

    1. Alexa A, Rahnenführer J, Lengauer T (2006) Improved scoring of functional groups from gene expression data by decorrelating GO graph structure. Bioinformatics 22:1600–1607 - PubMed
    1. Anders S, Pyl PT, Huber W (2015) HTSeq—a Python framework to work with high-throughput sequencing data. Bioinformatics 31:166–169 - PMC - PubMed
    1. Attacha S, Solbach D, Bela K, Moseler A, Wagner S, Schwarzländer M, Aller I, Müller Stefanie J, Meyer Andreas J (2017) Glutathione peroxidase‐like enzymes cover five distinct cell compartments and membrane surfaces in Arabidopsis thaliana. Plant Cell Environ 40:1281–1295 - PubMed
    1. Baba T, Ara T, Hasegawa M, Takai Y, Okumura Y, Baba M, Datsenko KA, Tomita M, Wanner BL, Mori H (2006) Construction of Escherichia coli K-12 in-frame, single-gene knockout mutants: the Keio collection. Mol Syst Biol 2: 2006.0008-2006.0008 - PMC - PubMed
    1. Babujee L, Wurtz V, Ma C, Lueder F, Soni P, van Dorsselaer A, Reumann S (2010) The proteome map of spinach leaf peroxisomes indicates partial compartmentalization of phylloquinone (vitamin K1) biosynthesis in plant peroxisomes. J Exp Bot 61:1441–1453 - PubMed

Publication types