. 2021 Apr 29;184(9):2384-2393.e12.
doi: 10.1016/j.cell.2021.03.036. Epub 2021 Mar 20.

SARS-CoV-2 variants B.1.351 and P.1 escape from neutralizing antibodies

Affiliations

SARS-CoV-2 variants B.1.351 and P.1 escape from neutralizing antibodies

Markus Hoffmann et al. Cell. .

Abstract

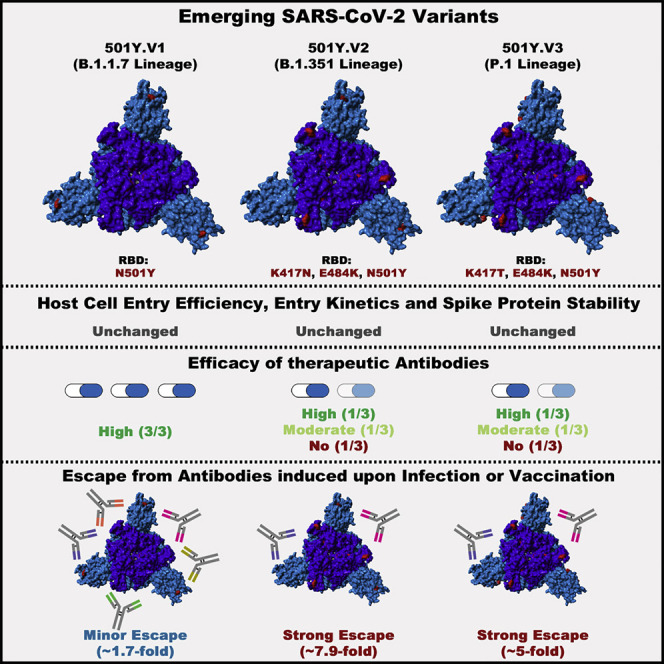
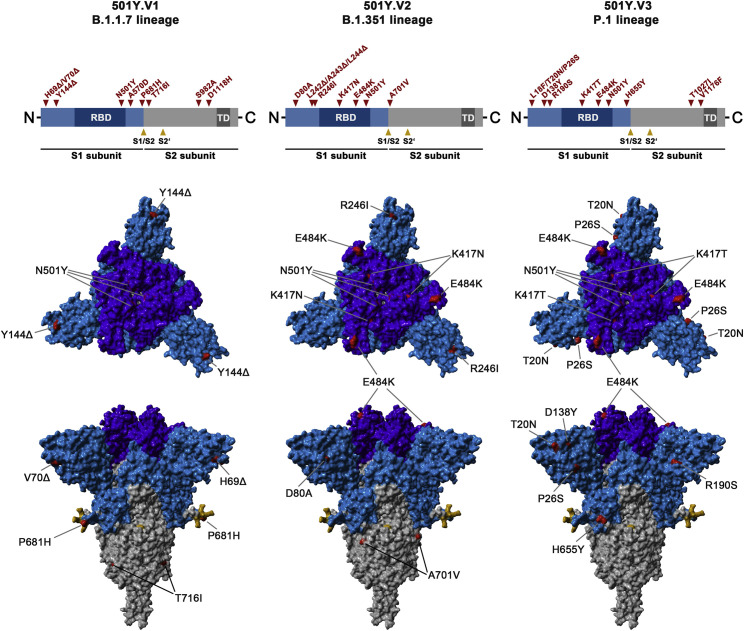
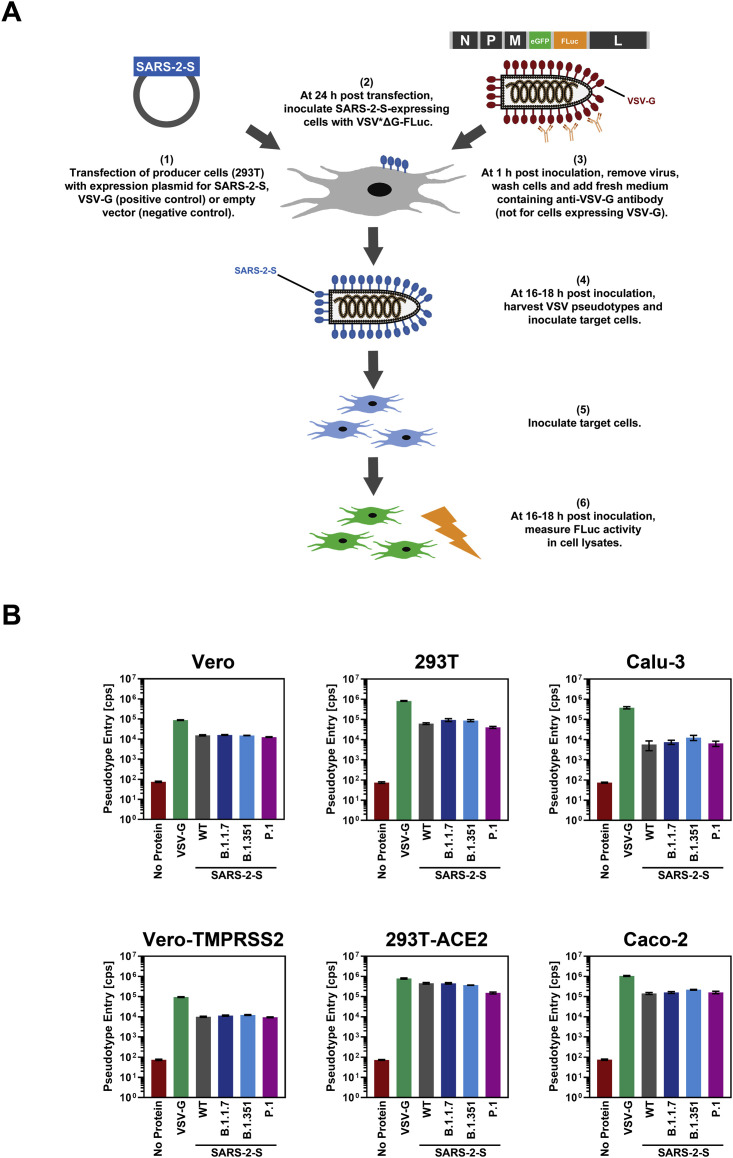
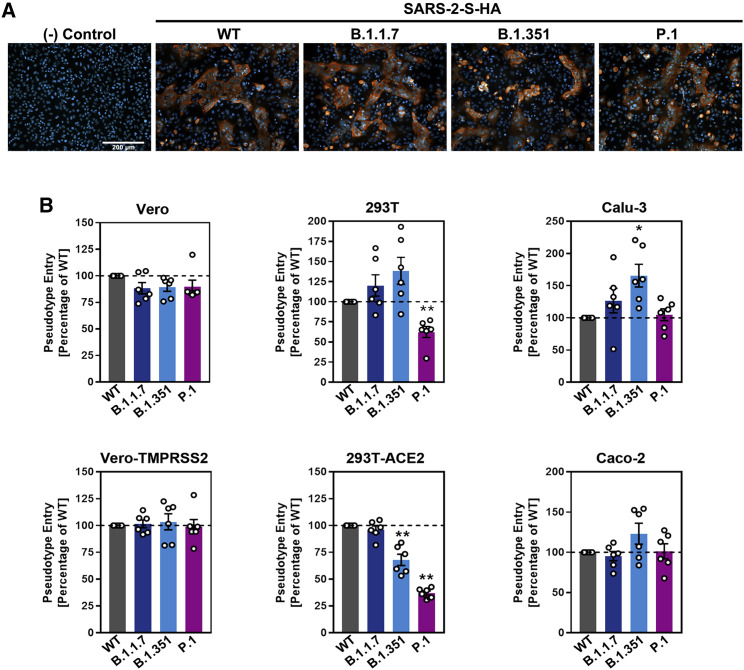
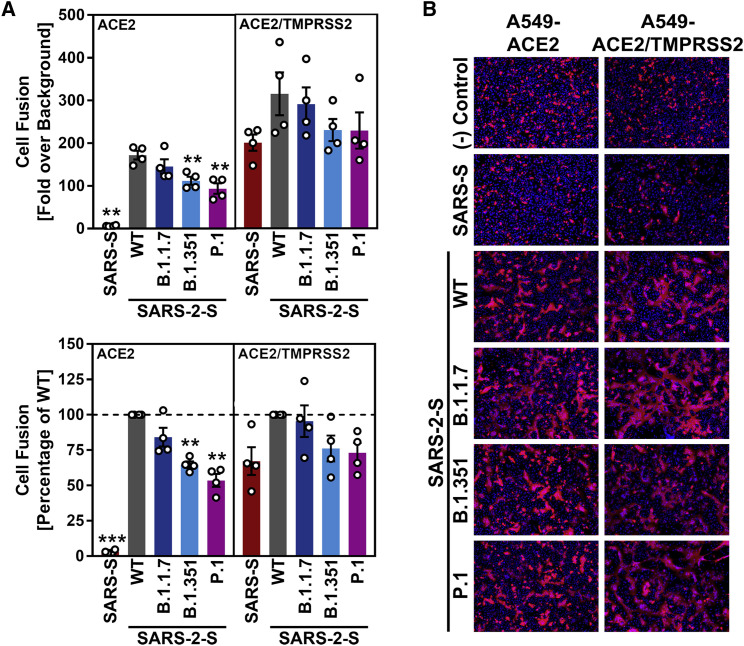
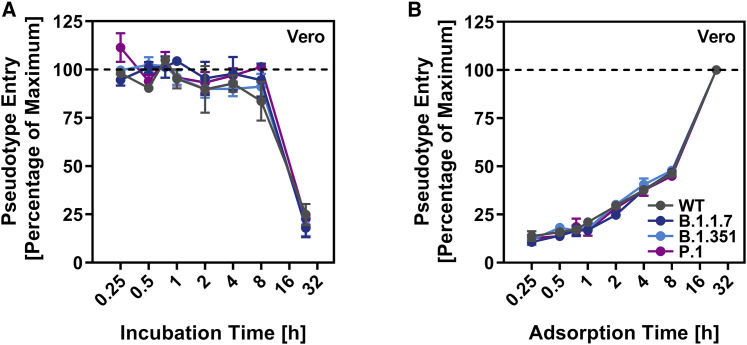
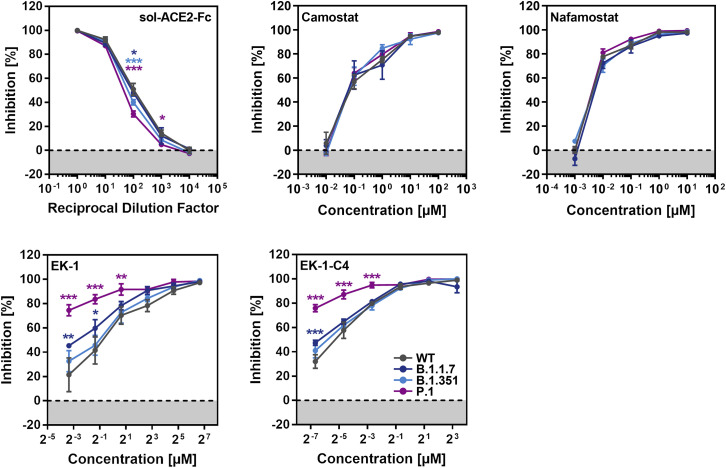
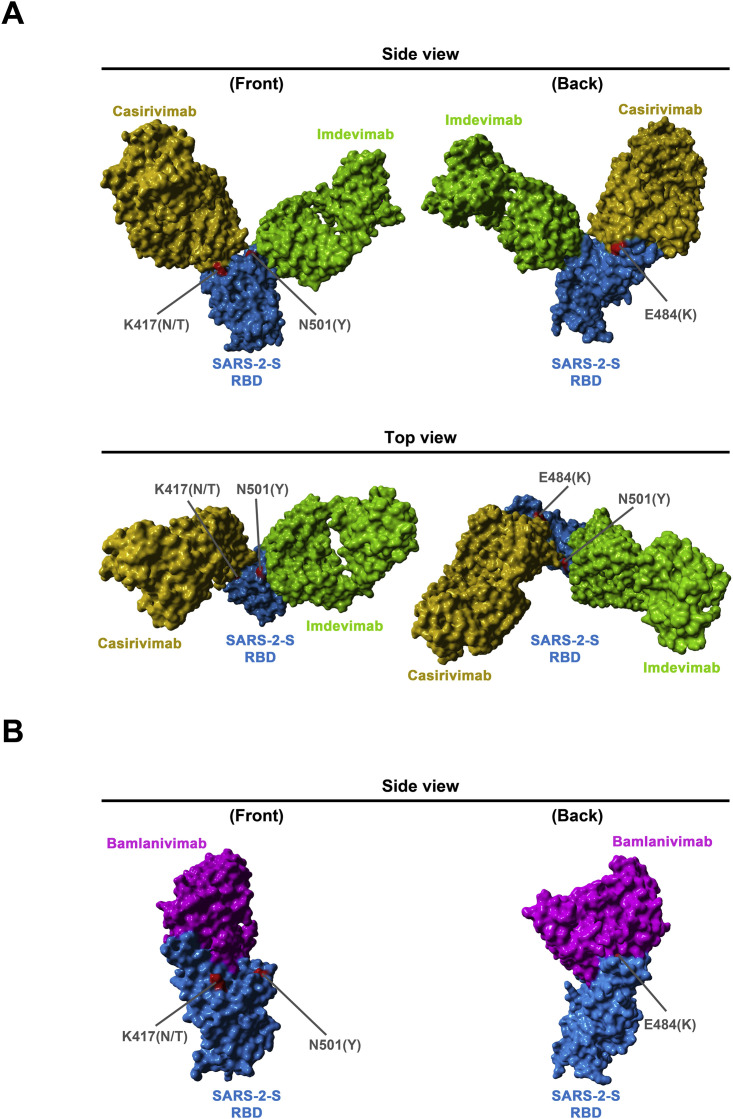
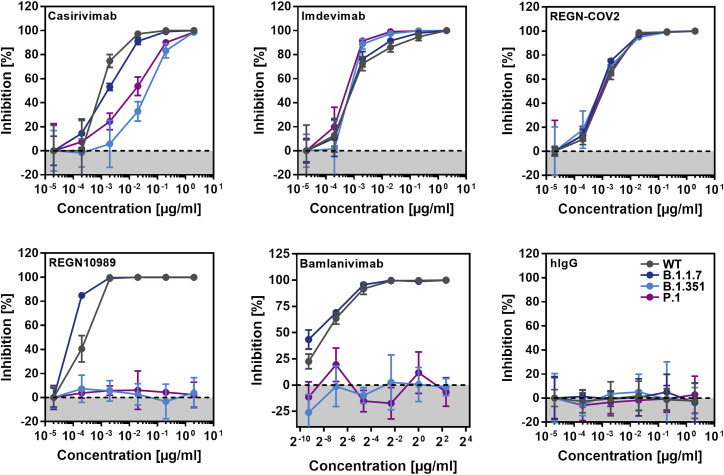
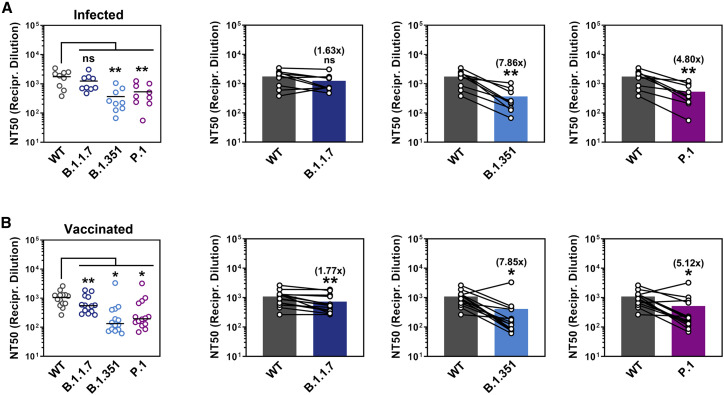
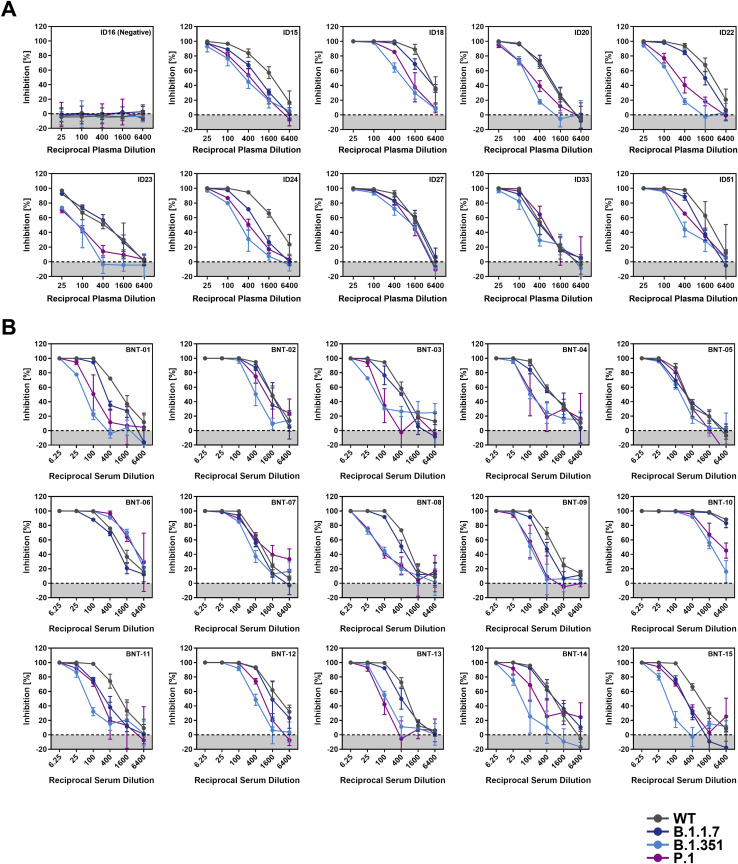
The global spread of SARS-CoV-2/COVID-19 is devastating health systems and economies worldwide. Recombinant or vaccine-induced neutralizing antibodies are used to combat the COVID-19 pandemic. However, the recently emerged SARS-CoV-2 variants B.1.1.7 (UK), B.1.351 (South Africa), and P.1 (Brazil) harbor mutations in the viral spike (S) protein that may alter virus-host cell interactions and confer resistance to inhibitors and antibodies. Here, using pseudoparticles, we show that entry of all variants into human cells is susceptible to blockade by the entry inhibitors soluble ACE2, Camostat, EK-1, and EK-1-C4. In contrast, entry of the B.1.351 and P.1 variant was partially (Casirivimab) or fully (Bamlanivimab) resistant to antibodies used for COVID-19 treatment. Moreover, entry of these variants was less efficiently inhibited by plasma from convalescent COVID-19 patients and sera from BNT162b2-vaccinated individuals. These results suggest that SARS-CoV-2 may escape neutralizing antibody responses, which has important implications for efforts to contain the pandemic.

Keywords: B.1.1.7; B.1.351; COVID-19; P.1; SARS-CoV-2; VOC; antibodies; escape; host cell entry; neutralization; spike protein; variants; variants of concern.


Conflict of interest statement

Declaration of interests The authors declare no competing interests.

Figures

None
Graphical abstract
Figure 1
Figure 1
Schematic overview of the S proteins from the SARS-CoV-2 variants under study The location of the mutations in the context of S protein domain organization is shown in the upper panel. RBD, receptor-binding domain; TD, transmembrane domain. The location of the mutations in the context of the trimeric S protein is shown in the lower panel. Color code: light blue, S1 subunit with RBD in dark blue; gray, S2 subunit; orange, S1/S2 and S2′ cleavage sites; red, mutated amino acid residues.
Figure S1
Figure S1
Graphical summary of the generation and use of VSV pseudotype particles bearing SARS-2-S and representative transduction data, related to Figure 2 (A) Schematic illustration of how SARS-2-S-bearing VSV pseudotype particles are generated and used for transduction experiments. (B) Raw transduction data (cps, counts per second) from a representative experiment. Presented are the data from a single representative experiment conducted with technical quadruplicates. Error bars indicate the SD. Bald pseudotype particles bearing no viral glycoprotein and particles harboring VSV-G served as negative (assay background) and positive controls, respectively.
Figure 2
Figure 2
S proteins from SARS-CoV-2 variants drive entry into human cell lines (A) Directed expression of SARS-CoV-2 S proteins (SARS-2-S) in A549-ACE2 cells leads to the formation of syncytia. S protein expression was detected by immunostaining using an antibody directed against a C-terminal HA-epitope tag. Presented are the data from one representative experiment. Similar results were obtained in four biological replicates. (B) The S proteins of the SARS-CoV-2 variants mediate robust entry into cell lines. The indicated cell lines were inoculated with pseudotyped particles bearing the S proteins of the indicated SARS-CoV-2 variants or wild-type (WT) SARS-CoV-2 S. Transduction efficiency was quantified by measuring virus-encoded luciferase activity in cell lysates at 16–20 h post transduction. Presented are the average (mean) data from six biological replicates (each conducted with technical quadruplicates). Error bars indicate the standard error of the mean (SEM). Statistical significance of differences between WT and variant S proteins was analyzed by one-way analysis of variance (ANOVA) with Dunnett’s posttest (p > 0.05, not significant [not indicated]; p ≤ 0.05, *; p ≤ 0.01, **; p ≤ 0.001, ***). See also Figure S1.
Figure 3
Figure 3
The S proteins of the SARS-CoV-2 variants drive robust cell-cell fusion (A) Quantitative cell-cell fusion assay. S protein-expressing effector cells were mixed with ACE2 or ACE2/TMPRSS2-expressing target cells, and cell-cell fusion was analyzed by measuring luciferase activity in cell lysates. Presented are the average (mean) data from four biological replicates (each performed with technical triplicates). Error bars indicate the SEM. Statistical significance of differences between WT and variant S proteins (or SARS-S) was analyzed by one-way ANOVA with Dunnett’s posttest (p > 0.05, not significant [not indicated]; p ≤ 0.05, *; p ≤ 0.01, **; p ≤ 0.001, ***). (B) Qualitative fusion assay. A549-ACE2 (left) and A549-ACE2/TMPRSS2 (right) cells were transfected to express the indicated S proteins (or no viral protein) along with DsRed. At 24 h post-transfection, cells were fixed and analyzed for the presence of syncytia by fluorescence microscopy (magnification: 10×). Presented are representative images from a single experiment. Data were confirmed in three additional experiments.
Figure 4
Figure 4
Particles bearing the S proteins of SARS-CoV-2 variants exhibit similar stability and entry kinetics (A) Particles bearing the indicated S proteins were incubated for different time intervals at 33°C, snap frozen, thawed, and inoculated onto Vero cells. Entry of particles that were frozen immediately was set as 100%. (B) Particles bearing the indicated S proteins were incubated for the indicated time intervals with Vero cells. Subsequently, the cells were washed and luciferase activity determined. Transduction measured for particles incubated with cells for 24 h (maximum incubation time = time of luciferase measurement) was set as 100%. For both panels, the average (mean) data from three biological replicates (each performed with technical quadruplicates) is presented. Error bars indicate the SEM. Statistical significance of differences between WT and variant S proteins was analyzed by two-way ANOVA with Dunnett’s posttest (p > 0.05, not significant [not indicated]; p ≤ 0.05, *; p ≤ 0.01, **; p ≤ 0.001, ***).
Figure 5
Figure 5
Entry driven by the S proteins of the SARS-CoV-2 variants can be blocked with soluble ACE2, protease inhibitors targeting TMPRSS2, and a membrane fusion inhibitor Top row, left panel: S protein-bearing particles were incubated with different concentrations of soluble ACE2 (30 min, 37°C) before being inoculated onto Caco-2 cells. Top row, middle and right panel: Caco-2 target cells were pre-incubated with different concentrations of serine protease inhibitor (Camostat or Nafamostat; 1 h, 37°C) before being inoculated with particles harboring the indicated S proteins. Bottom row, both panels: the peptidic fusion inhibitor EK-1 and its improved lipidated derivate EK-1-C4 were incubated with particles at indicated concentrations (30 min, 37°C) and then added to Caco-2 cells. All panels: transduction efficiency was quantified by measuring virus-encoded luciferase activity in cell lysates at 16–20 h post-transduction. For normalization, SARS-CoV-2 S protein-driven entry in the absence of soluble ACE2 or inhibitor was set as 0% inhibition. Presented are the average (mean) data from three biological replicates (each performed with technical triplicates [EK-1, EK-1-C4] or quadruplicates [soluble ACE2, Camostat, Nafamostat]). Error bars indicate the SEM. Statistical significance of differences between WT and variant S proteins was analyzed by two-way ANOVA with Dunnett’s posttest (p > 0.05, not significant [not indicated]; p ≤ 0.05, *; p ≤ 0.01, **; p ≤ 0.001, ***).
Figure S2
Figure S2
Location of SARS-2-S RBD mutations K417N/T, E484K, and N501Y with respect to the binding interface of the REGN-COV2 antibody cocktail and the monoclonal antibody Bamlanivimab, related to Figure 6 The protein models of the SARS-2-S receptor-binding domain (RBD, blue) in complex with antibodies Casirivimab (orange) and Imdevimab (green) (A) were constructed based on the 6XDG template (Hansen et al., 2020), while the protein models of the SARS-2-S RBD in complex with antibody Bamlanivimab (purple) (B) were based on the 7L3N template (Jones et al., 2020). Residues highlighted in red indicate amino acid variations found in emerging SARS-CoV-2 variants.
Figure 6
Figure 6
Cell entry mediated by the S proteins of SARS-CoV-2 variants B.1.351 and P.1 is partially or fully resistant to inhibition by monoclonal antibodies with EUA Pseudotypes bearing the indicated S proteins were incubated (30 min, 37°C) with different concentrations of control antibody (hIgG), four different monoclonal antibodies (Casirivimab, Imdevimab, REGN10989, Bamlanivimab), or a combination of Casirivimab and Imdevimab, as present in the REGN-CoV2 antibody cocktail, before being inoculated onto target Vero cells. Transduction efficiency was quantified by measuring virus-encoded luciferase activity in cell lysates at 16–20 h post-transduction. For normalization, inhibition of S protein-driven entry in samples without antibody was set as 0%. Presented are the data from a single experiment performed with technical triplicates. Data were confirmed in a separate experiment. Error bars indicate standard deviation (SD). See also Figure S2.
Figure 7
Figure 7
Entry driven by the S proteins of SARS-CoV-2 variants B.1.351 and P.1 shows reduced neutralization by convalescent plasma and sera from BNT162b2-vaccinated individuals Pseudotypes bearing the indicated S proteins were incubated (30 min, 37°C) with different dilutions of plasma derived from COVID-19 patients (A, see also Table S1) or serum from individuals vaccinated with the Pfizer/BioNTech vaccine BNT162b2 (obtained 13–15 days after the second dose) (B, see also Table S2) and inoculated onto Vero target cells. Transduction efficiency was quantified by measuring virus-encoded luciferase activity in cell lysates at 16–20 h post-transduction (please see Figure S3 for more details) and used to calculate the plasma/serum dilution factor that leads to 50% reduction in S protein-driven cell entry (neutralizing titer 50, NT50). Presented are the average (mean) NT50 from two independent experiments. The lines in the scatterplots indicate the median NT50, while the bars indicate the mean NT50. Identical plasma/serum samples are connected with lines in the bar graphs and the numbers in brackets indicate the average (mean) reduction in neutralization sensitivity for the S proteins of the respective SARS-CoV-2 variants. Statistical significance of differences between WT and variant S proteins was analyzed by paired, two-tailed Student’s t test (p > 0.05, not significant [ns]; p ≤ 0.05, *; p ≤ 0.01, **; p ≤ 0.001, ***).
Figure S3
Figure S3
Representative neutralization data, related to Figure 7 Pseudotypes bearing the indicated S proteins were incubated (30 min, 37°C) with different dilutions of plasma derived from COVID-19 patients (A) or serum from individuals vaccinated with the Pfizer/BioNTech vaccine BNT162b2 (obtained 13-15 days after the second dose) (B) and inoculated onto Vero target cells. Transduction efficiency was quantified by measuring virus-encoded luciferase activity in cell lysates at 16-20 h posttransduction. Presented are the data from a single representative experiment conducted with technical triplicates (results were confirmed in a separate biological replicate). For normalization, inhibition of S protein-driven entry in samples without plasma/serum was set as 0%. Error bars indicate the SD. The data were further used to calculated the plasma/serum dilution that leads to 50% reduction in S protein-driven cell entry (neutralizing titer, NT50, shown in Figure 7). Of note, serum BNT-10 was excluded from further analysis, as its extraordinary high neutralizing activity precluded a reliable NT50 determination.

References

    1. Baden L.R., El Sahly H.M., Essink B., Kotloff K., Frey S., Novak R., Diemert D., Spector S.A., Rouphael N., Creech C.B., et al. COVE Study Group Efficacy and Safety of the mRNA-1273 SARS-CoV-2 Vaccine. N. Engl. J. Med. 2021;384:403–416. - PMC - PubMed
    1. Bartosch B., Dubuisson J., Cosset F.L. Infectious hepatitis C virus pseudo-particles containing functional E1-E2 envelope protein complexes. J. Exp. Med. 2003;197:633–642. - PMC - PubMed
    1. Baum A., Ajithdoss D., Copin R., Zhou A., Lanza K., Negron N., Ni M., Wei Y., Mohammadi K., Musser B., et al. REGN-COV2 antibodies prevent and treat SARS-CoV-2 infection in rhesus macaques and hamsters. Science. 2020;370:1110–1115. - PMC - PubMed
    1. Baum A., Fulton B.O., Wloga E., Copin R., Pascal K.E., Russo V., Giordano S., Lanza K., Negron N., Ni M., et al. Antibody cocktail to SARS-CoV-2 spike protein prevents rapid mutational escape seen with individual antibodies. Science. 2020;369:1014–1018. - PMC - PubMed
    1. Berger Rentsch M., Zimmer G. A vesicular stomatitis virus replicon-based bioassay for the rapid and sensitive determination of multi-species type I interferon. PLoS ONE. 2011;6:e25858. - PMC - PubMed

Publication types

MeSH terms