Review
. 2021 Jul 15:235:118017.
doi: 10.1016/j.neuroimage.2021.118017. Epub 2021 Mar 29.

Combining brain perturbation and neuroimaging in non-human primates

Affiliations
Review

Combining brain perturbation and neuroimaging in non-human primates

P Christiaan Klink et al. Neuroimage. .

Abstract

Brain perturbation studies allow detailed causal inferences of behavioral and neural processes. Because the combination of brain perturbation methods and neural measurement techniques is inherently challenging, research in humans has predominantly focused on non-invasive, indirect brain perturbations, or neurological lesion studies. Non-human primates have been indispensable as a neurobiological system that is highly similar to humans while simultaneously being more experimentally tractable, allowing visualization of the functional and structural impact of systematic brain perturbation. This review considers the state of the art in non-human primate brain perturbation with a focus on approaches that can be combined with neuroimaging. We consider both non-reversible (lesions) and reversible or temporary perturbations such as electrical, pharmacological, optical, optogenetic, chemogenetic, pathway-selective, and ultrasound based interference methods. Method-specific considerations from the research and development community are offered to facilitate research in this field and support further innovations. We conclude by identifying novel avenues for further research and innovation and by highlighting the clinical translational potential of the methods.

Keywords: Causality; Chemogenetics; Infrared; Lesion; Microstimulation; Optogenetics; Primates; Ultrasound; fMRI.


Conflict of interest statement

Declaration of Competing Interest The authors declare no competing financial interests.

Figures

Figure 1.
Figure 1.. Schematic overview of the specificity of brain perturbation techniques used with neuroimaging in non-human primates.
Different brain perturbation techniques operate on different spatial and temporal scales. Temporal scale is depicted on the horizontal axis (logarithmic; open ended). The range of temporal scales varies across techniques from subsecond time-scales to periods of months, or even years. The spatial scale of the perturbation methods is shown logarithmically on the vertical axis and ranges from tissue volumes smaller than a mm3 to having systemic effects. The spatial and temporal scales of individual methods are indicated with differently colored rectangles. Line styles indicate cellular specificity, with some techniques selectively perturbing brain activity in certain cell types and others lacking any cellular specificity. Note that pathway specific methods can add connectivity specificity to compatible perturbation techniques that have previously generally lacked such precision (see 9. Directional and pathway-selective approaches). Depiction style inspired by (Grinvald and Hildesheim, 2004) and (Sejnowski et al., 2014).
Figure 2.
Figure 2.. Permanent lesions and fMRI.
A) In the preparation phase of an experiment, a pre-lesion scan (e.g. structural MRI, functional MRI, PET) is acquired. A lesion is then made in a specific area of the brain, e.g. by cutting a fiber bundle or injecting an excitotoxin such as NMDA. In the subsequent phase of the experiment further scans are acquired and lesioned animals are compared with control animals without a lesion and with their own pre-lesion scan. This comparison can be performed at different time-points (t1, t2, t3, etc) to investigate dynamic adaptive and maladaptive plasticity over weeks and months following the lesion. B) Anatomical regions from the LV-FOA-PHT composite cytoarchitectonic parcellation (Van Essen et al., 2012), as used in C) Whole-brain seed-to-voxel connectivity maps for an example seed in the right hemisphere orbitofrontal area 12 (ROI: 12o). Maps show changes in functional connectivity (correlation strength) after bilateral fornix transections (shown schematically for one hemisphere in the bottom right inset). Adapted from (Pelekanos et al., 2020).
Figure 3.
Figure 3.. Reversible pharmacological lesions and neuroimaging.
A) Schematic of the technique. A cannula is implanted before the neuroimaging stage of the experiment so that pharmacological agents such as muscimol or THIP can be administered while the animal is in the scanner. B) Coronal sections (T1-weighted) showing examples of (4 μl) muscimol injection into the lateral intraparietal area LIP (left) and THIP injection into the dorsal pulvinar (right), together with a Gd contrast agent (1:100) (L/R: left/right; V/D: ventral/dorsal; LPul: lateral pulvinar; MPul: medial pulvinar; IPul: inferior pulvinar; bsc: the brachium of the superior colliculus). Adapted from (Wilke et al., 2013, 2012). C) Reversible inactivation of the dorsal pulvinar leads to a bilateral decrease of the contralesional cue-evoked activity, particularly in area TPO in the superior temporal sulcus (STS) (Melanie Wilke et al., 2010). D) Reversible inactivation of the superior colliculus leads to a decrease in the attentional modulation of activity that is strongest in the fundus of the STS (fSTS) of the inactivated hemisphere. Adapted from (Bogadhi et al., 2019).
Figure 4.
Figure 4.. Electrical stimulation and neuroimaging.
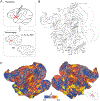
A) Schematic of the technique. To prepare for neuroimaging experiments, the animal is implanted with a chronic electrode or (as depicted) a recording/stimulation chamber for acute electrode penetrations. During imaging, electrical stimulation is delivered through an implanted electrode or one that is guided each session through a localization grid to the desired depth. B) Microstimulation-evoked activation patterns overlaid on the inflated right hemisphere (outlines of the face patches in green). The medial view reveals activation of cingulate cortex and adjacent somatosensory and supplementary motor areas. Adapted from (Moeller et al., 2008). C) Significant activation maps arising from two stimulation sites in the left amygdala are shown on an inflated mid-cortical surface (uncorrected level, p < 0.001; cluster correction, 4). A site in the basal nucleus (top) activated the ipsilateral frontal, insular, temporal, and occipital cortex; all regions to which the basal nucleus is known to project. As many of these areas send no reciprocal projection to the basal nucleus (or to the amygdala at all), these activations most likely reflect orthodromic propagation from the amygdala. Several of these regions were also activated contralateral to the stimulation. Stimulation at a site in the lateral nucleus (bottom) generated activity largely confined to the ipsilateral temporal pole and rostral auditory areas; regions that are reciprocally connected to the lateral nucleus. There was no activation in several regions that provide nonreciprocal input to the lateral nucleus, suggesting that antidromic activation was weak or absent. D) Frequency-specific MRI responses evoked by VTA stimulation. T-score maps of the stimulation frequency versus baseline (uncorrected level, p < 0.001; cluster correction, 20) overlaid onto cortical flatmaps in the D99 template space. Regions showing significant activation are indicated on the maps. Adapted from (Murris et al., 2020). (as: arcuate sulcus; cas: calcarine sulcus, cgs: cingulate sulcus, cs: central sulcus; ios: inferior occipital sulcus; ips: intraparietal sulcus; lus: lunate sulcus; ots: occipitotemporal sulcus, ps: principal sulcus; sf: Sylvan fissure; sts: superior temporal sulcus).
Figure 5.
Figure 5.. Comparison of es-fMRI in macaques and humans.
A) Auditory cortex (AC) stimulation sites in one of the monkeys (inset). Es-fMRI group results from two animals show significantly activated voxels projected to the surface of a standard macaque template brain. B) Human es-fMRI of auditory cortex: Heschl’s gyrus on the superior aspects of the temporal lobe (inset). Human group results. Abbreviations: auditory cortex (AC), prefrontal cortex (PFC) and medial temporal lobe (MTL). Adapted from (Rocchi et al., 2021).
Figure 6.
Figure 6.. A comparison of brain-perturbation based connectivity and anatomical tractography.
A) Es-fMRI effects and retrograde tracer injections in a macaque face patch within the same animal displayed on flat-maps of the right hemisphere. The left panel shows face patches (yellow) and density of labeled cells following injection of a retrograde tracer in face patch AL (blue). Note that clusters of remote, retrogradely labeled neurons were localized within four of the six face patches (ML, MF, AF, AM). The right panel shows brain regions activated by microstimulation of face patch AL. Remote activity was found in the same four face patches as revealed by tracer injection (ML, MF, AF, AM). Green outlines indicate face patches. Left panel: adapted from Grimaldi et al. (2016); right panel: adapted from Moeller et al. (2008). B) Injections of tracer in the macaque frontal eye fields (FEF) result in labeled cells in the lateral intraparietal area (LIP), the medial superior temporal area (MST) and the superior temporal polysensory area (STP) (Top; (Schall et al., 1995). FEF microstimulation evokes fMRI activations in LIP, MST and STP (Ekstrom et al., 2008). Monkey optoMRI with ChR2-transduced neurons in FEF also evokes fMRI signals in LIP, MST and STP (Gerits et al., 2012). Adapted from (Gerits and Vanduffel, 2013).
Figure 7.
Figure 7.. Optogenetic stimulation and neuroimaging.
A) Schematic of the technique. Animals are typically implanted with a recording allowing the injection of a viral vector construct in a restricted part of the brain. In the neuroimaging experiment, areas that express the construct will be illuminated with light of a specific wavelength using either an optic fiber implanted into the brain or an LED light shining directly onto the brain surface. B) Activity induced by optical stimulation of FEF/F5 in the arcuate sulcus (T-score, p < 0.001, uncorrected). Control panels represent fMRI data after optogenetic stimulation of non-transduced sites nearby. Reproducible activations from different sessions were found in the visual cortex of monkey M1 (red arrow = area V4; green arrow = peripheral area V1; blue arrow = MSTv; yellow arrow = MSTd). Adapted from (Gerits et al., 2012). C) fMRI activity close to the optrode tip during electrical (left), optical (right) and combined electrical and optical (middle) stimulation of FEF. Adapted from (Ohayon et al., 2013). D) Coherence of BOLD activity (left) evoked by pulsed epidural optical stimulation of V1 (blue shaded areas) with a large-volume LED illuminator (left, inset) placed on top of the dura mater. The BOLD signal is highly coherent with the on/off switching of the LED light in V1 and visual areas to which it projects (Ortiz-Rios et al., 2018).
Figure 8.
Figure 8.. Ultrasound stimulation and neuroimaging.
A) Schematic of the technique. Prior to neuroimaging, ultrasound stimulation is applied with an external transducer either with the systemic injection of microbubbles (for blood-brain-barrier opening) or without (for neuromodulation). B) Neural and behavioral results of FUS targeted at the Anterior Cingulate Cortex (ACC). The top row shows coupling of activity between the ACC and the rest of the brain for controls (Sham stimulation) on the left, and for ACC FUS on the right. The ‘connectivity fingerprint’ (middle) that can be extracted from these coupling patterns demonstrated clear effects of ACC FUS (blue: controls; red: ACC FUS). Adapted from (Folloni et al., 2019). The bottom row shows behavioral effects of ACC FUS in a counterfactual decision task where animals chose between two presented stimuli, out of three possible stimuli (Op1–3; orange, dark green, light green) to obtain rewards. The reward probabilities associated with three stimuli varied over the timespan of an experimental session (middle). Without ACC FUS (left) decision frequencies for each option over time closely resemble the distribution of reward probabilities. ACC FUS disrupts this relationship suggesting a role for the ACC in translating internally tracked values into behavior. Adapted from (Fouragnan et al., 2019). C) Contrast-enhanced (gadodiamide) MRI of blood-brain barrier (BBB) opening in the putamen using FUS with systemic microbubble injection. Blue oval indicates the planned target region. Red and orange voxels indicate actual BBB opening. D) Behavioral result of FUS sonication-induced BBB opening in the putamen. Thresholds (75% correct) from a coherent motion detection task are significantly lower after sonication. Small black dots are individual sessions, large colored dots are mean thresholds across sessions. C) and D) adapted from (Downs et al., 2017).
Figure 9.
Figure 9.. Infrared Neural Stimulation (INS) and neuroimaging.
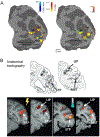
A) Schematic of the technique. After implantation of a recording chamber, optic fibers are used to focally stimulate the brain with pulsed infrared light. B) Cortical stimulation in V1 via an optic fiber that is inserted through a grid in a recording chamber produces focal activation at the fiber tip (inset, green) as well as a nearby spot of cortex close to the fiber tip (inset, red), consistent with optical imaging findings (Cayce et al 2014b). Other activated sites in the visual cortex are depicted with blue and orange dots. C) Subcortical stimulation in the basal nucleus of the amygdala (left, yellow dots) evokes focal activations in the sensory insula (lg, ld), auditory (R), and somatosensory (SII, in adjacent slice) cortices. Adapted from (Shi et al., 2021). D) Feedforward vs feedback connections. Top: Stimulation of a single digit site in squirrel monkey somatosensory cortex (SI) with the fiber tip in Area 2. Feedforward (FF) effects are found as middle layer activations in M1 and 3a. Bilaminar feedback (FB) activations are seen in 3b, and 1. (LS: lateral sulcus, D: dorsal, P: posterior). Adapted from (Xu et al., 2019).

References

    1. Acker L, Pino EN, Boyden ES, Desimone R, 2016. FEF inactivation with improved optogenetic methods. PNAS 113, E7297–E7306. https://doi.org/10/f9fxqr - PMC - PubMed
    1. Acker LC, Pino EN, Boyden ES, Desimone R, 2017. Large Volume, Behaviorally-relevant Illumination for Optogenetics in Non-human Primates. J Vis Exp https://doi.org/10/gg3qpd - PMC - PubMed
    1. Adam R, Johnston K, Everling S, 2019. Recovery of contralesional saccade choice and reaction time deficits after a unilateral endothelin-1-induced lesion in the macaque caudal prefrontal cortex. Journal of Neurophysiology 122, 672–690. https://doi.org/10/gg3c57 - PubMed
    1. Adam R, Johnston K, Menon RS, Everling S, 2020. Functional reorganization during the recovery of contralesional target selection deficits after prefrontal cortex lesions in macaque monkeys. NeuroImage 207, 116339. https://doi.org/10/gg3c6r - PubMed
    1. Agustín-Pavón C, Braesicke K, Shiba Y, Santangelo AM, Mikheenko Y, Cockroft G, Asma F, Clarke H, Man M-S, Roberts AC, 2012. Lesions of ventrolateral prefrontal or anterior orbitofrontal cortex in primates heighten negative emotion. Biol. Psychiatry 72, 266–272. https://doi.org/10/f37gj2 - PubMed

Publication types