

Cost-effectiveness modelling to optimise active screening strategy for gambiense human African trypanosomiasis in endemic areas of the Democratic Republic of Congo
- PMID: 33794881
- PMCID: PMC8017623
- DOI: 10.1186/s12916-021-01943-4
Cost-effectiveness modelling to optimise active screening strategy for gambiense human African trypanosomiasis in endemic areas of the Democratic Republic of Congo
Abstract
Background: Gambiense human African trypanosomiasis (gHAT) has been brought under control recently with village-based active screening playing a major role in case reduction. In the approach to elimination, we investigate how to optimise active screening in villages in the Democratic Republic of Congo, such that the expenses of screening programmes can be efficiently allocated whilst continuing to avert morbidity and mortality.
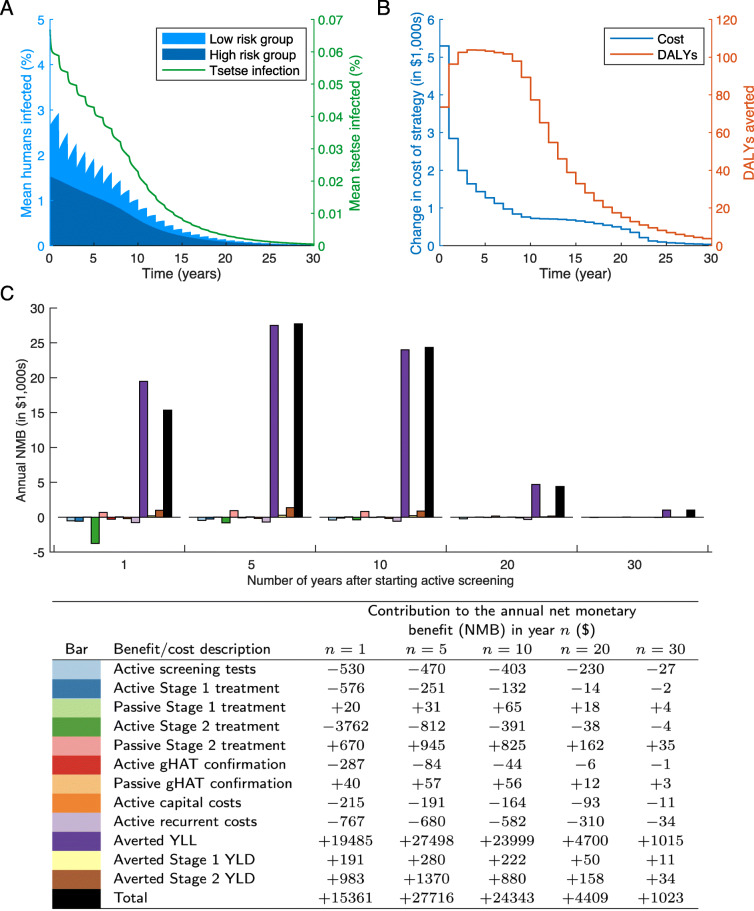
Methods: We implement a cost-effectiveness analysis using a stochastic gHAT infection model for a range of active screening strategies and, in conjunction with a cost model, we calculate the net monetary benefit (NMB) of each strategy. We focus on the high-endemicity health zone of Kwamouth in the Democratic Republic of Congo.
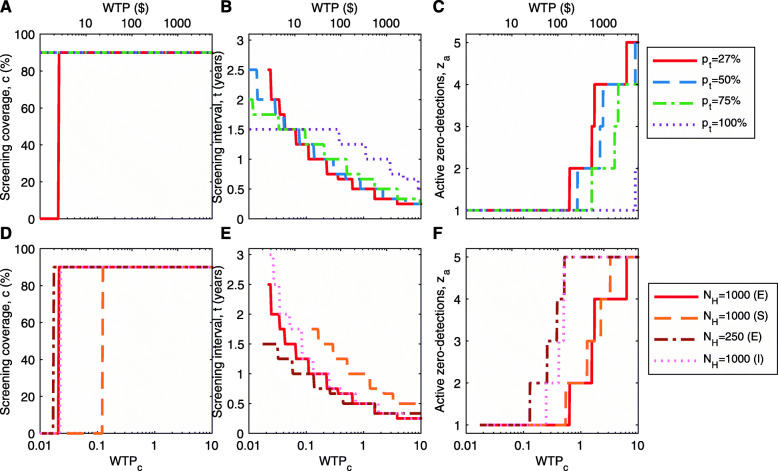
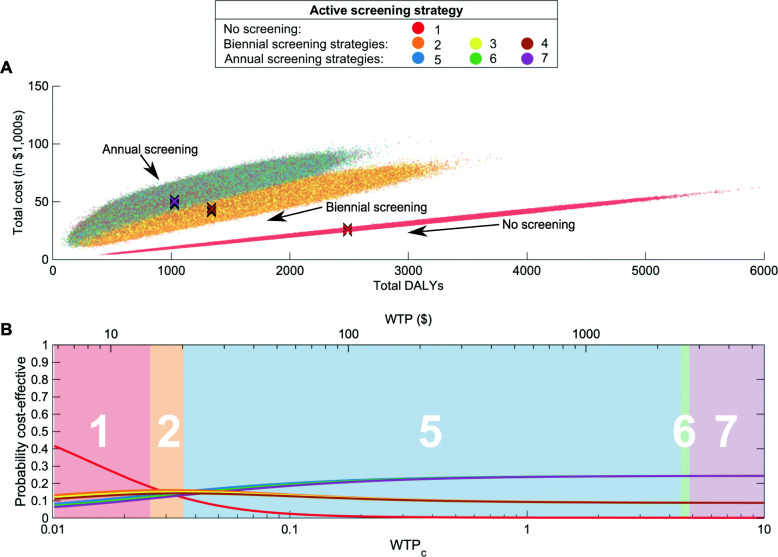
Results: High-coverage active screening strategies, occurring approximately annually, attain the highest NMB. For realistic screening at 55% coverage, annual screening is cost-effective at very low willingness-to-pay thresholds (<DOLLAR/>20.4 per disability adjusted life year (DALY) averted), only marginally higher than biennial screening (<DOLLAR/>14.6 per DALY averted). We find that, for strategies stopping after 1, 2 or 3 years of zero case reporting, the expected cost-benefits are very similar.
Conclusions: We highlight the current recommended strategy-annual screening with three years of zero case reporting before stopping active screening-is likely cost-effective, in addition to providing valuable information on whether transmission has been interrupted.
Keywords: African sleeping sickness; African trypanosomiasis; Cost-effectiveness; Mathematical model.
Conflict of interest statement
The authors declare that they have no competing interests.
Figures

Similar articles
-
Cost-effectiveness of sleeping sickness elimination campaigns in five settings of the Democratic Republic of Congo.Nat Commun. 2022 Feb 25;13(1):1051. doi: 10.1038/s41467-022-28598-w. Nat Commun. 2022. PMID: 35217656 Free PMC article.
-
Screening Strategies for a Sustainable Endpoint for Gambiense Sleeping Sickness.J Infect Dis. 2020 Jun 11;221(Suppl 5):S539-S545. doi: 10.1093/infdis/jiz588. J Infect Dis. 2020. PMID: 31876949 Free PMC article.
-
Identifying regions for enhanced control of gambiense sleeping sickness in the Democratic Republic of Congo.Nat Commun. 2022 Mar 18;13(1):1448. doi: 10.1038/s41467-022-29192-w. Nat Commun. 2022. PMID: 35304479 Free PMC article.
-
Priorities for the elimination of sleeping sickness.Adv Parasitol. 2012;79:299-337. doi: 10.1016/B978-0-12-398457-9.00004-4. Adv Parasitol. 2012. PMID: 22726645 Review.
-
How can molecular diagnostics contribute to the elimination of human African trypanosomiasis?Expert Rev Mol Diagn. 2015 May;15(5):607-15. doi: 10.1586/14737159.2015.1027195. Epub 2015 Mar 18. Expert Rev Mol Diagn. 2015. PMID: 25786994 Review.
Cited by
-
Modelling to Quantify the Likelihood that Local Elimination of Transmission has Occurred Using Routine Gambiense Human African Trypanosomiasis Surveillance Data.Clin Infect Dis. 2021 Jun 14;72(Suppl 3):S146-S151. doi: 10.1093/cid/ciab190. Clin Infect Dis. 2021. PMID: 33905480 Free PMC article.
-
A modelling analysis of a new multi-stage pathway for classifying achievement of public health milestones for leprosy.Philos Trans R Soc Lond B Biol Sci. 2023 Oct 9;378(1887):20220408. doi: 10.1098/rstb.2022.0408. Epub 2023 Aug 21. Philos Trans R Soc Lond B Biol Sci. 2023. PMID: 37598707 Free PMC article.
-
Modelling timelines to elimination of sleeping sickness in the Democratic Republic of Congo, accounting for possible cryptic human and animal transmission.Parasit Vectors. 2024 Aug 9;17(1):332. doi: 10.1186/s13071-024-06404-4. Parasit Vectors. 2024. PMID: 39123265 Free PMC article.
-
Health economic evaluation of strategies to eliminate gambiense human African trypanosomiasis in the Mandoul disease focus of Chad.PLoS Negl Trop Dis. 2023 Jul 27;17(7):e0011396. doi: 10.1371/journal.pntd.0011396. eCollection 2023 Jul. PLoS Negl Trop Dis. 2023. PMID: 37498938 Free PMC article.
-
Modelling gambiense human African trypanosomiasis infection in villages of the Democratic Republic of Congo using Kolmogorov forward equations.J R Soc Interface. 2021 Oct;18(183):20210419. doi: 10.1098/rsif.2021.0419. Epub 2021 Oct 6. J R Soc Interface. 2021. PMID: 34610258 Free PMC article.
References
-
- World Health Organization. WHO Global Health Observatory. https://www.who.int/data/gho. Accessed 17 Nov 2020.
-
- Institute for Health Metrics and Evaluation (IHME) GBD Compare Data Visualization. Seattle, WA: IHME, University of Washington; 2020.
-
- World Health Organization Control and surveillance of human African trypanosomiasis. World Health Organ Tech Rep Ser. 2013;(984):1–237. - PubMed
Publication types
MeSH terms
LinkOut - more resources
Full Text Sources
Other Literature Sources
