

The largest meta-analysis on the global prevalence of microsporidia in mammals, avian and water provides insights into the epidemic features of these ubiquitous pathogens
- PMID: 33794979
- PMCID: PMC8017775
- DOI: 10.1186/s13071-021-04700-x
The largest meta-analysis on the global prevalence of microsporidia in mammals, avian and water provides insights into the epidemic features of these ubiquitous pathogens
Abstract
Background: Microsporidia are obligate intracellular parasites that can infect nearly all invertebrates and vertebrates, posing a threat to public health and causing large economic losses to animal industries such as those of honeybees, silkworms and shrimp. However, the global epidemiology of these pathogens is far from illuminated.
Methods: Publications on microsporidian infections were obtained from PubMed, Science Direct and Web of Science and filtered according to the Newcastle-Ottawa Quality Assessment Scale. Infection data about pathogens, hosts, geography and sampling dates were manually retrieved from the publications and screened for high quality. Prevalence rates and risk factors for different pathogens and hosts were analyzed by conducting a meta-analysis. The geographic distribution and seasonal prevalence of microsporidian infections were drawn and summarized according to sampling locations and date, respectively.
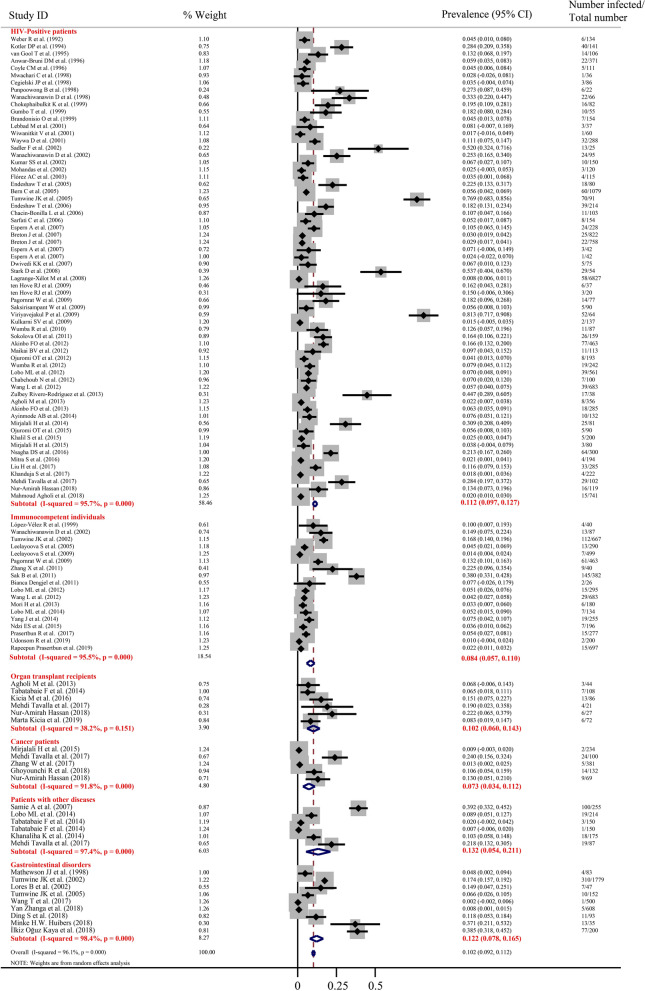
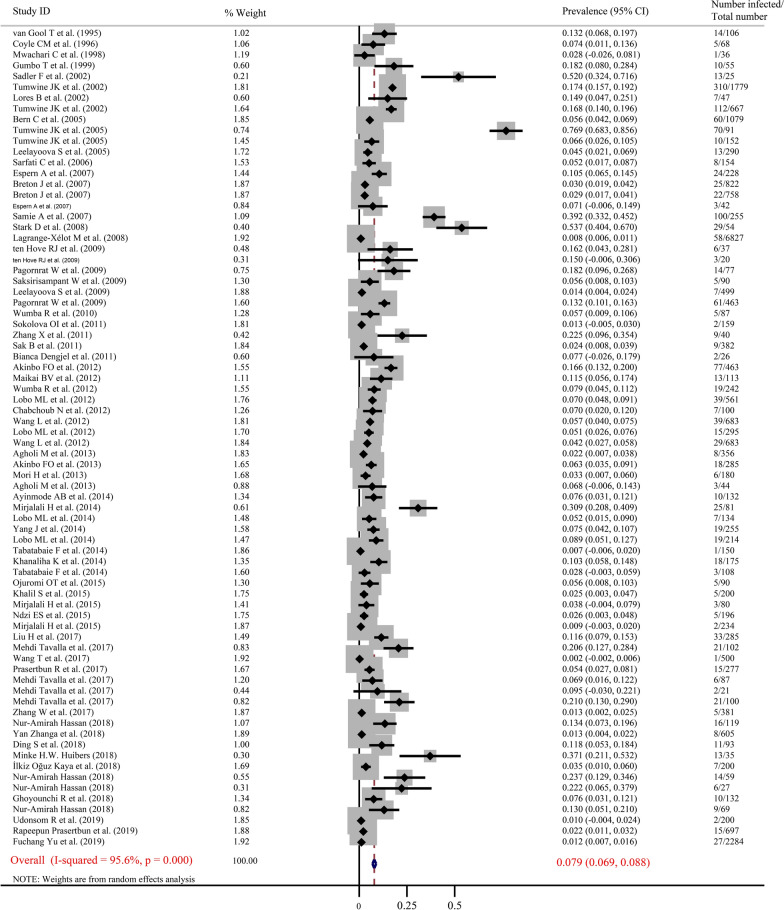
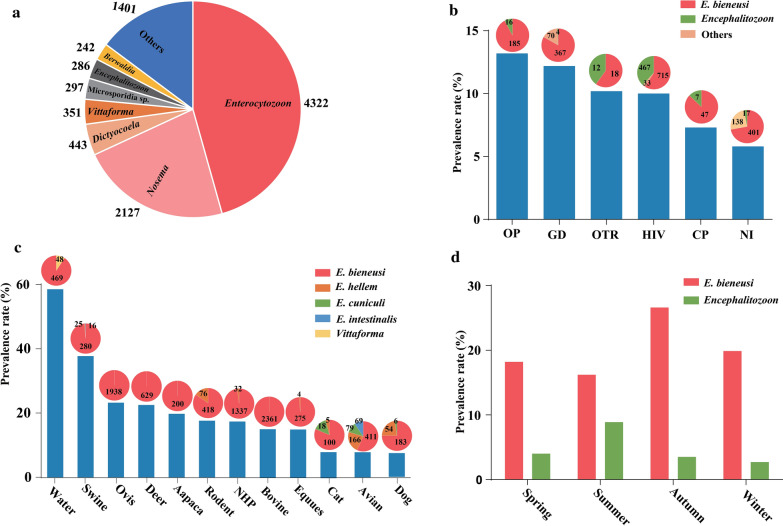
Results: Altogether, 287 out of 4129 publications up to 31 January 2020 were obtained and met the requirements, from which 385 epidemiological data records were retrieved and effective. The overall prevalence rates in humans, pigs, dogs, cats, cattle, sheep, nonhuman primates and fowl were 10.2% [2429/30,354; 95% confidence interval (CI) 9.2-11.2%], 39.3% (2709/5105; 95% CI 28.5-50.1%), 8.8% (228/2890; 95% CI 5.1-10.1%), 8.1% (112/1226; 95% CI 5.5-10.8%), 16.6% (2216/12,175; 95% CI 13.5-19.8%), 24.9% (1142/5967; 95% CI 18.6-31.1%), 18.5% (1388/7009; 95% CI 13.1-23.8%) and 7.8% (725/9243; 95% CI 6.4-9.2%), respectively. The higher prevalence in pigs suggests that routine detection of microsporidia in animals should be given more attention, considering their potential roles in zoonotic disease. The highest rate was detected in water, 58.5% (869/1351; 95% CI 41.6-75.5%), indicating that water is an important source of infections. Univariate regression analysis showed that CD4+ T cell counts and the living environment are significant risk factors for humans and nonhuman primates, respectively. Geographically, microsporidia have been widely found in 92 countries, among which Northern Europe and South Africa have the highest prevalence. In terms of seasonality, the most prevalent taxa, Enterocytozoon bieneusi and Encephalitozoon, display different prevalence trends, but no significant difference between seasons was observed. In addition to having a high prevalence, microsporidia are extremely divergent because 728 genotypes have been identified in 7 species. Although less investigated, microsporidia coinfections are more common with human immunodeficiency virus and Cryptosporidium than with other pathogens.
Conclusions: This study provides the largest-scale meta-analysis to date on microsporidia prevalence in mammals, birds and water worldwide. The results suggest that microsporidia are highly divergent, widespread and prevalent in some animals and water and should be further investigated to better understand their epidemic features.
Keywords: Epidemiology; Global prevalence; Meta-analysis; Microsporidia; Microsporidiosis.
Conflict of interest statement
The authors declare that they have no competing interests.
Figures


References
-
- Vávra J, Ronny Larsson JI. Structure of microsporidia. In: Weiss LM, Becnel JJ, editors. Microsporidia: pathogens of opportunity. New York: Academic; 2014. pp. 1–70.
-
- Fayer R, Santin-Duran M. Epidemiology of microsporidia in human infections. In: Weiss LM, Becnel JJ, editors. Microsporidia: pathogens of opportunity. New York: Academic; 2014. pp. 135–164.
Publication types
MeSH terms
Substances
Grants and funding
LinkOut - more resources
Full Text Sources
Other Literature Sources
Medical
Research Materials
Miscellaneous
