. 2021 Apr 1;9(1):57.
doi: 10.1186/s40478-021-01158-x.

Neuropathological and behavioral characterization of aged Grn R493X progranulin-deficient frontotemporal dementia knockin mice

Affiliations

Neuropathological and behavioral characterization of aged Grn R493X progranulin-deficient frontotemporal dementia knockin mice

Jonathan Frew et al. Acta Neuropathol Commun. .

Abstract

Frontotemporal lobar degeneration (FTLD) causes a spectrum of clinical presentations of frontotemporal dementia (FTD), including progressive changes in behavior, personality, executive function, and language. Up to 20% of familial FTLD cases are caused by progranulin (GRN) haploinsufficiency (FTD-GRN), with one of the most common causal variant being a nonsense mutation at arginine 493 (R493X). Recently, a genetic knockin FTD-GRN mouse model was generated bearing this GrnR493X mutation, at the analogous arginine in murine Grn. Aged, homozygous GrnR493X mice (GrnR493X/R493X) have been shown to phenotypically replicate several neuropathological hallmarks previously demonstrated in Grn null mice. We conducted a comprehensive neuropathological and behavioral assessment of 18 month old GrnR493X/R493X mice, observing a striking lysosomal dysfunction and thalamic neurodegeneration not previously described in this model, as well as a male-specific increase in generalized anxiety. These findings provide additional phenotypic markers of pathogenesis in aged GrnR493X/R493X mice that will contribute to better defining mechanisms underlying FTD-GRN, and offer relevant outcome measures for preclinical efficacy testing of novel therapeutics that target nonsense mutations leading to this devastating disease.

Keywords: Astrogliosis; Frontotemporal dementia; Lysosomal dysfunction; Microgliosis; Mouse model; Neurodegeneration; Open field; Progranulin; R493X; TDP-43.


Conflict of interest statement

H.B.N. has received royalties as an independent consultant for Biogen and Roche Canada.

Figures

Fig. 1
Fig. 1
Pgrn expression in the CNS of aged GrnR493X/R493X mice. 18 month old Grn+/+ and GrnR493X/R493X hemibrain RIPA-soluble lysate samples were subjected to both Pgrn western blot (a) and Pgrn ELISA (b). Densitometric quantification of Pgrn western blot signal was normalized to actin loading control. c, Pgrn expression was also detected in the hippocampal CA3 and thalamic VPM/VPL regions by immunofluorescence staining of 18 month old Grn+/+ and GrnR493X/R493X brain sections (scale bar, 20 µm). d, Total Pgrn  positive area in CA3 (i) and VPM/VPL (ii) was quantified and normalized to the total number of cells (DAPI, blue). For western blot/ELISA n = 6 mice were used per sex/genotype; for immunofluorescence staining n = 10 mice were used per sex/genotype (except male GrnR493X/R493X n = 8); values are shown as mean ± SEM; ***p < 0.0001, Student’s t-test
Fig. 2
Fig. 2
Lysosomal dysfunction in the ventral thalamus and CA3 hippocampal region of aged GrnR493X/R493X mice. Representative hippocampal/thalamic tilescans highlighting autofluorescent lipofuscin (a, green channel), Lamp1 (b), and DppII (c) accumulation in 18 month old GrnR493X/R493X mice (scale bar, 500 µm). d, e Representative Lamp1 and DppII immunofluorescence images of hippocampal CA3 and thalamic VPM/VPL regions in 18 month old Grn+/+ and GrnR493X/R493X brain sections (scale bar, 20 µm). f, g Total Lamp1-positive and DppII-positive area in CA3 (i) and VPM/VPL (ii) images were quantified and normalized to the total number of cells (DAPI, blue). For immunofluorescence staining n = 10 mice were used per sex/genotype (except male GrnR493X/R493X n = 8); values are shown as mean ± SEM; **p < 0.01, ***p < 0.0001, Student’s t-test
Fig. 3
Fig. 3
Global dysregulation of lysosomal function in aged GrnR493X/R493X brain. Representative western blots of hemibrain RIPA-soluble lysates from 18 month old Grn+/+ and GrnR493X/R493X mice probed with the indicated antibodies (a). Expression of Lamp1, total/pro/mat-Ctsd, and LC3I/II in Grn+/+ and GrnR493X/R493X hemibrain lysates was analyzed by western blotting, using actin as the loading control. Densitometric quantification of brain-wide Lamp1 (b) and Ctsd (c) expression was normalized to actin and Grn+/+ levels. The LC3 II:LC3 I densitometric expression ratio (d) was normalized to Grn+/+ levels. n = 6 mice were used per sex/genotype; values are shown as mean ± SEM; ns = not significant, **p < 0.01, ***p < 0.0001, Student’s t-test
Fig. 4
Fig. 4
Neuronal TDP-43 proteinopathy is localized to the ventral thalamus of aged GrnR493X/R493X mice. Representative western blots of hemibrain RIPA-soluble and -insoluble lysates from 18 month old Grn+/+ and GrnR493X/R493X mice probed for TDP-43 expression. a Expression of full-length TDP-43 in Grn+/+ and GrnR493X/R493X hemibrains in soluble and insoluble lysates was analyzed by western blotting, using RIPA-soluble actin as the loading control (no actin detected in insoluble urea fraction). Arrows indicate TDP-43 CTFs, and the * demarks a remnant TDP-43 signal observed upon reprobing stripped RIPA-soluble TDP-43 blot with actin antibody. Densitometric quantification of brain-wide full-length TDP-43 expression in soluble (b) and insoluble (c) lysate fractions were normalized to RIPA-soluble actin and Grn+/+ levels. d Representative hippocampal/thalamic tilescans highlighting the neuronal (TUJ1, green) TDP-43 (red) proteinopathy phenotype in the ventral thalamus of 18 month old GrnR493X/R493X mice (scale bar, 500 µm). e High magnification images from the thalamic VPM/VPL regions demonstrating neuronal cytoplasmic accumulation of TDP-43 in 18 month old GrnR493X/R493X mice (DAPI, blue; scale bar, 10 µm). For western analysis n = 6 mice were used per sex/genotype; values are shown as mean ± SEM; ns = not significant, **p < 0.01, Student’s t-test
Fig. 5
Fig. 5
Neuroinflammation in the ventral thalamus of aged GrnR493X/R493X mice. a Representative hippocampal/thalamic tilescans co-stained for Iba1/Pgrn show severe microgliosis in the brain of 18 month old GrnR493X/R493X mice (scale bar, 500 µm). b Representative Iba1/Pgrn co-stained immunofluorescence images of hippocampal CA3 and thalamic VPM/VPL regions in 18 month old Grn+/+ and GrnR493X/R493X brain sections (scale bar, 20 µm). c Quantification of microglial density (i-ii) and branching morphology (iii-iv) in the CA3 and thalamic VPM/VPL regions. d, Microglial Pgrn fluorescence intensity in the CA3 (i) and VPM/VPL (ii). ef, Representative images and quantification of C1qa staining in the VPM/VPL. n = 10 mice were used per sex/genotype (except male GrnR493X/R493X n = 8 and male Grn+/+ Iba1-Pgrn staining of VPM/VPL n = 9); values are shown as mean ± SEM; ns not significant, *p < 0.05, ***p < 0.0001 was determined by Student’s t-test
Fig. 6
Fig. 6
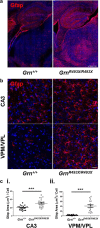
Severe astrogliosis in the ventral thalamus and CA3 hippocampal region of aged GrnR493X/R493X mice. a Representative hippocampal/thalamic tilescans stained for Gfap show severe astrogliosis in 18 month old Grn+/+ and GrnR493X/R493X brain (scale bar, 500 µm). b Representative Gfap immunofluorescence images of hippocampal CA3 and thalamic VPM/VPL regions in 18 month old Grn+/+ and GrnR493X/R493X brain sections (scale bar, 20 µm). c Total Gfap-positive area in CA3 (i) and VPM/VPL (ii) images were quantified and normalized to the total number of cells (DAPI, blue). n = 10 mice were used per sex/genotype (except male GrnR493X/R493X n = 8); values are shown as mean ± SEM; ns = not significant, *p < 0.05, ***p < 0.0001, Student’s t-test
Fig. 7
Fig. 7
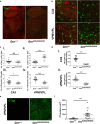
Inhibitory synaptic density is preserved in the thalamus of aged GrnR493X/R493X mice. a, b Representative hippocampal/thalamic tilescans co-stained for C1qa and Vgat in 18 month old Grn+/+ and GrnR493X/R493X mice, the dashed outline depicts area quantified in (c) (scale bar, 500 µm). A’, B’, C1qa-Vgat tilescan inset immunofluorescence images (from a, b) of thalamic VPM/VPL region in 18 month old Grn+/+ and GrnR493X/R493X brain sections (scale bar, 20 µm). c Quantification of thalamic Vgat-positive synaptic area within hippocampal/thalamic tilescans normalized to thalamic area (white dashed outline). Vgat-positive area (d), the number of Vgat-positive synaptic puncta (e), and the proportion of Vgat-positive  synaptic area that is positive for C1qa (f) was quantified in high-resolution C1qa-Vgat VPM/VPL images (a’, b’). n = 10 mice were used per sex/genotype (except male GrnR493X/R493X n = 8); values are shown as mean ± SEM; ns not significant, ***p < 0.0001, Student’s t-test
Fig. 8
Fig. 8
Neurodegeneration of thalamic Foxp2 + excitatory neurons in aged GrnR493X/R493X mice. a Representative hippocampal/thalamic tilescans from 18 month old Grn+/+ and GrnR493X/R493X mice brain sections stained for Foxp2, the dashed outline depicts area quantified in (b) (scale bar, 500 µm). b Quantification of total number of thalamic Foxp2-positive nuclei. n = 9 male Grn+/+ mice, n = 7 female Grn+/+ mice, n = 7 male GrnR493X/R493X, and n = 10 female GrnR493X/R493X mice were used; values are shown as mean ± SEM; ***p < 0.0001, Student’s t-test
Fig. 9
Fig. 9
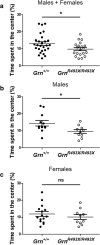
Aged male GrnR493X/R493X mice exhibit an increased anxiety phenotype. Proportion of time male/female (a), male (b), and female (c) Grn+/+ and GrnR493X/R493X mice spent inside the center region of an open-field arena over a 10 min trial. Male Grn+/+ n = 12, female Grn+/+ n = 15, male GrnR493X/R493X n = 10, and female GrnR493X/R493X n = 10; values are shown as mean ± SEM; ns = not significant, *p < 0.05, Student’s t-test

References

    1. Arai T, Hasegawa M, Akiyama H, Ikeda K, Nonaka T, Mori H, et al. TDP-43 is a component of ubiquitin-positive tau-negative inclusions in frontotemporal lobar degeneration and amyotrophic lateral sclerosis. Biochem Biophys Res Commun. 2006;351:602–611. doi: 10.1016/j.bbrc.2006.10.093. - DOI - PubMed
    1. Arrant AE, Filiano AJ, Unger DE, Young AH, Roberson ED. Restoring neuronal progranulin reverses deficits in a mouse model of frontotemporal dementia. Brain. 2017;140:1447–1465. doi: 10.1093/brain/awx060. - DOI - PMC - PubMed
    1. Arrant AE, Onyilo VC, Unger DE, Roberson ED. Progranulin gene therapy improves lysosomal dysfunction and microglial pathology associated with frontotemporal dementia and neuronal ceroid lipofuscinosis. J Neurosci. 2018;38:2341–2358. doi: 10.1523/JNEUROSCI.3081-17.2018. - DOI - PMC - PubMed
    1. Baker M, Mackenzie IR, Pickering-Brown SM, Gass J, Rademakers R, Lindholm C, et al. Mutations in progranulin cause tau-negative frontotemporal dementia linked to chromosome 17. Nature. 2006;442:916. doi: 10.1038/nature05016. - DOI - PubMed
    1. Beel S, Herdewyn S, Fazal R, De Decker M, Moisse M, Robberecht W, et al. Progranulin reduces insoluble TDP-43 levels, slows down axonal degeneration and prolongs survival in mutant TDP-43 mice. Mol Neurodegener. 2018;13:55. doi: 10.1186/s13024-018-0288-y. - DOI - PMC - PubMed

Publication types

LinkOut - more resources