. 2021 Sep 15;148(18):dev199208.
doi: 10.1242/dev.199208. Epub 2021 May 18.

Concerted morphogenesis of genital ridges and nephric ducts in the mouse captured through whole-embryo imaging

Affiliations

Concerted morphogenesis of genital ridges and nephric ducts in the mouse captured through whole-embryo imaging

Corey Bunce et al. Development. .

Abstract

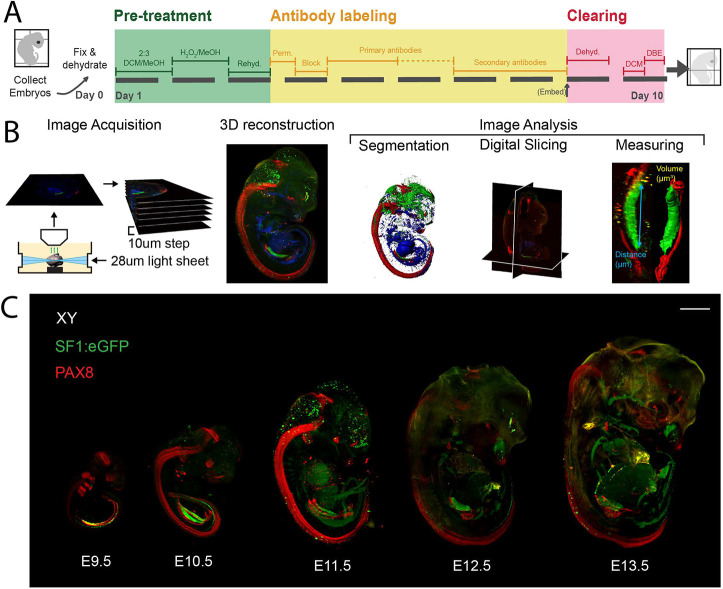
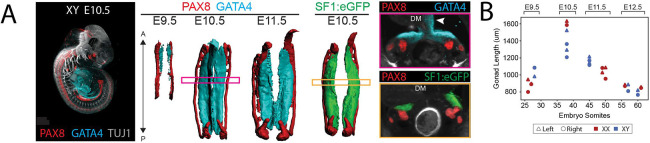
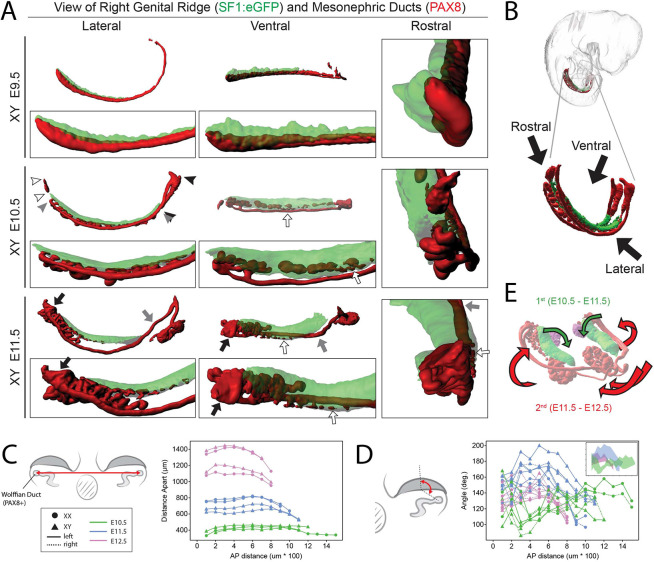
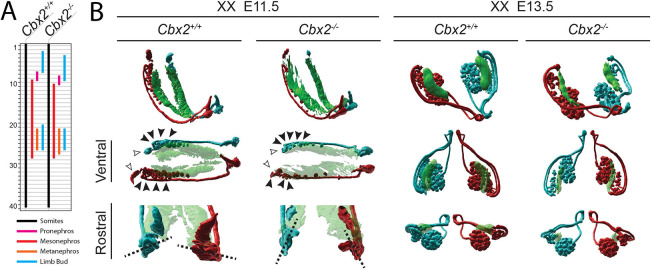
During development of the mouse urogenital complex, the gonads undergo changes in three-dimensional structure, body position and spatial relationship with the mesonephric ducts, kidneys and adrenals. The complexity of genital ridge development obscures potential connections between morphogenesis and gonadal sex determination. To characterize the morphogenic processes implicated in regulating gonad shape and fate, we used whole-embryo tissue clearing and light sheet microscopy to assemble a time course of gonad development in native form and context. Analysis revealed that gonad morphology is determined through anterior-to-posterior patterns as well as increased rates of growth, rotation and separation in the central domain that may contribute to regionalization of the gonad. We report a close alignment of gonad and mesonephric duct movements as well as delayed duct development in a gonad dysgenesis mutant, which together support a mechanical dependency linking gonad and mesonephric duct morphogenesis.

Keywords: 3D imaging; Gonad; IDISCO; Lightsheet; Mesonephros; Morphogenesis; Tissue clearing; Urogenital.


Conflict of interest statement

Competing interests The authors declare no competing or financial interests.

Figures

Fig. 1.
Fig. 1.
Whole-embryo tissue clearing and light sheet microscopy provide a means of analyzing the morphology of the developing gonad in embryonic context. (A) Schematic depicting iDISCO+ tissue clearing and immunofluorescence staining protocol. (B) Schematic depicting light sheet imaging parameters and image processing methods. (C) Maximum intensity projections of XY SF1:eGFP+/− mouse embryos imaged following iDISCO+ tissue clearing and immunofluorescence using anti-GFP and anti-PAX8 antibodies. Scale bar: 1000 μm. See Fig. S1 for identification of labeled structures.
Fig. 2.
Fig. 2.
The complete embryo and urogenital organs can be simultaneously analyzed through 3D segmentation and digital slicing. (A) Bounding box dimensions of primary series of 3D reconstructed XX (circles) and XY (triangles) embryos compared with total somites. Red, height; green, width; blue, depth. (B) Volumetric measurements calculated from isosurface segmentations of primary series of XX (circles) and XY (triangles) embryos compared with total somites. Volumes correspond to whole embryo (blue), genital ridge (SF1:eGFP, green) and nephric ducts (PAX8, red). (C) Sagittal slices of an E11.5 XY embryo 150 μm thick. Gray signal is a merge of background immunofluorescence from multiple antibodies. Organs are false colored for identification. See Fig. S2 for transverse slice and digital slices of E10.5 and E12.5 embryos.
Fig. 3.
Fig. 3.
Urogenital complex development involves early dynamic shifting along the anteroposterior axis. (A) Examples of somite alignment results overlaid on isosurface segmentations of whole embryos. Arrows indicate the anterior and posterior poles of the genital ridges (green) and nephric ducts (red), with numbers indicating the somite corresponding to the anterior pole. (B) Schematic and graph showing somite alignment of genital ridge (green), mesonephric ducts (red) and limb buds (cyan) relative to somites for XX and XY embryos at E9.5, E10.5, E11.5 and E12.5. Data come from right sides of embryos and are averaged by sex for each stage. ‘n’ represents the number of averaged samples. See Fig. S3 for individual samples and left sides.
Fig. 4.
Fig. 4.
Urogenital complex development following gonadal sex determination involves multidimensional shifts of organs relative to each other. Data depicting shifts in position of the ducts, gonads, adrenal and kidneys from XY embryos at E11.5, E12.5 and E13.5. Images in the first column contain SF1:eGFP and PAX8 immunofluorescence displayed with ‘normal shading’, using urogenital segmentations (shown on the right) to mask values outside the urogenital system to 0, with semi-transparent whole-embryo isosurfaces to show the position of the complex in the embryo. Isosurface segmentations include gonads (green, based on SF1:eGFP), adrenals (magenta, based on SF1:eGFP), and mesonephric ducts (M. DUCT) and kidneys (red, based on PAX8). Black arrowheads indicate the kidney primordium; white arrowheads indicate the growing kidney. R, right side. See Fig. S5 for XX embryos. Measurements are given for the distance from the center point between the left and right gonads to the surface of the embryo between the aligned somites (*) and the distance between the center points of the left and right gonads (**).
Fig. 5.
Fig. 5.
Genital ridge development switches from lengthening to shortening before E11.5. (A) Comparison between SF1:eGFP and GATA4 in early XY urogenital ridges. Maximum intensity projection of XY E10.5 B6 mouse embryo labeled with antibodies to PAX8 (red), GATA4 (cyan) and TUJ1 (gray). Ventral views of isosurfaces generated by segmentation of signals from PAX8 (red), GATA4 (cyan) and SF1:eGFP (green) in XY embryos at E9.5, E10.5 and E11.5. Maximum intensity projections of medial transverse digital slices from E10.5 genital ridges. Position of sectional planes are indicated by boxes on isosurfaces. Gray background signal from a third channel was used in the digital sections to examine tissue structure. White arrowhead indicates GATA4 expression in the dorsal mesentery (DM). (B) Plot of left and right genital ridge lengths, calculated from SF1:eGFP in XX and XY embryos, compared with total somites and embryonic stage.
Fig. 6.
Fig. 6.
The developing genital ridge displays anterior-to-posterior and center-biased patterns of morphological change. (A) Showcase of data used for morphological analyses of SF1:eGFP embryos. For one XY embryo at each stage, E10.5, E11.5 and E12.5, images (left to right) are: maximum intensity projection, whole-embryo isosurface, ventral view of region indicated by yellow box, rostral view of 10 μm digital slices collected 300 μm and 600 μm from the anterior end of the genital ridge, and magnification of the digital slice region indicated by the orange box. White arrowheads indicate adrenals. White dotted lines indicate the orientation of the gonad, which rotates medially throughout the time course. SF1:eGFP, green; PAX8, red; αSMA, blue. (B) Schematic showing the digital slicing scheme for morphology analysis. Slices are 10 μm, perpendicular to the genital ridge, at 100 μm intervals starting at the anterior pole. See Fig. S6 for a depiction of the analysis process. (C-F) Schematics and plots of gonad morphology along the AP axis. XX (circles) and XY (triangles) at E10.5 (green), E11.5 (blue) and E12.5 (magenta). In C, D and F, solid and dotted lines indicate left and right gonads, respectively. (C) Analysis of gonad height (thickness). (D) Analysis of gonad width. (E) Analysis of distance between left and right gonads. (F) Analysis of the angle between gonad and dorsal aorta.
Fig. 7.
Fig. 7.
Morphogenesis and positional shifting of nephric ducts exhibits anteroposterior regionalization and coordination with gonad morphogenesis. (A) Data from XY embryos at E9.5, E10.5 and E11.5. Isosurface segmentations include right genital ridges (SF1:eGFP, semitransparent) and nephric ducts (PAX8). Arrowheads indicate the anterior and posterior boundaries of the pronephros (white), mesonephros (gray) and metanephros (black). Arrows indicate the Müllerian duct rudiment at the anterior pole of the mesonephros (black), the mesonephric duct where it becomes unaligned with the genital ridge axis (gray), and PAX8-positive cell aggregates along the lateral edge of the gonad (white). See Fig. S7 for dorsal views of mesonephric tubules. (B) Schematic depicting views presented in A. (C,D) Schematics and plots of mesonephric duct morphology along the AP axis. XX (circles) and XY (triangles) at E10.5 (green), E11.5 (blue) and E12.5 (magenta). (C) Analysis of distance between left and right mesonephric ducts. (D) Analysis of angle between genital ridge and mesonephric duct. Solid and dotted lines indicate left and right gonads, respectively. Inset depicts data regions by stage. (E) Urogenital organs at E12.5 with arrows indicating medial rotation of the gonad, occurring first (between E10.5 and E11.5), and movement of the mesonephric duct and kidneys, occurring second (between E11.5 and E12.5).
Fig. 8.
Fig. 8.
Whole-embryo imaging reveals a mesonephric morphology phenotype in Cbx2 mutants. (A) Comparison of somite alignment of pronephros (magenta), mesonephros (red), metanephros (orange) and limb buds (cyan) in XX Cbx2 wild-type and knockout embryos at E11.5. (B) Isosurface segmentations of gonads (green, based on GATA4) and nephric ducts (left, cyan; right, red; based on PAX8) in XX Cbx2 wild-type and knockout embryos at E11.5 and E13.5. White arrowheads indicate pronephric regions. Black arrowheads indicate connections between individual mesonephric tubules and the main mesonephric duct. Mesonephric tubule orientation is indicated with dotted lines.

Similar articles

Cited by

References

    1. Belle, M., Godefroy, D., Dominici, C., Heitz-Marchaland, C., Zelina, P., Hellal, F., Bradke, F. and Chédotal, A. (2014). A Simple method for 3D analysis of immunolabeled axonal tracts in a transparent nervous system. Cell Rep. 9, 1191-1201. 10.1016/j.celrep.2014.10.037 - DOI - PubMed
    1. Belle, M., Godefroy, D., Couly, G., Malone, S. A., Collier, F., Giacobini, P. and Chédotal, A. (2017). Tridimensional visualization and analysis of early human development. Cell 169, 161-173.e12. 10.1016/j.cell.2017.03.008 - DOI - PubMed
    1. Biason-Lauber, A., Konrad, D., Meyer, M., deBeaufort, C. and Schoenle, E. J. (2009). Ovaries and female phenotype in a girl with 46,XY karyotype and mutations in the CBX2 gene. Am. J. Hum. Genet. 84, 658-663. 10.1016/j.ajhg.2009.03.016 - DOI - PMC - PubMed
    1. Bouchard, M., Souabni, A., Mandler, M., Neubüser, A. and Busslinger, M. (2002). Nephric lineage specification by Pax2 and Pax8. Genes Dev. 16, 2958-2970. 10.1101/gad.240102 - DOI - PMC - PubMed
    1. Brambell, F. W. R. (1927a). The development and morphology of the gonads of the mouse.— Part I. The morphogenesis of the indifferent gonad and of the ovary. Proc. R. Soc. Lond. B 101, 391-409. 10.1098/rspb.1927.0022 - DOI

Publication types