

Levels, Trends, and Inequalities in Using Institutional Delivery Services in Low- and Middle-Income Countries: A Stratified Analysis by Facility Type
- PMID: 33795363
- PMCID: PMC8087431
- DOI: 10.9745/GHSP-D-20-00533
Levels, Trends, and Inequalities in Using Institutional Delivery Services in Low- and Middle-Income Countries: A Stratified Analysis by Facility Type
Abstract
Introduction: To ensure equitable and accessible services and improved utilization of institutional delivery it is important to identify what progress has been achieved, whether there are vulnerable and disadvantaged groups that need specific attention and what are the key factors affecting the utilization of institutional delivery services. In this study, we examined levels, trends, and inequalities in the utilization of institutional delivery services in low- and middle-income countries.
Methods: We used nationally representative cross-sectional data from Demographic and Health Surveys (DHS) conducted during 1990-2018. Bayesian linear regression analysis was performed.
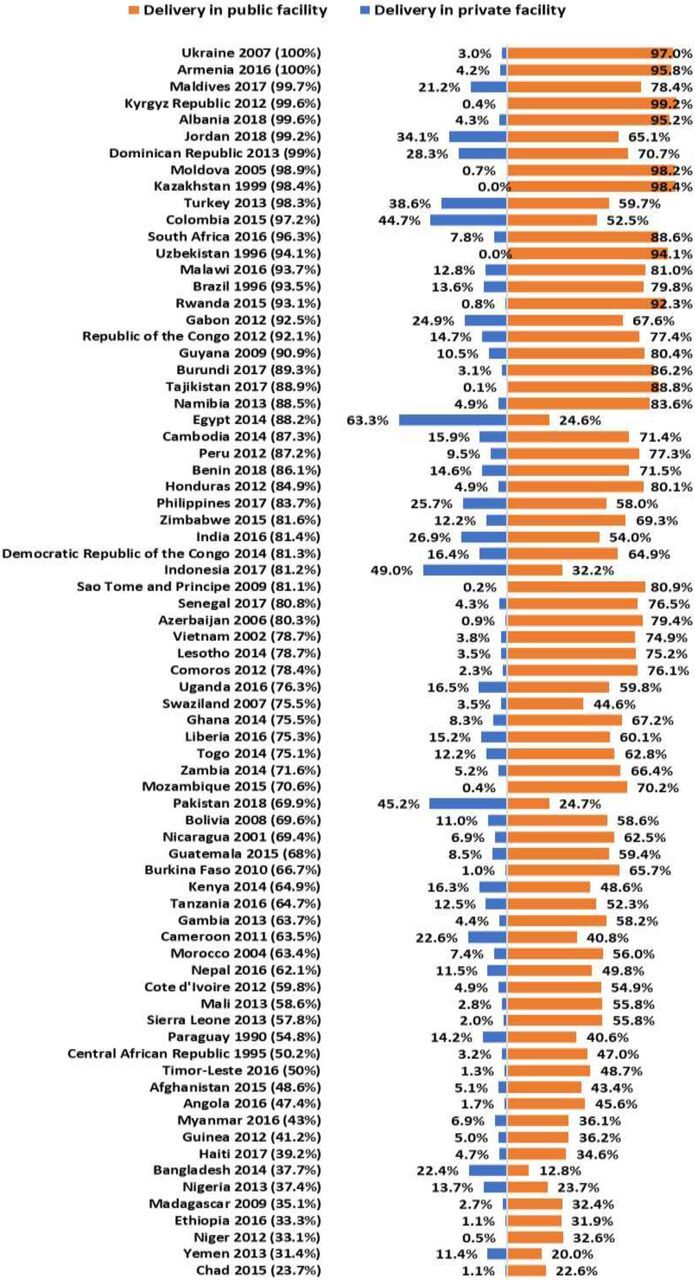
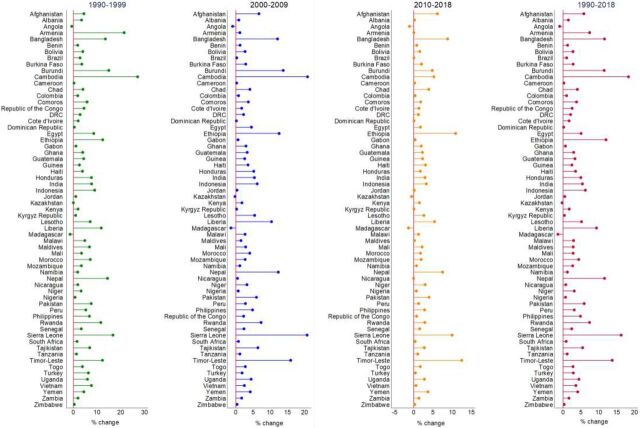
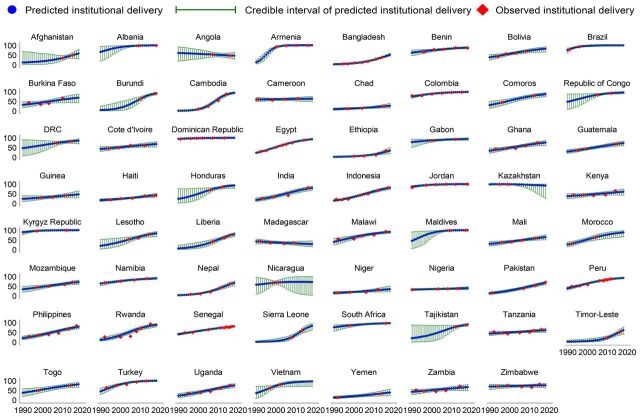
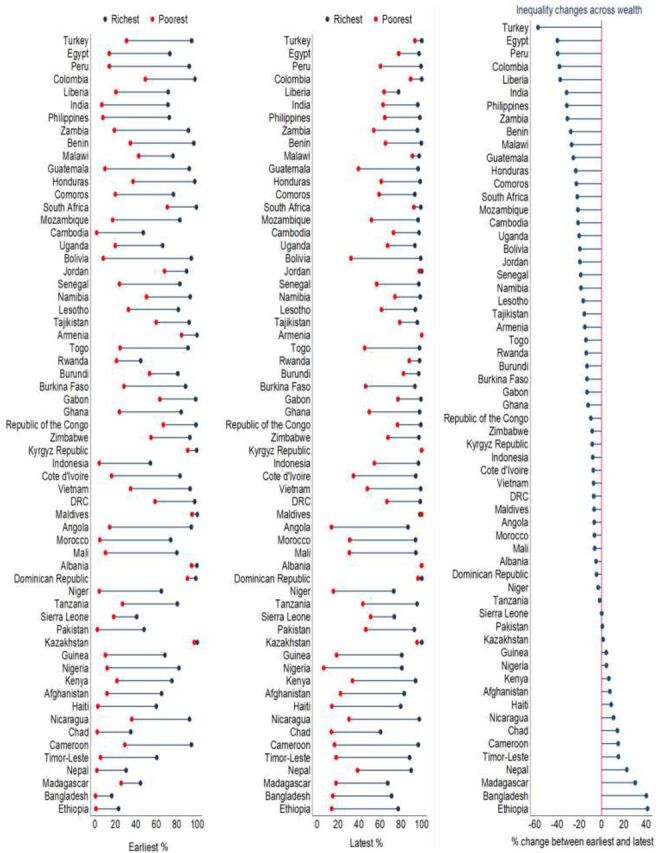
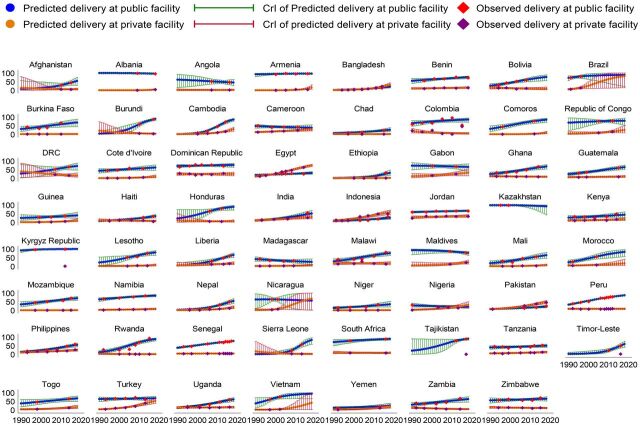
Results: Among 74 countries, the utilization of institutional delivery services ranged from 23.7% in Chad to 100% in Ukraine and Armenia (with >90% in 19 countries and <50% in 13 countries) during the latest DHS rounds. Trend analysis in 63 countries with at least 2 surveys showed that the utilization of institutional delivery services increased in 60 countries during 1990-2018, with the highest increase being in Cambodia (18.3%). During this period, the utilization of institutional delivery services increased in 90.3% of countries among the richest, 95.2% of countries in urban, and 84.1% of countries among secondary+ educated women. The utilization of institutional delivery services was higher among wealthiest, urban, and secondary+ educated women compared to their counterparts. Greater utilization of private facilities for delivery was observed in women from the highest income group and urban communities, whereas highest utilization of public facilities was observed for women from the lowest income group and rural communities.
Conclusions: The utilization of institutional delivery services varied substantially between and within countries over time. Significant disparities in service utilization identified in this study highlight the need for tailored support for women from disadvantaged and vulnerable groups.
© Hasan et al.
Figures
References
-
- Alkema L, Chou D, Hogan D, et al. Global, regional, and national levels and trends in maternal mortality between 1990 and 2015, with scenario-based projections to 2030: a systematic analysis by the UN Maternal Mortality Estimation Inter-Agency Group. Lancet. 2016;387(10017):462–474. 10.1016/S0140-6736(15)00838-7. - DOI - PMC - PubMed
-
- United Nations Children's Fund (UNICEF), World Health Organization, World Bank, United Nations. Levels & Trends in Child Mortality: Report 2017. UNICEF; 2017. Accessed January 7, 2021. https://childmortality.org/wp-content/uploads/2018/10/UN-IGME-Child-Mort...
-
- World Health Organization (WHO). Trends in Maternal Mortality: 1990 to 2015: Estimates by WHO, UNICEF, UNFPA, World Bank Group and the United Nations Population Division. WHO; 2015. Accessed January 7, 2021. https://www.who.int/reproductivehealth/publications/monitoring/maternal-...
Publication types
MeSH terms
LinkOut - more resources
Full Text Sources
Other Literature Sources
Medical