Comparative Study
. 2021 Apr;9(4):e001243.
doi: 10.1136/jitc-2020-001243.

New generation of DNA-based immunotherapy induces a potent immune response and increases the survival in different tumor models

Affiliations
Comparative Study

New generation of DNA-based immunotherapy induces a potent immune response and increases the survival in different tumor models

Alessandra Lopes et al. J Immunother Cancer. 2021 Apr.

Abstract

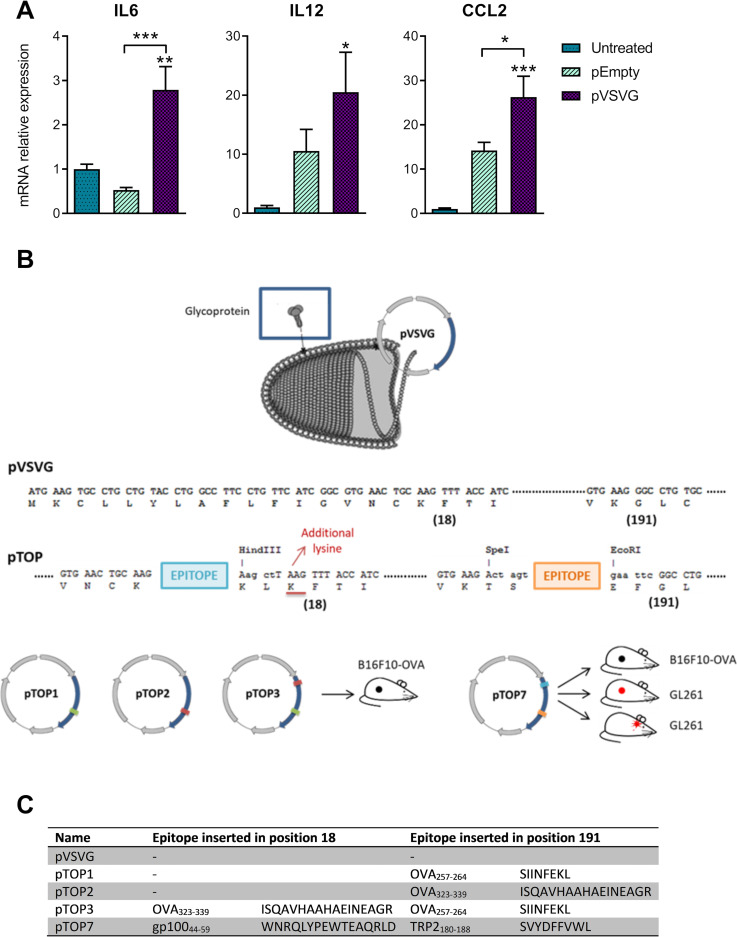
Background: Strategies to increase nucleic acid vaccine immunogenicity are needed to move towards clinical applications in oncology. In this study, we designed a new generation of DNA vaccines, encoding an engineered vesicular stomatitis virus glycoprotein as a carrier of foreign T cell tumor epitopes (plasmid to deliver T cell epitopes, pTOP). We hypothesized that pTOP could activate a more potent response compared with the traditional DNA-based immunotherapies, due to both the innate immune properties of the viral protein and the specific induction of CD4 and CD8 T cells targeting tumor antigens. This could improve the outcome in different tumor models, especially when the DNA-based immunotherapy is combined with a rational therapeutic strategy.

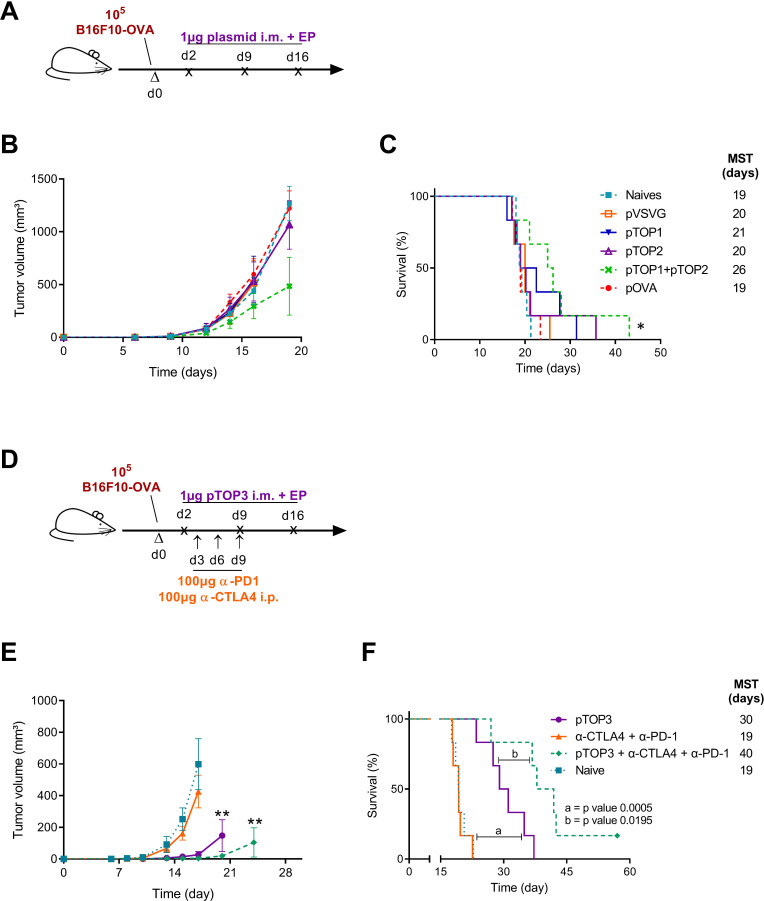
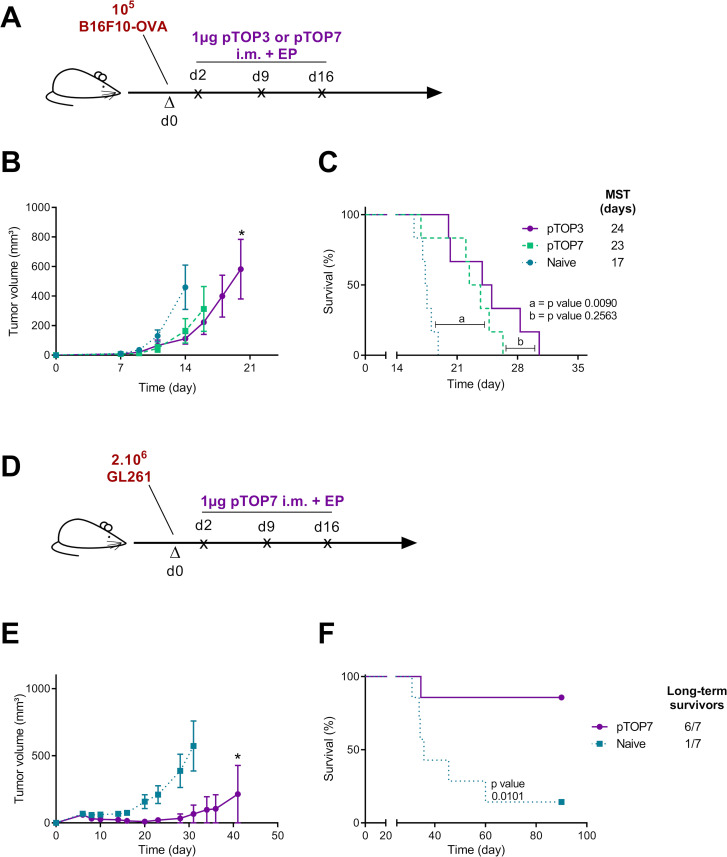
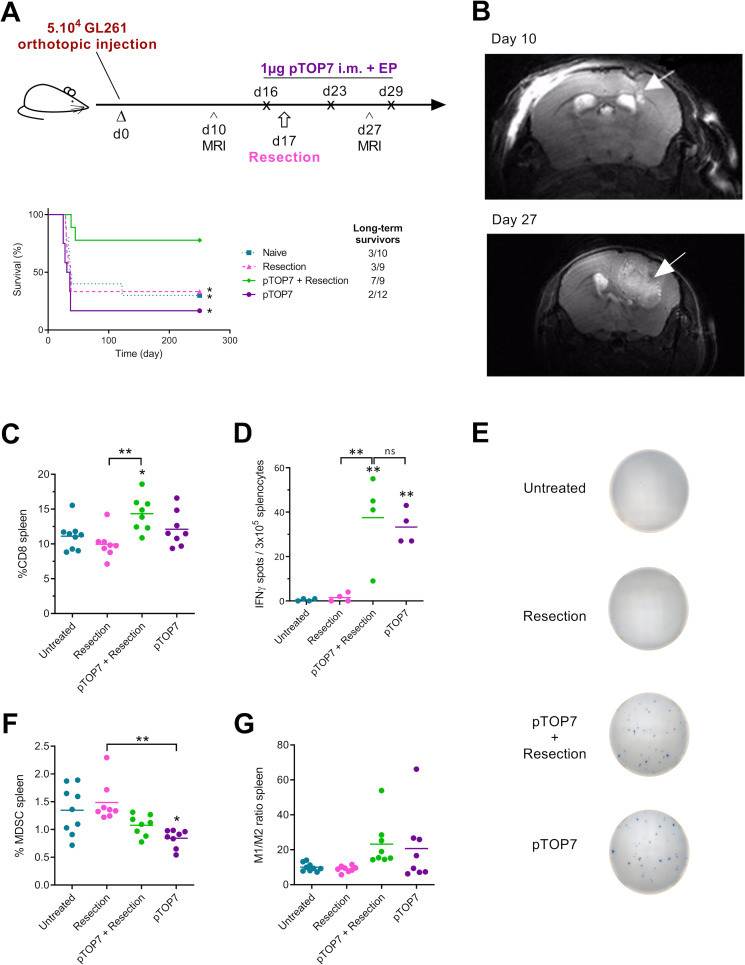
Methods: The ability of pTOP DNA vaccine to activate a specific CD4 and CD8 response and the antitumor efficacy were tested in a B16F10-OVA melanoma (subcutaneous model) and GL261 glioblastoma (subcutaneous and orthotopic models).

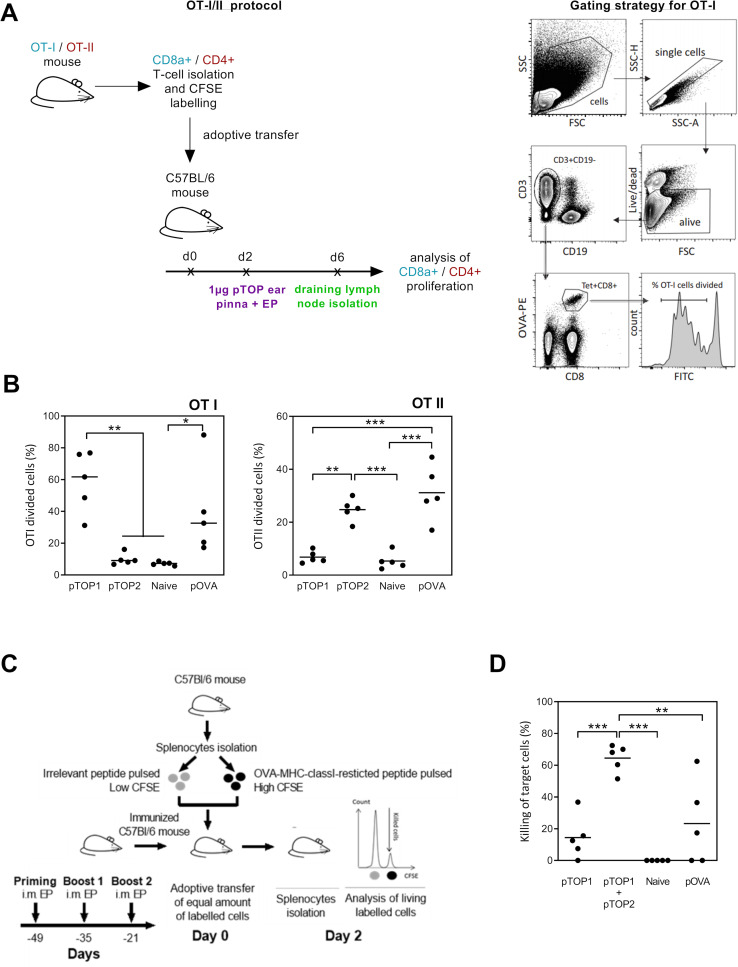
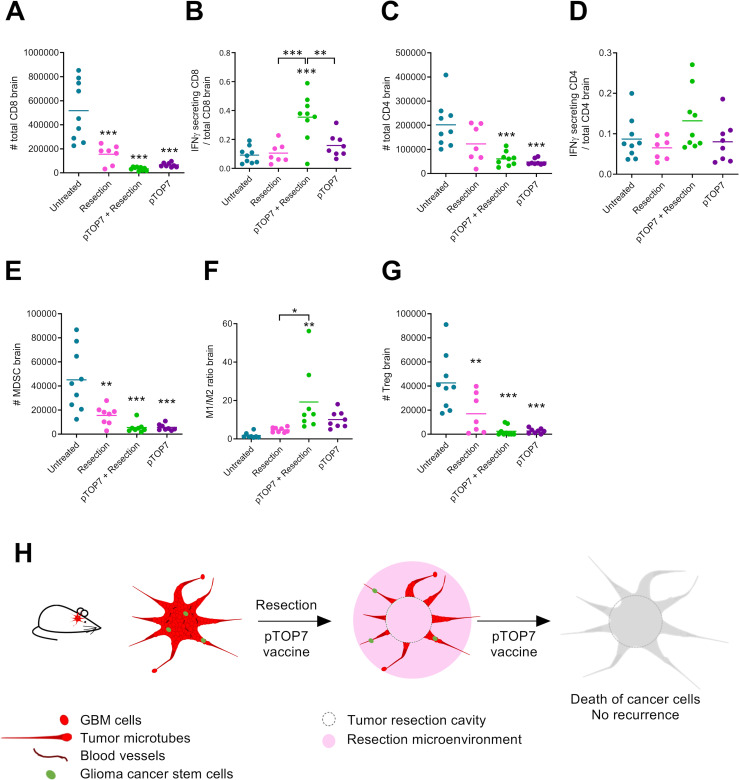
Results: In B16F10-OVA melanoma, pTOP promoted immune recognition by adequate processing of both MHC-I and MHC-II epitopes and had a higher antigen-specific cytotoxic T cell (CTL) killing activity. In a GL261 orthotopic glioblastoma, pTOP immunization prior to tumor debulking resulted in 78% durable remission and long-term survival and induced a decrease of the number of immunosuppressive cells and an increase of immunologically active CTLs in the brain. The combination of pTOP with immune checkpoint blockade or with tumor resection improved the survival of mice bearing, a subcutaneous melanoma or an orthotopic glioblastoma, respectively.

Conclusions: In this work, we showed that pTOP plasmids encoding an engineered vesicular stomatitis virus glycoprotein, and containing various foreign T cell tumor epitopes, successfully triggered innate immunity and effectively promoted immune recognition by adequate processing of both MHC-I and MHC-II epitopes. These results highlight the potential of DNA-based immunotherapies coding for viral proteins to induce potent and specific antitumor responses.

Keywords: active; adaptive immunity; antigens; cellular; immunity; immunotherapy; vaccination.


Conflict of interest statement

Competing interests: GV, LL and VP are coapplicants of a patent: 'Modified VSV-G and vaccines thereof', PCT/EP2017/073119. GV, AL, CB and VP are coapplicants of a patent: 'Modified vesicular stomatitis virus glycoprotein and uses thereof for the treatment of brain tumors', EP19199334.4. Both patents are pending.

Figures

Figure 1
Figure 1
Inflammatory cytokines expressed after intramuscular electroporation of pEmpty or pVSVG and a description of the pTOP technology and vaccine constructs. (A) mRNA expression of IL6, IL12 and CCL2 48 hours after the injection of 1 µg plasmid. Mice that did not receive any plasmid (untreated) were used as a control. The error bars represent the mean±SEM; n=2, n=3–4. Statistical analysis: One-way ANOVA with Tukey’s multiple comparisons test. *p<0.05, **p<0.01 and ***p<0.001 compared with untreated or to the specified group. (B) Graphical representation of the versatile pTOP technology (vesiculovirus picture adapted from ViralZone: www.expasy.org/viralzone, Sib Swiss Institute of bioinformatics). (C) pTOP vaccines that were used throughout the paper. The positions into which the epitopes were inserted are defined by the amino acid residue directly after the insertion site. ANOVA, analysis of variance; IL6, interleukin 6; pTOP, plasmid to deliver T cell epitopes; pVSVG, plasmid vesicular stomatitis virus glycoprotein.
Figure 2
Figure 2
Evaluation of the OVA-specific cellular immune response and CTL killing activity. (A) Schematic representation of OT-I/II proliferation studies protocol. Purified CD8 or CD4 T cells from transgenic OTI and OTII mice were CFSE-labeled and adoptively transferred to C57BL/6 mice. The mice were treated 2 days later with 1 µg pTOP injection into the ear Pinna, followed by electroporation and sacrificed 4 days later to collect the draining lymph nodes for preparation of single-cell suspension and FACS analysis. (B) Quantification of the divided OTI and OTII cells is shown; n=5. (C) In vivo OVA-specific cytotoxic CD8 T cell killing assay protocol. C57BL/6 mice were first vaccinated three times by intramuscular electroporation of 1 µg pTOP every 2 weeks. Three weeks after the last vaccine administration, the mice received labeled splenocytes from naive mice that were pulsed with either SIINFEKL (the OVA peptide) or an irrelevant peptide (ie, a peptide that should not induce an immune response). Two days after transfer, splenocytes were collected and analyzed by FACS to determine the antigen-specific killing; n=5. (D) Percentage of the CTL killing activity for the different groups. Statistical analysis: one-way ANOVA with Tukey’s multiple comparisons test. *p<0.05, **p<0.01, ***p<0.001 compared with untreated or to the specified group (n=5). ANOVA, analysis of variance; CTL, cytotoxic T cell; CFSE, carboxyfluorescein diacetate succinimidyl ester; FSC, forward scatter (cell diameter); SSC, side scatter (cell granulometry); OVA, ovalbumin; pTOP, plasmid to deliver T cell epitopes; pOVA, plasmid OVA.
Figure 3
Figure 3
B16F10-OVA therapeutic vaccination comparing pTOP vaccines and classical DNA vaccination, and combination with immune checkpoint blockade. (A) Schematic protocol of the B16F10-OVA injection and therapeutic DNA vaccination. C57BL/6 mice were first injected with B16F10-OVA. The DNA vaccines were intramuscularly electroporated 2, 9 and 16 days after injection of the tumor cells. (B) Tumor growth curves for the different groups. (C) percentage of survival as a function of time. The error bars represent the mean±SEM; n=6. Statistical analysis: one-way ANOVA with Tukey’s multiple comparisons test, two-way ANOVA with Bonferroni post-tests or Mantel-Cox test for comparison of survival curves. *p<0.05, compared with naive or to the specified group. (D) schematic protocol of the B16F10-OVA injection, therapeutic DNA vaccination and immune checkpoint blockade administration. C57BL/6 mice were first injected with B16F10-OVA. the DNA vaccines were intramuscularly electroporated 2, 9 and 16 days after injection of the tumor cells. Immune checkpoint blockade antibodies against CTLA4 (100 µg) and PD1 (100 µg) were injected intraperitoneally 3, 6 and 9 days after tumor injection. (E) tumor growth curves for the different groups. (F) percentage of survival as a function of time. The error bars represent the mean±SEM; n=6. Statistical analysis: One-way ANOVA with Tukey’s multiple comparisons test, two-way ANOVA with Bonferroni post-tests or Mantel-Cox test for comparison of survival curves. **p<0.01, compared with naive or to the specified group. ANOVA, analysis of variance; MST, median survival time; OVA, ovalbumin; pOVA, plasmid OVA; pTOP, plasmid to deliver T cell epitopes; pVSVG, plasmid vesicular stomatitis virus glycoprotein.
Figure 4
Figure 4
Therapeutic immunization with pTOP vaccines in melanoma and glioblastoma models. (A) Schematic protocol, the development of tumor volume and the survival curves are shown for each tumor model. C57BL/6 mice were first injected with B16F10-OVA (A) or GL261 cells (D). The tumor growth and the survival curves for melanoma (C) and for GBM (E, F) are also shown. The pTOP vaccine was intramuscularly electroporated 2, 9 and 16 days after injection of the tumor cells. The error bars represent the mean±SEM; n=6–7. Statistical analysis: two-way ANOVA with Bonferroni post-tests or Mantel-Cox test for comparison of survival curves. *p<0.05 compared with naive. ANOVA, analysis of variance; GBM, glioblastoma; MST, median survival time; OVA, ovalbumin; pTOP, plasmid to deliver T cell epitopes.
Figure 5
Figure 5
Therapeutic immunization and resection in an orthotopic glioblastoma model and development of the systemic immune response. (A) Schematic protocol and survival curves for the therapeutic immunization. C57BL/6 mice first received an intracranial injection of GL261 cells at day 0. MRI was used to monitor brain tumors on days 10 and 27. The pTOP vaccine was intramuscularly electroporated 16, 23 and 19 days after the injection of tumor cells, and resection of the tumor was performed on day 17; n=9–12. (B) representative axial T2-weighted MRI image of an untreated (naïve) mouse brain before (day 10) and after tumor resection (day 27). The white arrows indicate the GL261 primary and recurrent tumors. (C–H) analysis of immune cells in the spleen 29 days after GL261 inoculation. The percentage of CD8 T cells is shown for all the groups (C), and the production of IFNγ by splenocytes stimulated with TRP2 peptide was assessed by ELISPOT (D, E). The percentage of MDSCs (F) and the ratio of M1/M2 macrophages (G) are displayed. The error bars represent the mean±SEM; n=7–9. Statistical analysis: one-way ANOVA with Tukey’s multiple comparisons test or Mantel-Cox test for comparison of survival curves. *p<0.05, **p<0.01 compared with naive or to the specified group. ANOVA, analysis of variance; IFNγ, interferon-γ; ns, not significant; MDSCs, myeloid-derived suppressor cell; pTOP, plasmid to deliver T cell epitopes.
Figure 6
Figure 6
Development of immune cells and immunosuppressive cells in the brain 29 days after GL261 inoculation. (A, B) Total number of CD8 T cells and the ratio of IFNγ-secreting CD8/total CD8 T cells. (C, D) Total number of CD4 T cells and the ratio of IFNγ-secreting CD4/total CD4 T cells. (E, F) percentage of MDSCs and the ratio of M1/M2 macrophages in the brain. (G) Number of Tregs in the brain. The error bars represent the mean±SEM; n=7–9. Statistical analysis: one-way ANOVA with Tukey’s multiple comparisons test. *p<0.05, **p<0.01, ***p<0.001 compared with naive or to the specified group. (H) Principle of combining resection and pTOP7 vaccination for preventing GL261 recurrences. ANOVA, analysis of variance; GBM, glioblastoma; IFNγ, interferon-γ; MDSCs, myeloid-derived suppressor cells; pTOP, plasmid to deliver T cell epitopes.

References

    1. Yarchoan M, Johnson BA, Lutz ER, et al. Targeting neoantigens to augment antitumour immunity. Nat Rev Cancer 2017;17:569. 10.1038/nrc.2017.74 - DOI - PubMed
    1. Pardoll DM. The blockade of immune checkpoints in cancer immunotherapy. Nat Rev Cancer 2012;12:252–64. 10.1038/nrc3239 - DOI - PMC - PubMed
    1. Fares CM, Van Allen EM, Drake CG, et al. Mechanisms of resistance to immune checkpoint blockade: why does checkpoint inhibitor immunotherapy not work for all patients? Am Soc Clin Oncol Educ Book 2019;39:147–64. 10.1200/EDBK_240837 - DOI - PubMed
    1. Yang B, Jeang J, Yang A, et al. Dna vaccine for cancer immunotherapy. Hum Vaccin Immunother 2014;10:3153–64. 10.4161/21645515.2014.980686 - DOI - PMC - PubMed
    1. Saade F, Petrovsky N. Technologies for enhanced efficacy of DNA vaccines. Expert Rev Vaccines 2012;11:189–209. 10.1586/erv.11.188 - DOI - PMC - PubMed

Publication types

MeSH terms