. 2021 Apr 2;372(6537):eabf3119.
doi: 10.1126/science.abf3119.

Gamma rhythm communication between entorhinal cortex and dentate gyrus neuronal assemblies

Affiliations

Gamma rhythm communication between entorhinal cortex and dentate gyrus neuronal assemblies

Antonio Fernández-Ruiz et al. Science. .

Abstract

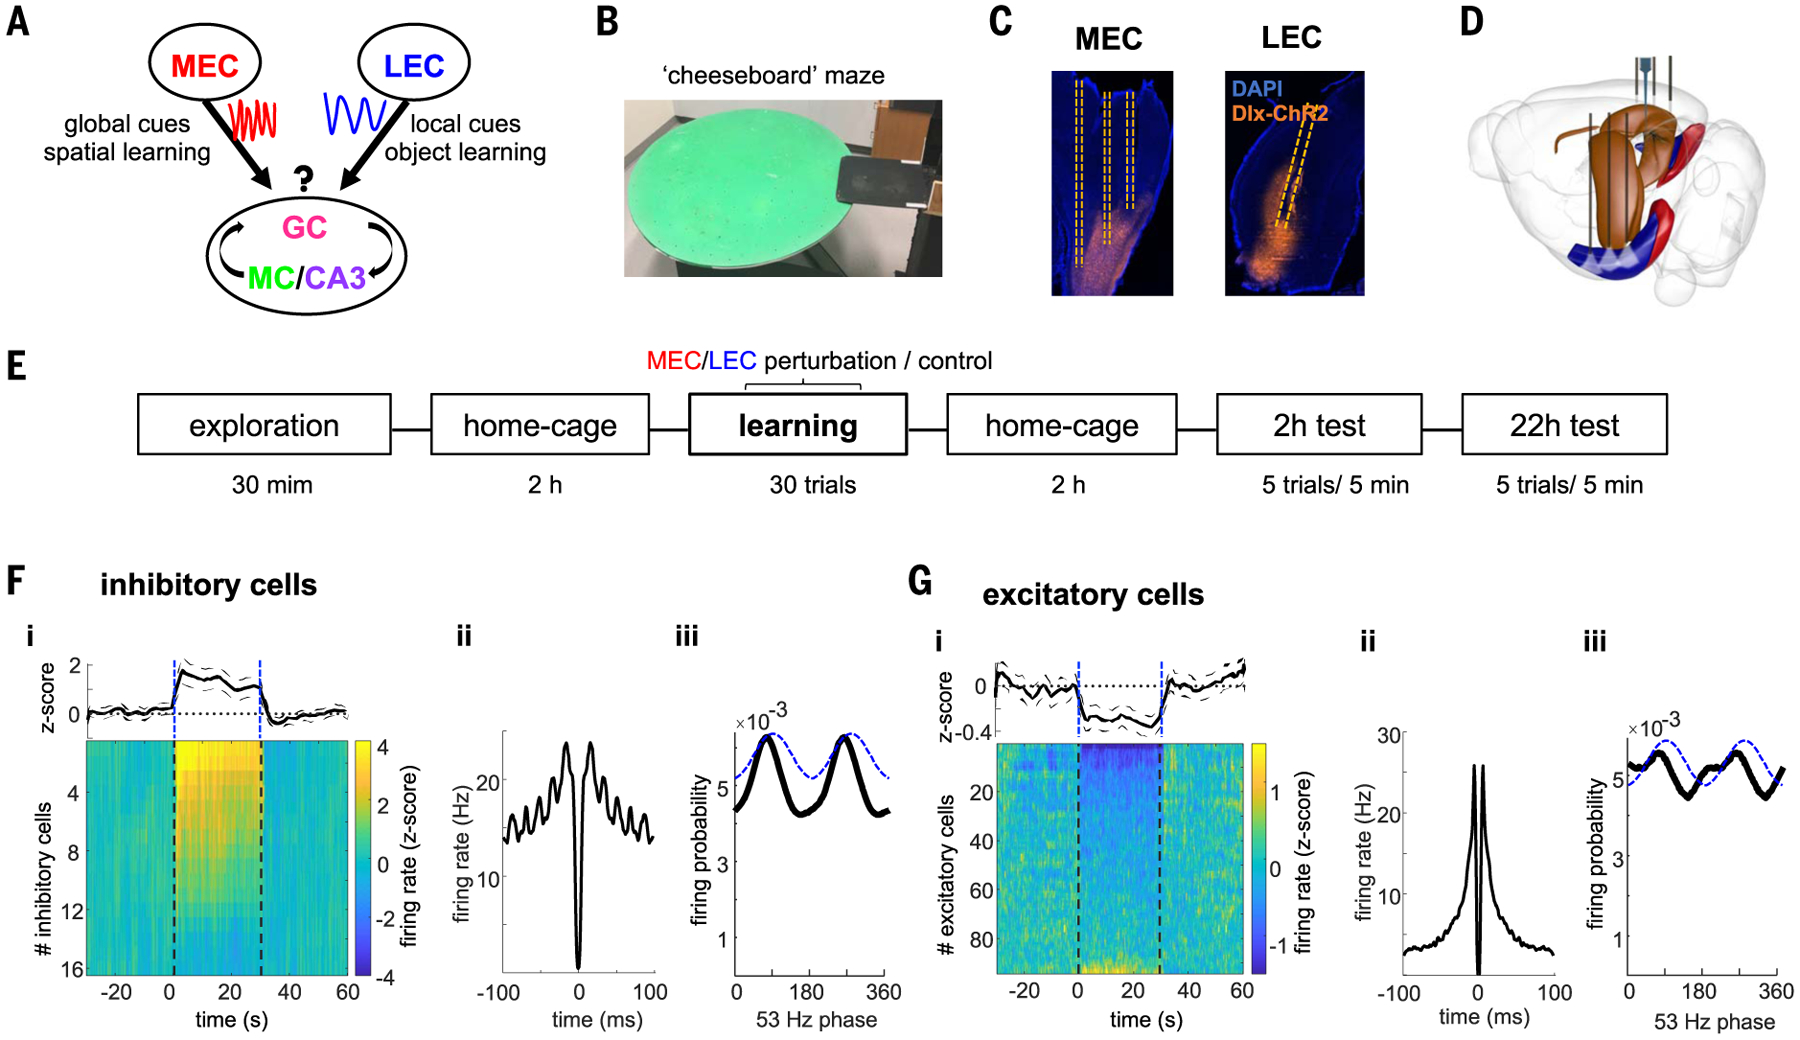
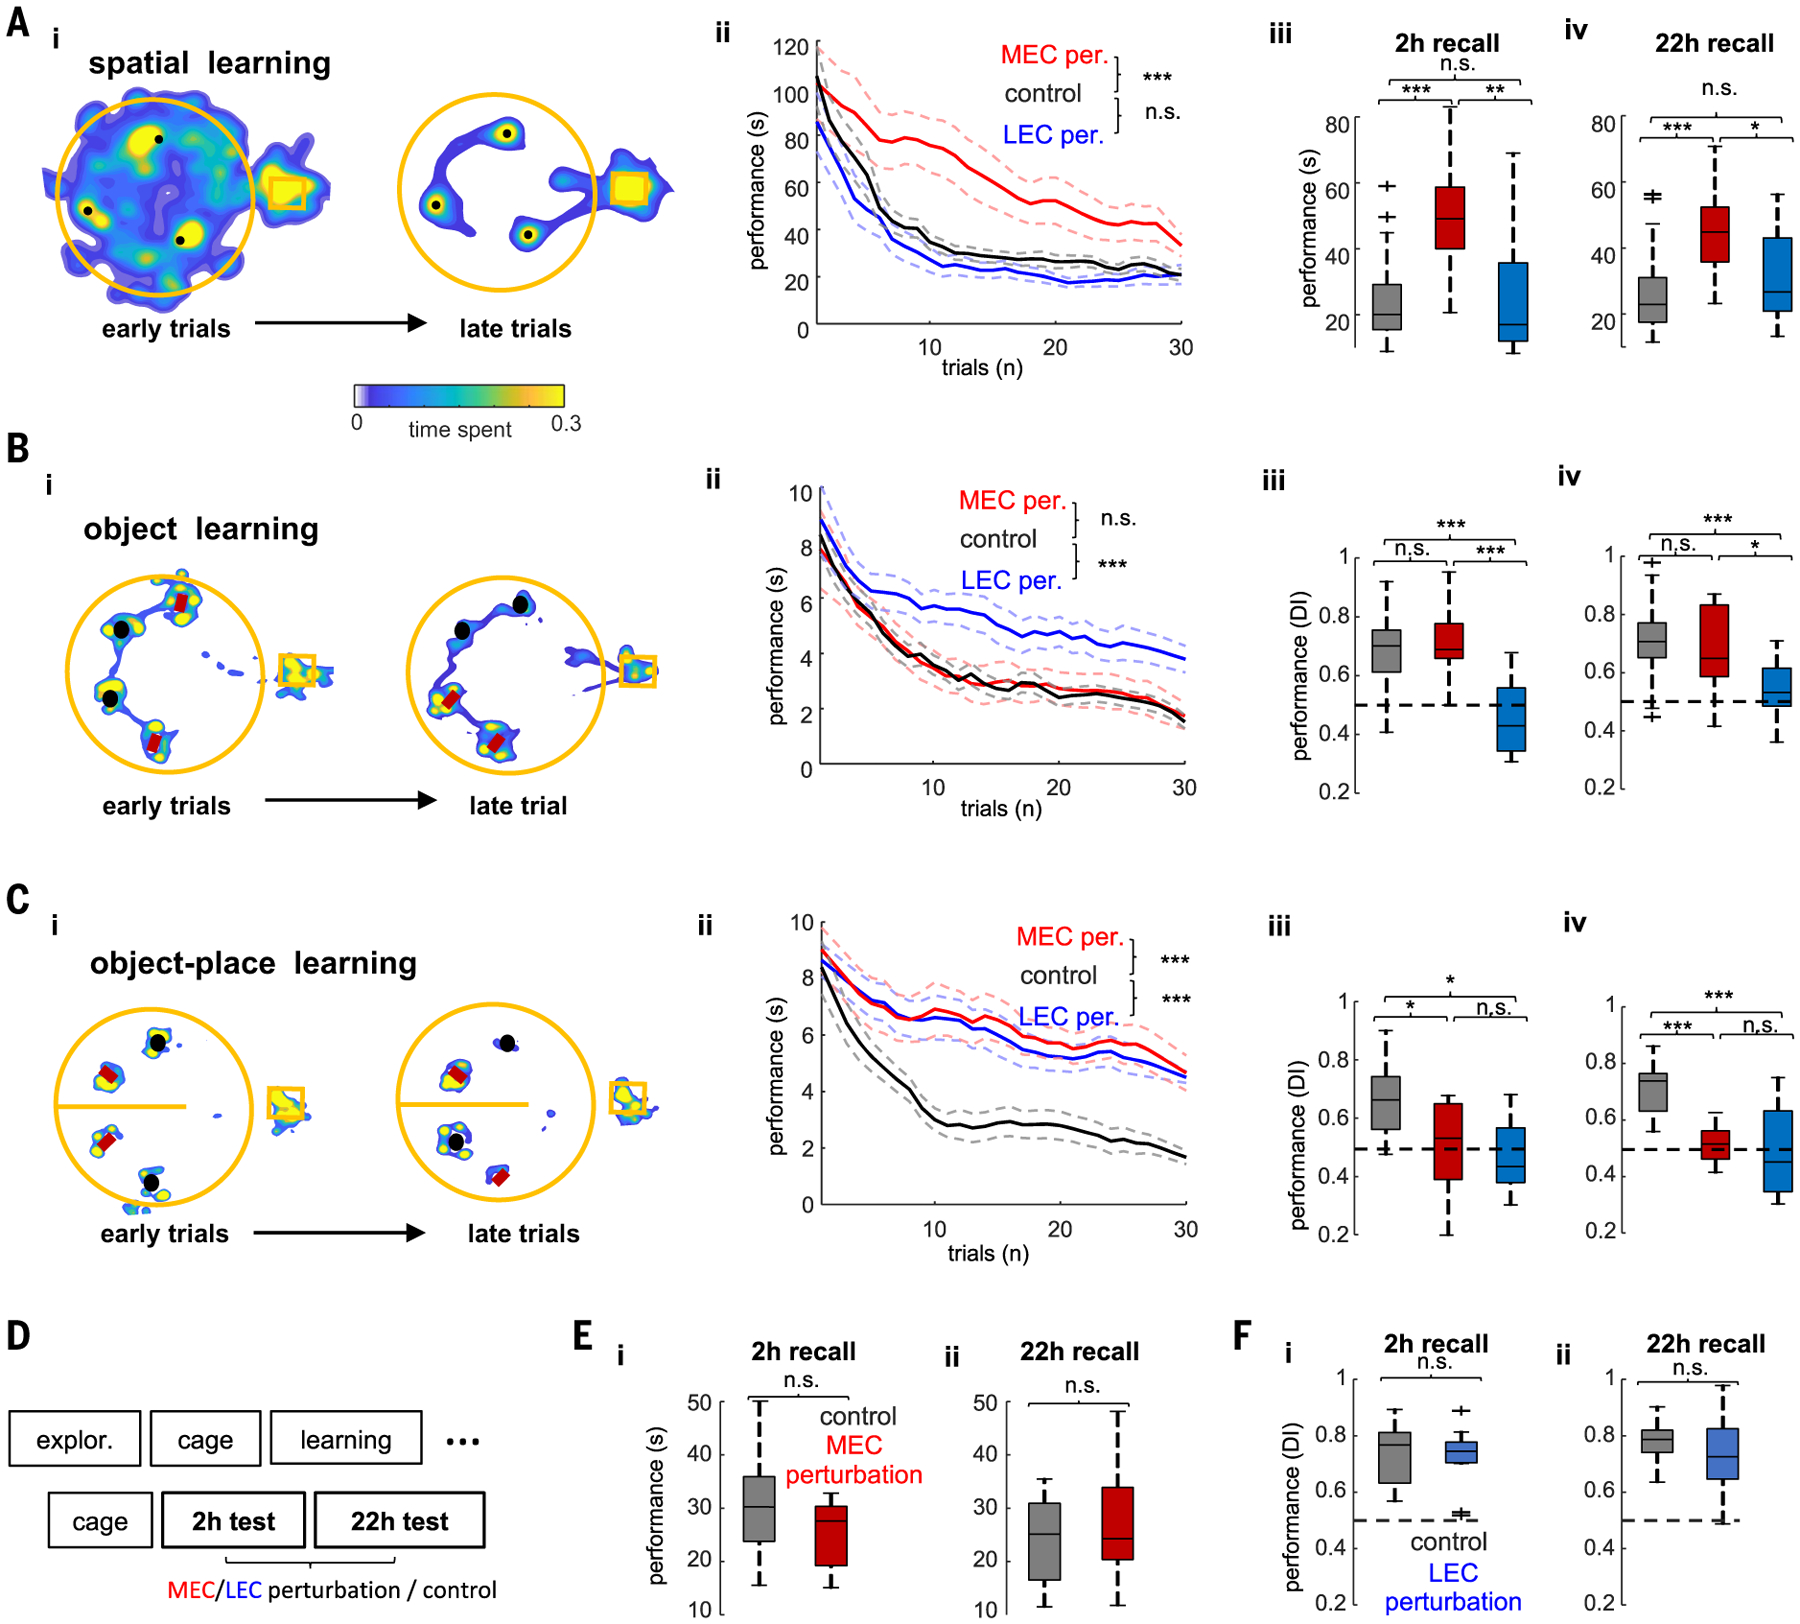
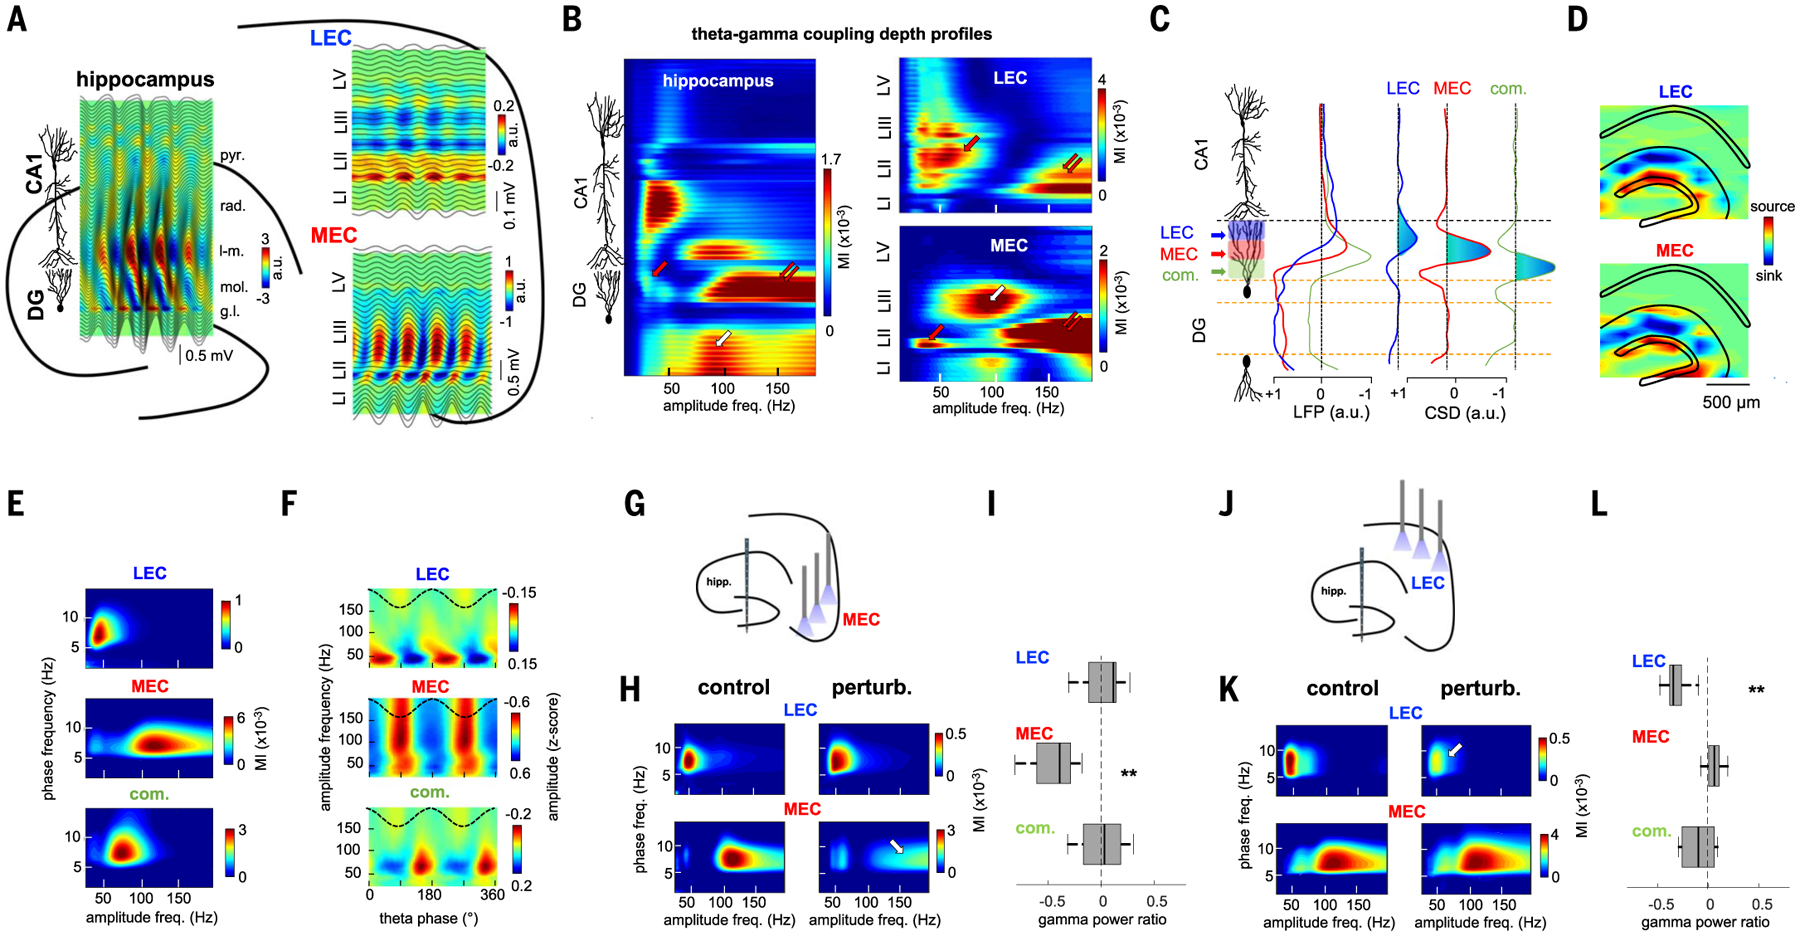
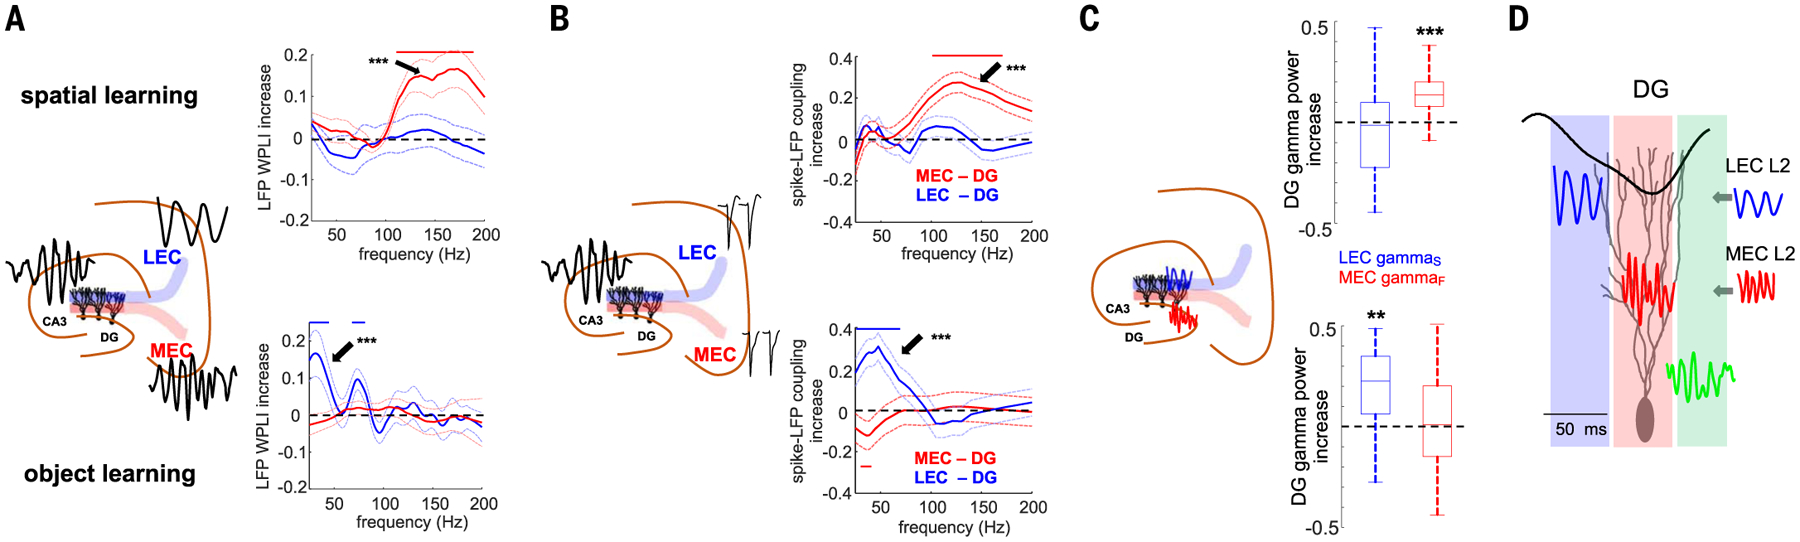
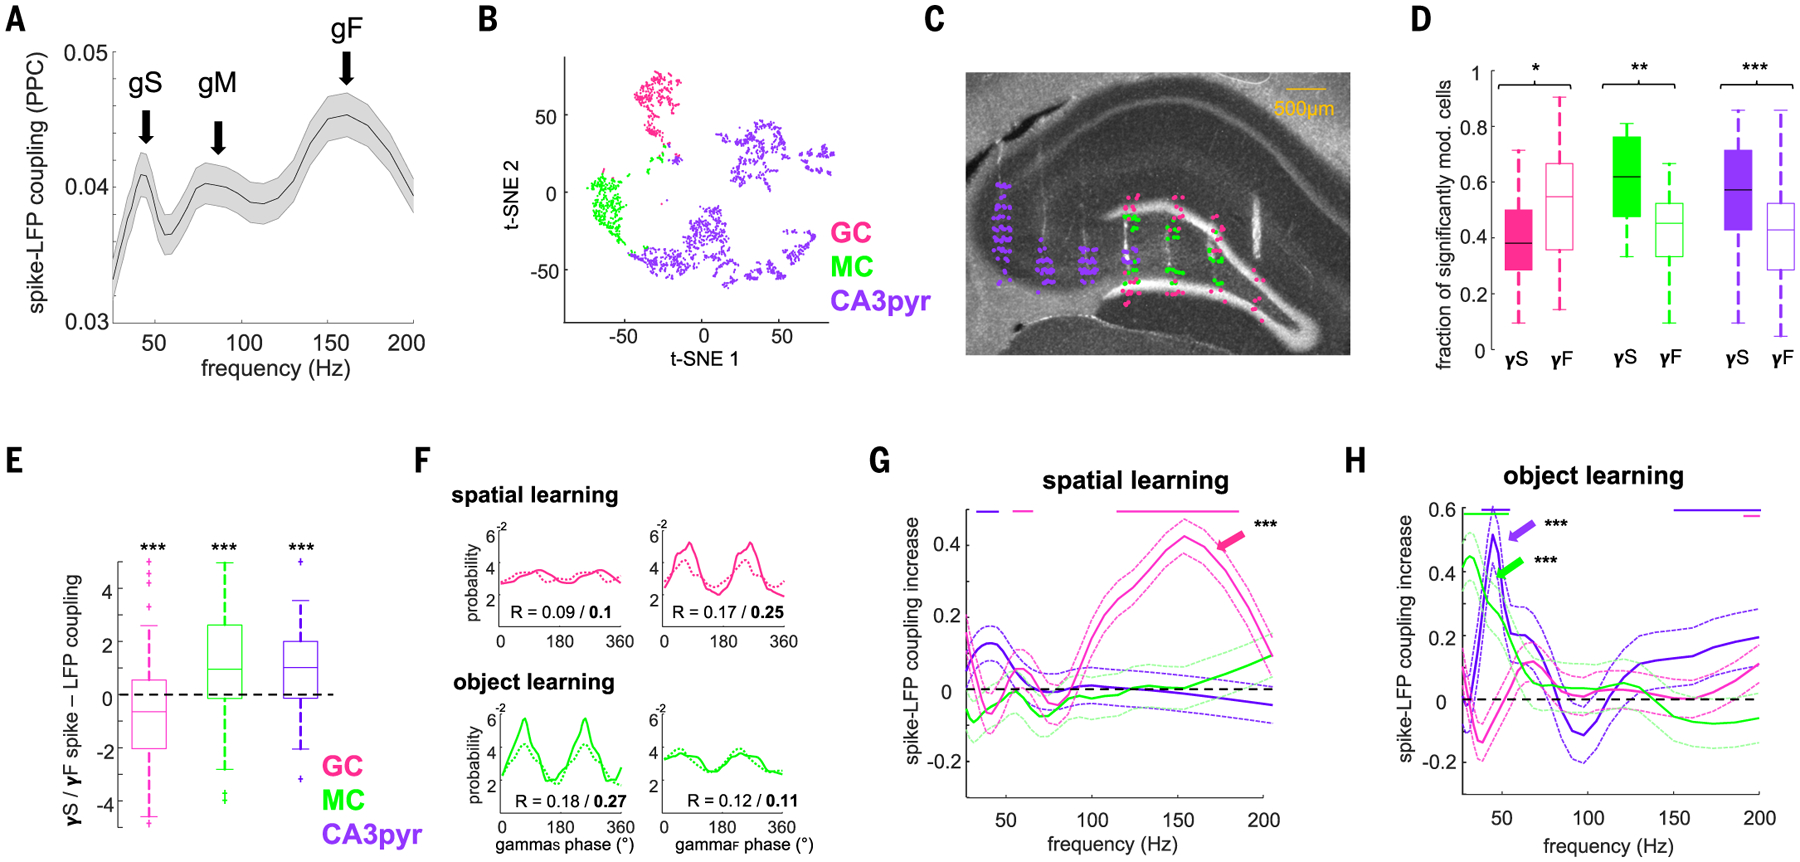
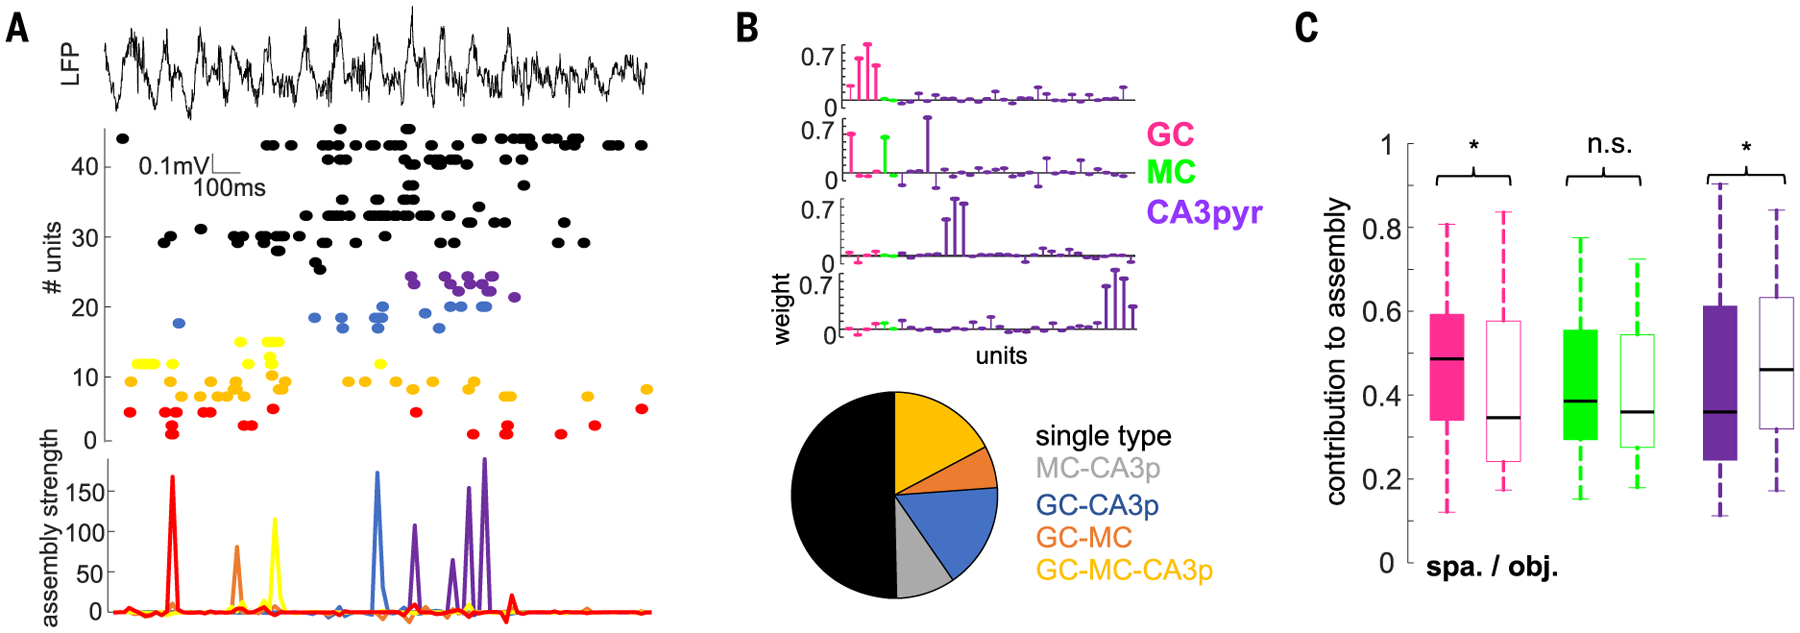
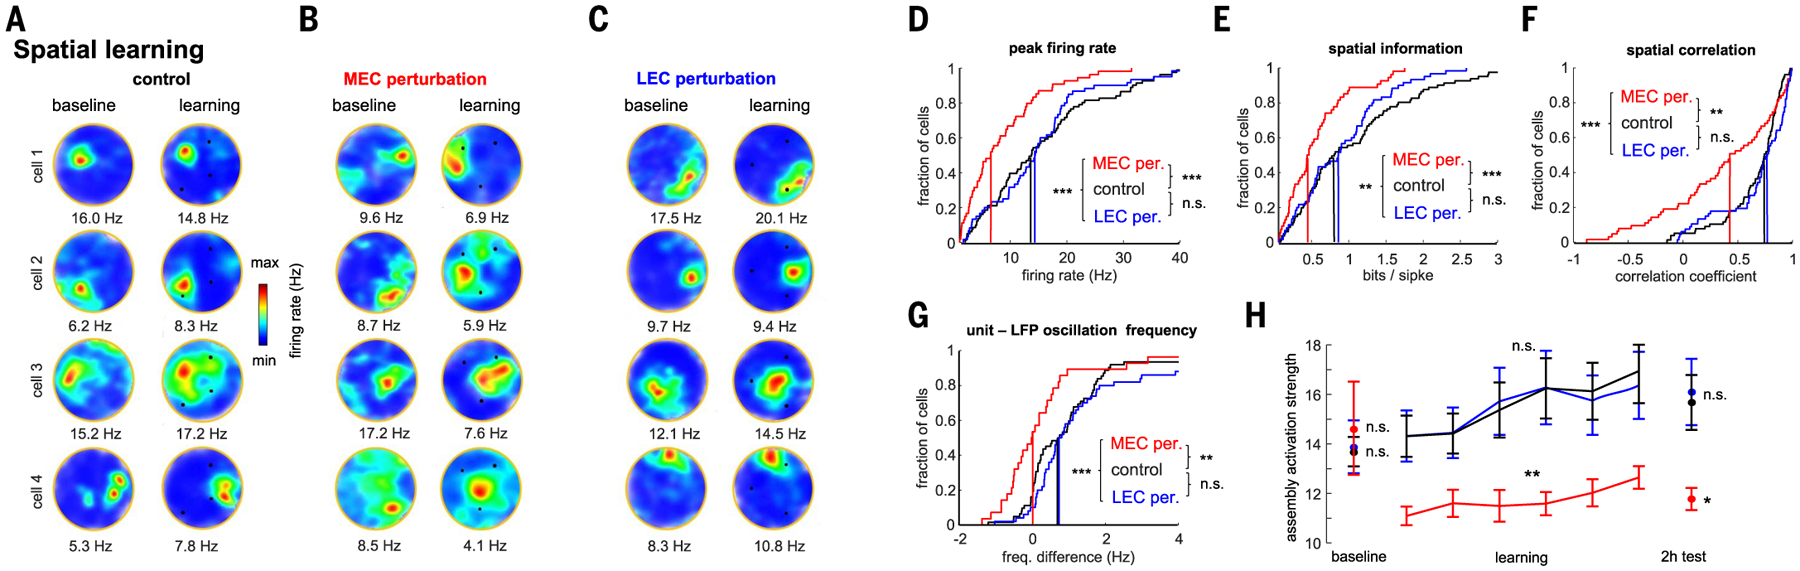
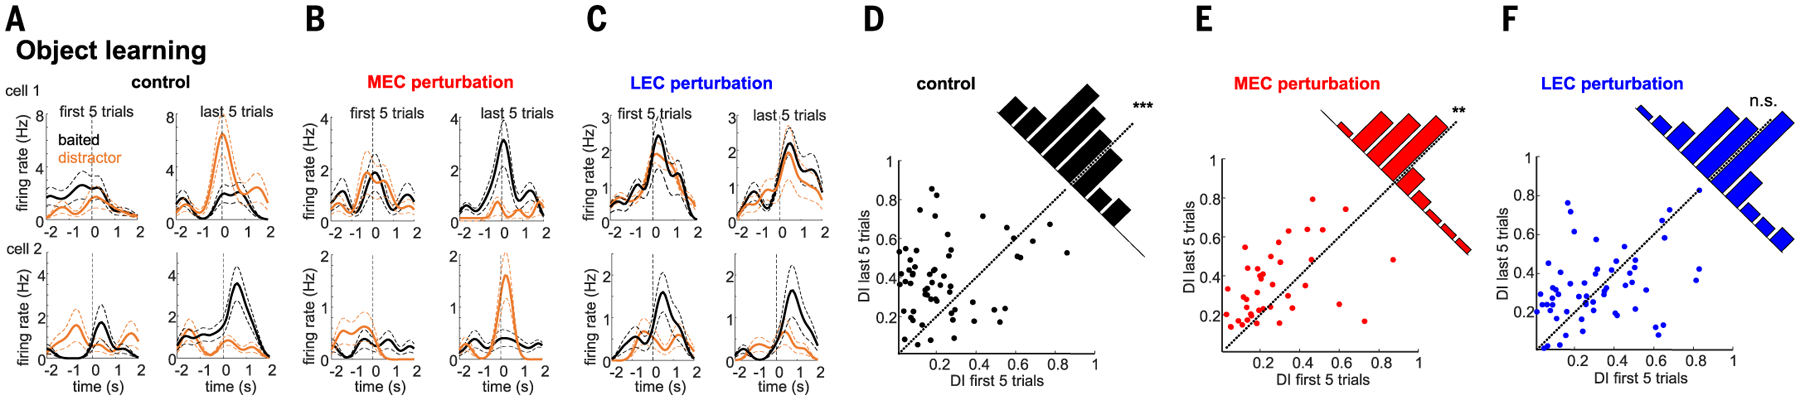
Gamma oscillations are thought to coordinate the spike timing of functionally specialized neuronal ensembles across brain regions. To test this hypothesis, we optogenetically perturbed gamma spike timing in the rat medial (MEC) and lateral (LEC) entorhinal cortices and found impairments in spatial and object learning tasks, respectively. MEC and LEC were synchronized with the hippocampal dentate gyrus through high- and low-gamma-frequency rhythms, respectively, and engaged either granule cells or mossy cells and CA3 pyramidal cells in a task-dependent manner. Gamma perturbation disrupted the learning-induced assembly organization of target neurons. Our findings imply that pathway-specific gamma oscillations route task-relevant information between distinct neuronal subpopulations in the entorhinal-hippocampal circuit. We hypothesize that interregional gamma-time-scale spike coordination is a mechanism of neuronal communication.


Conflict of interest statement

Competing interests: The authors declare no competing interests.

Figures

Fig. 1.
Fig. 1.. Experimental paradigm and optogenetic perturbation.
(A) Framework of MEC and LEC to DG communication conveying information about environmental global cues for spatial learning and object identity, respectively. We hypothesize that different gamma oscillations route these messages to specific hippocampal targets. (B) Photograph of the cheeseboard maze. (C) Histological section showing expression of Dlx-ChR2-mCherry in interneurons (orange) in MEC (sagittal slice) or LEC (coronal slice) and location of optic fibers (dashed lines). Blue is DAPI staining. (D) Schematic of the surgical implants. Three optic fibers in MEC or LEC bilaterally and silicon probe recordings in dorsal hippocampus. (E) Schema with timeline of the experiment. F) Entorhinal local perturbation and recording experiment. (F) (i) Average firing response across all entorhinal inhibitory cells showing a significant increase in their mean firing rates during 30 s of 53-Hz stimulation (1.6 ± 0.3 z-scored firing rate compared with baseline, n = 16 units from 2 rats, P < 0.001 sign-rank test). Each line is the average response of a single unit across 20 stimulation trials. Dashed lines indicate stimulation onset and offset. (ii) Average autocorrelogram for all inhibitory cells during stimulation show strong ~53-Hz modulation. (iii) Distribution of firing probability of all inhibitory units as a function of the phase of light stimulation (dashed blue line). (G) Same as (F) but for excitatory neurons (n = 86 units from 2 rats). On average, excitatory cells decreased their firing rates during stimulation (− 0.27 ± 0.06, P < 0.001, sign-rank test), although a minority of them increased their firing. Note that suppression of pyramidal cells is sixfold smaller than the magnitude of firing rate increase of interneurons.
Fig. 2.
Fig. 2.. Optogenetic perturbation of MEC or LEC selectively affects learning.
(A) Spatial learning task. (i) Example occupancy maps of the first three (left) and last three (right) learning trials. Black dots indicate locations of hidden water rewards. (ii) Learning performance quantified as time spent to find the three rewards during control (no stimulation) and MEC and LEC perturbation sessions (n = 6/6 rats in MEC and LEC tests, respectively). ANOVA with repeated measures showed a significant main effect of group (F(2,60) = 93.96, P < 10−10). (iii and iv) Memory performance during recall test 2 hours after learning (F(2,60)= 16.7, P = 1.4 × 10⁻⁶, one-way ANOVA) (iii) and 22 hours after learning (F(2,60) = 10.62, P = 1 × 10⁻⁴, one-way ANOVA) (iv). (B) Same layout as in (A) but in the object learning task. Objects marked with red rectangles cued the location of reward. Black circles indicate distractor objects. (ii) Learning performance was quantified as time spent exploring around distractor objects [same 6/6 rats as in (F); F(2,57) = 51.61, P < 10−10, repeated-measures ANOVA for group effect]. (iii and iv) Memory recall at 2 hours (iii) or 22 hours (iv) after learning was quantified with a DI (see the materials and methods; F(2,57) = 21.55, P = 7.8 × 10⁻⁸ and F(2,57) = 9.12, P = 4 × 10⁻⁴, for the 2-hour and 22-hour tests, respectively). (C) Object-in-place learning task. Same layout as in (A). In the right side of the maze (top part in the figure), the red object was rewarded and the black one served as a distractor. In the left side (bottom part in the figure), the black object was rewarded and the red one served as a distractor. Learning performance was quantified as in the object learning task (n = 4/4 rats in MEC and LEC tests). ANOVA with repeated measures showed a significant main effect of group during learning trials (F(2,44) = 136.87, P < 10−10). Memory performance was also disrupted 2 hours after learning (F(2,44)= 5.7, P = 7.6 × 10⁻³) and 22 hours after learning (F(2,44)= 13.39, P = 6.9 × 10⁻⁵). *P < 0.05, **P < 0.01, ***P < 0.001, Tukey’s post hoc test. (E) Timeline of the experiment for testing the effect of MEC and/or LEC perturbation during postlearning test sessions. (F) Memory performance in the spatial memory task for control and MEC perturbation sessions during recall test 2 hours after learning (P = 0.35, rank-sum test) (i) and 22 hours after learning (P = 0.78) (ii). (G) Memory performance in the object memory task for control and LEC perturbation sessions during recall test 2 hours (P = 0.83) (i) and 22 (ii) hours after learning (P = 0.26, rank-sum test).
Fig. 3.
Fig. 3.. MEC and LEC inputs project distinct gamma oscillations to the DG.
(A and B) Example laminar recordings across hippocampal, MEC, and LEC layers in the same animal. (A) Plots are depth profiles of averaged theta LFPs in each structure (black lines) superimposed on CSD color maps. Note the characteristic phase shift of theta oscillations across CA1pyr cell layer and EC layer 2. rad, stratum radiatum; l-m, stratum lacunosum-moleculare; mol, molecular layer; gl, GC layer; LI/II/III/V, entorhinal layers. (B) Gamma amplitude- theta frequency comodulograms (GA-TF) for each recording site (LFP) were concatenated into a single matrix. DG gammaS, gammaM, and gammaF are marked by red, white, and double arrows, respectively. (C) ICA decomposition of LFPs along the dorsoventral hippocampal axis resulted in three main ICs with currents restricted to the DG. Left: IC depth voltage profiles. Right: IC second spatial derivative (CSD). Current sinks are indicated in blue. (D) 2D CSD maps of LEC and MEC were back-projected to the anatomical electrode space (eight shanks paced 300 μm, each with 32 recording sites). (E) GA-TF comodulograms for each IC displayed modulation in a specific gamma sub-band (group data from n = 12 rats): LEC in gammaS (45 ± 2 Hz), MEC in gammaF (115 ±3 Hz), and commissural in gammaM (63 ± 3 Hz). (F) LEC, MEC, and commissural-projected gamma oscillations occur on the descending phase (47 ± 9°), trough (168 ± 3°), and ascending theta phase (284 ± 8°), respectively. Reference theta phase (black dashed line) from CA1pyr cell layer is also shown. (G) Schematic of MEC perturbation experiment. (H) GA-TF comodulograms for the LEC and MEC gamma components in an example animal without (left) and with MEC optogenetic perturbation (right). Note the strong decrease in power in MEC gammaF (arrow). (I) Group results of the effect of MEC perturbation on the power (control − perturbation/control + perturbation) of the different gamma oscillations (ICs) in the DG (**P = 3.9 × 10⁻³, signed-rank test; n = 6 rats). (J to L) Same as (D) to (F) but during LEC perturbation (**P = 0.002; n = 6 rats). MEC perturbation had stronger effect on MEC gammaM than did LEC perturbation (P = 4.1 × 10⁻⁵, rank-sum test), whereas the opposite was true for LEC gammaS (P = 6.3 × 10⁻⁴).
Fig. 4.
Fig. 4.. Task-specific gamma synchrony between entorhinal cortex and hippocampus.
(A) Learning-induced changes for MEC-DG and LEC-DG LFP-LFP gamma WPLI in the spatial and object learning tasks, respectively. Mean ± SEM WPLI (learning − baseline)/(learning + baseline) (n = 12/12 sessions in 4/4 rats for MEC and LEC, respectively). LFP traces were taken from the DG molecular layer and EC layer 2. Red and blue lines indicate frequencies with a significant effect (P < 0.05 with Bonferroni correction for multiple comparisons). In the spatial task, DG WPLI increased more with MEC than with LEC in the gammaF band (P = 4.8 × 10⁻⁶, rank-sum test), whereas in the object task it increased more with LEC than MEC in the gammaS band (P = 9.0 × 10⁻⁵). (B) Spike-LFP coupling (PPC) between spikes of layer II MEC and DG gamma LFP and LEC LII excitatory neurons and DG gamma LFP during spatial or object learning, respectively (n = 192/95 MEC cells in the spatial and object tasks and n = 72/128 LEC cells, from four rats in each case). In the spatial task, DG spikes’ PPC increased more with MEC gammF LFP than with LEC (P = 3.8 × 10⁻³, rank-sum test), whereas in the object task, it increased more with gammaS LEC LFPs than with MEC (P = 1.4 × 10⁻⁴). (C) Learning-induced power change for DG LEC gammaS and MEC gammaF oscillations in the two tasks (P = 6.3 × 10⁻⁷/0.0033 gammaS versus gammaF, signed-rank test, n = 36/24 sessions in the spatial and objects tasks from 12 rats). In (A) to (C), **P < 0.01, ***P < 0.001, signed-rank test for learning versus baseline effect in the gammaS or gammaF bands. (D) Schema summarizing the spatiotemporal organization of LEC and MEC gamma inputs to the DG.
Fig. 5.
Fig. 5.. Entorhinal gamma inputs differentially engage hippocampal neuronal populations during learning.
(A) Distribution of spike-gamma LFP coupling (PPC) of all neurons in the DG/CA3 with DG molecular layer LFPs yielded three distinct peaks in the gammaS (gS), gammaM (gM), and gammaF (gF) sub-bands (arrows). (B) t-distributed stochastic neighbor embedding (t-SNE) plot illustrating the separation of putative CA3pyr cells (n = 1554), GCs (n = 377), and MCs (n = 323) on the basis of physiological criteria (see the materials and methods; n = 20 rats). (C) Anatomical location of GCs, MCs, and CA3pyr cells in an example animal. Histological section shows tracks of silicon-probe array shanks across the transversal axis of CA3-DG (DAPI staining). (D) Fraction of neurons significantly modulated (P < 0.05, Rayleigh test) by gammaS (γS) and gammaF (γF) (GCs, P = 0.01; MCs, P = 0.0012; CA3pyr cells, P = 5.7 × 10⁻⁵, rank-sum test). (E) Ratio of spike-gamma LFP coupling [PPC (gammaS − gammaF)/(gammaS + gammaF)] for each cell type (GCs, P = 1.4 × 10⁻³; MCs, P = 1.5 × 10⁻⁴; CA3pyr cells, P = 9.9 × 10⁻⁵, signed-rank test). (F) (Top) Example GC firing modulation by gammaS phase (left) and gammaF (right) during baseline (dashed) and spatial learning (solid) sessions. (Bottom) Example MC firing modulation by gammaS (left) and gammaF (right) during baseline and object learning. (G) During spatial learning spike-gammaF coupling (PPC) selectively increased for GCs (arrow) (P = 3.6 × 10⁻³, signed-rank test, n = 201) but not for MCs (P > 0.05, n = 145) or CA3pyr cells (P > 0.05, n = 704). y axis shows the difference between learning session and prelearning exploration session spike-DG molecular layer LFP PPC. Color lines indicate frequencies with a significant effect for the respective cell types (P < 0.05, with Bonferroni correction for multiple comparisons). (H) Same as (G) but during object learning. Spike-gammaS coupling increased for MCs (P = 1.1 × 10⁻⁴, n = 111) and CA3pyr cells (P = 2.1 × 10⁻⁵, n = 548) but not GCs (P > 0.05, n = 130).
Fig. 6.
Fig. 6.. Neuronal assembly composition is task specific.
(A) Activation of cell assemblies during an example learning trial. Shown is a LFP and raster plot of spiking of simultaneously recorded neurons (top, middle; color-coded) and activation of individual assemblies (bottom). For this figure, a 20-ms time window was used for assembly detection (see the materials and methods). (B) Weight vectors of three representative assemblies in one session (top) and proportion of assemblies (bottom) with GCs, MCs, or CA3pyr cell members or their combinations (n = 182 assemblies from 20 rats). (C) Cell-type contribution to assemblies in the spatial and object learning tasks (n = 77/83 GCs 36/44 MCs, and 237/186 CA3pyr cell assembly members in spatial and object tasks; F(647,2) = 5.37, P = 4.8 × 10⁻³, two-way ANOVA). *P < 0.05, rank-sum test.
Fig. 7.
Fig. 7.. Effect of entorhinal circuit perturbation on place cell coding properties.
(A to C) Example CA3-DG firing rate maps during baseline (left column) and spatial learning (right column) during control and MEC (B) or LEC (C) perturbation sessions. (D to G) Spatial coding metrics for control (n = 81 place cells), MEC (n = 54), and LEC (n = 60) perturbation sessions (during learning trials, n = 36 sessions from 10 rats). Vertical lines indicate median of the distributions. ***P < 0.001, rank-sum test MEC and LEC perturbation versus control. (H) Activation strength of CA3-DG assemblies for control learning trials (n = 93 assemblies from 10 rats) and for MEC (n = 44) and LEC (n = 58) perturbation sessions during baseline, learning (each point is a five-trial block), and 2-hour postlearning recall. *P < 0.05, **P < 0.01, ***P < 0.001, rank-sum test.
Fig. 8.
Fig. 8.. Effect of entorhinal circuit perturbation on object-related firing.
(A to C) Two example single-cell responses each to cue and distractor objects for the first and last five trials of a control (A), MEC (B), and LEC (C) perturbation session. (D to F) Object DIs (see the materials and methods) were higher in the last five learning trials compared with the first five trials in control sessions [(D); P = 7.4 × 10⁻⁶, signed-rank test, n = 64 CA3-DG cells from 10 rats] and MEC perturbation sessions [(E); P = 2.1 × 10⁻³, n = 42 cells] but did not change during LEC perturbation [(F); P = 0.47, n = 47 cells]. MEC versus sham: P = 0.08, rank-sum test; LEC versus sham: P = 0.0014.

References

    1. Singer W, Synchronization of cortical activity and its putative role in information processing and learning. Annu. Rev. Physiol 55, 349–374 (1993). doi: 10.1146/annurev.ph.55.030193.002025 - DOI - PubMed
    1. Engel AK, Fries P, Singer W, Dynamic predictions: Oscillations and synchrony in top-down processing. Nat. Rev. Neurosci 2, 704–716 (2001). doi: 10.1038/35094565 - DOI - PubMed
    1. Fries P, Neuronal gamma-band synchronization as a fundamental process in cortical computation. Annu. Rev. Neurosci 32, 209–224 (2009). doi: 10.1146/annurev.neuro.051508.135603 - DOI - PubMed
    1. Buzsáki G, Wang XJ, Mechanisms of gamma oscillations. Annu. Rev. Neurosci 35, 203–225 (2012). doi: 10.1146/annurev-neuro-062111-150444 - DOI - PMC - PubMed
    1. Lisman JE, Jensen O, The θ-γ neural code. Neuron 77, 1002–1016 (2013). doi: 10.1016/j.neuron.2013.03.007 - DOI - PMC - PubMed

Publication types